Liberals ahead by 4. Erin O’Toole making some progress improving his image while NDP support continuing to rise.
August 24, 2021
We just completed a national survey of 2,000 Canadian adults eligible to vote (August 17 to 22, 2021).
After the first week of the campaign, here’s what we are seeing:
GOVERNMENT APPROVAL
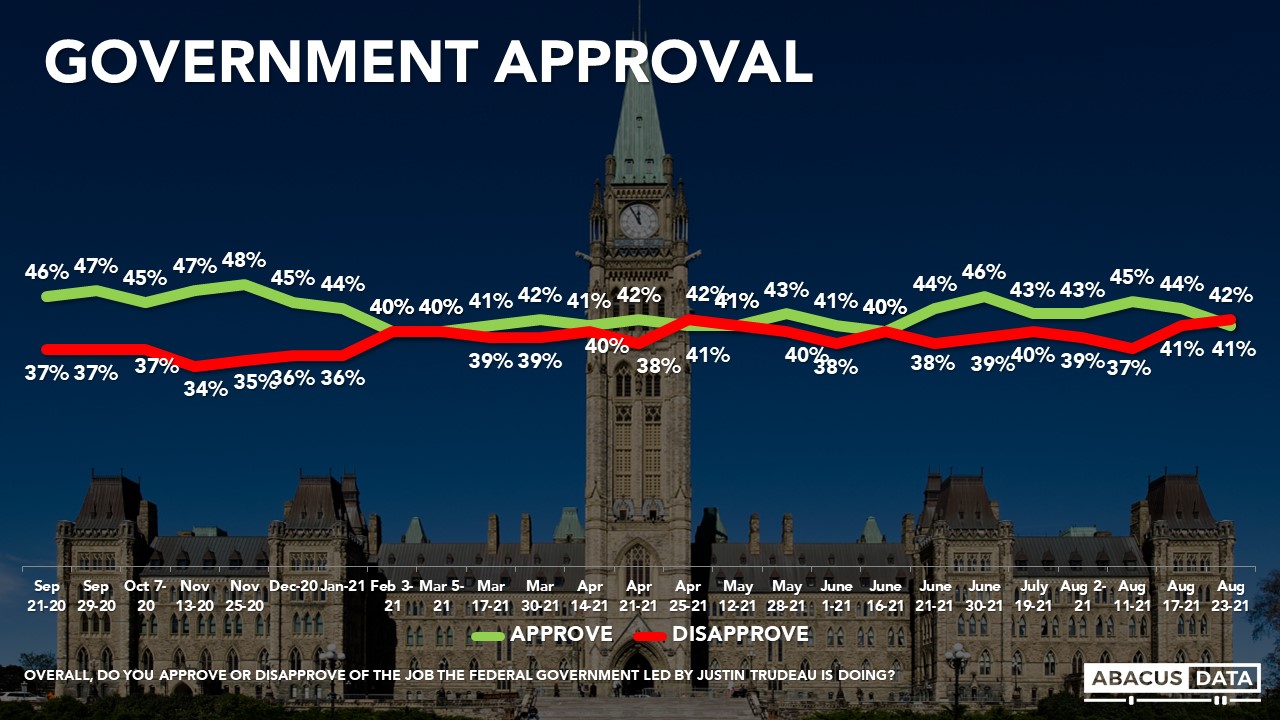
Today 41% approve of the job being done by the Trudeau government, while 42% disapprove. Regionally, net approval is +4 in BC, -36 in Alberta, -22 in Saskatchewan and Manitoba, +3 in Ontario, +11 in Quebec, and +7 in Atlantic Canada.
DESIRE FOR CHANGE
At the time of the 2019 election, 69% wanted change including 52% who felt strongly about it. Today, 71% want change, which includes 44% who feel strongly about it. The desire for change hasn’t changed much in the past week.
LEADER IMPRESSIONS
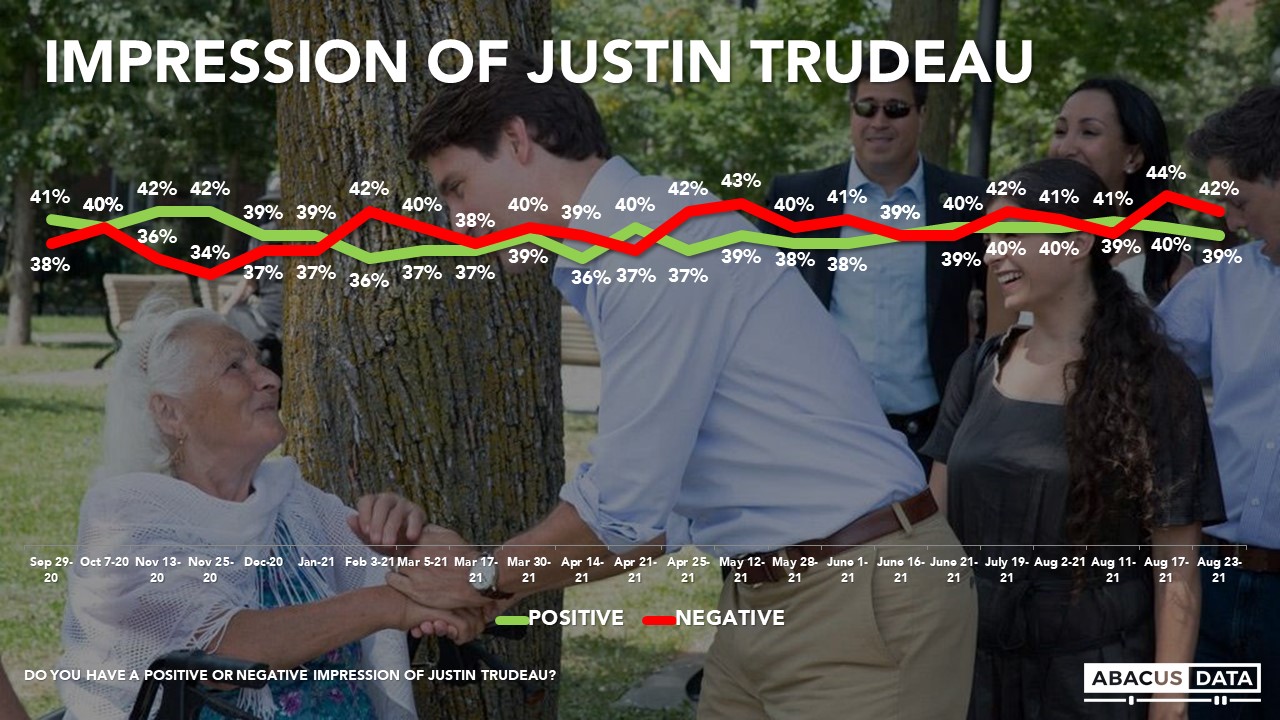
Justin Trudeau enjoys a positive impression among 39% and negative impressions among 42%, for a net score of -3. This is unchanged from last week. Regionally, Trudeau is +2 in BC, -41 in Alberta, -21 in SK/MB, 0 in Ontario, +9 in Quebec, and +11 in Atlantic Canada.
Jagmeet Singh enjoys a positive impression among 42% and finds negative impressions among 24% for a net score of +18. Positive impressions of Mr. Singh are up slightly in the last week (+3). Regionally, Mr. Singh’s is +34 in BC, +3 in AB, +23 in SK/MB, +18 in Ontario, +10 in Quebec, and +22 in Atlantic Canada.

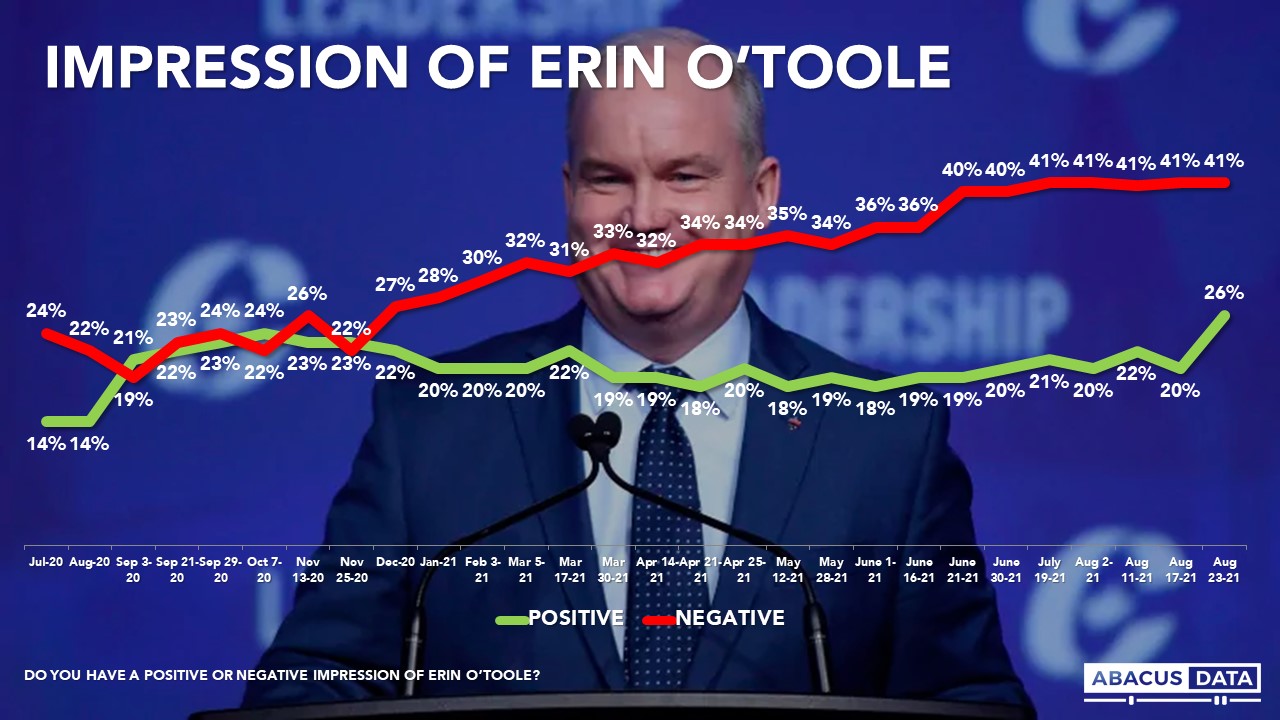
Erin O’Toole’s image has improved over the past week. Today 26% have a positive impression of the Conservative leader (+5) while his negatives remain at 41% for a net score of -15. Regionally, Mr. O’Toole is -20 in BC, +1 in AB, -14 in SK/MB, -16 in Ontario, -15 in Quebec, and -7 in Atlantic Canada.
In terms of whether people’s views are improving or declining of the three main party leaders, we find Mr. Trudeau has the lowest momentum score while Mr. Singh has the highest.
• Justin Trudeau: 20% say their impressions are improving, 36% declining, for a momentum score of -16. Among those open to voting Liberal but not currently supporting the party, 18% say their views of Mr. Trudeau are improving while 25% say they are declining (score -7).
• Erin O’Toole: 24% say their impressions are improving, 28% declining, for a momentum score of -4. Among those open to voting Conservative but not currently supporting the party, 28% say their views of Mr. O’Toole are improving while 16% say they are declining (score +12). Among those with a neutral view of Mr. O’Toole, 18% say their views are improving while 12% say they are declining.
• Jagmeet Singh: 32% say their impressions are improving, 16% declining, and 52% not changing for a momentum score of +16. Among those open to voting NDP but not currently supporting the party, 41% say their views of Mr. Singh are improving while 5% say they are declining (score +36).
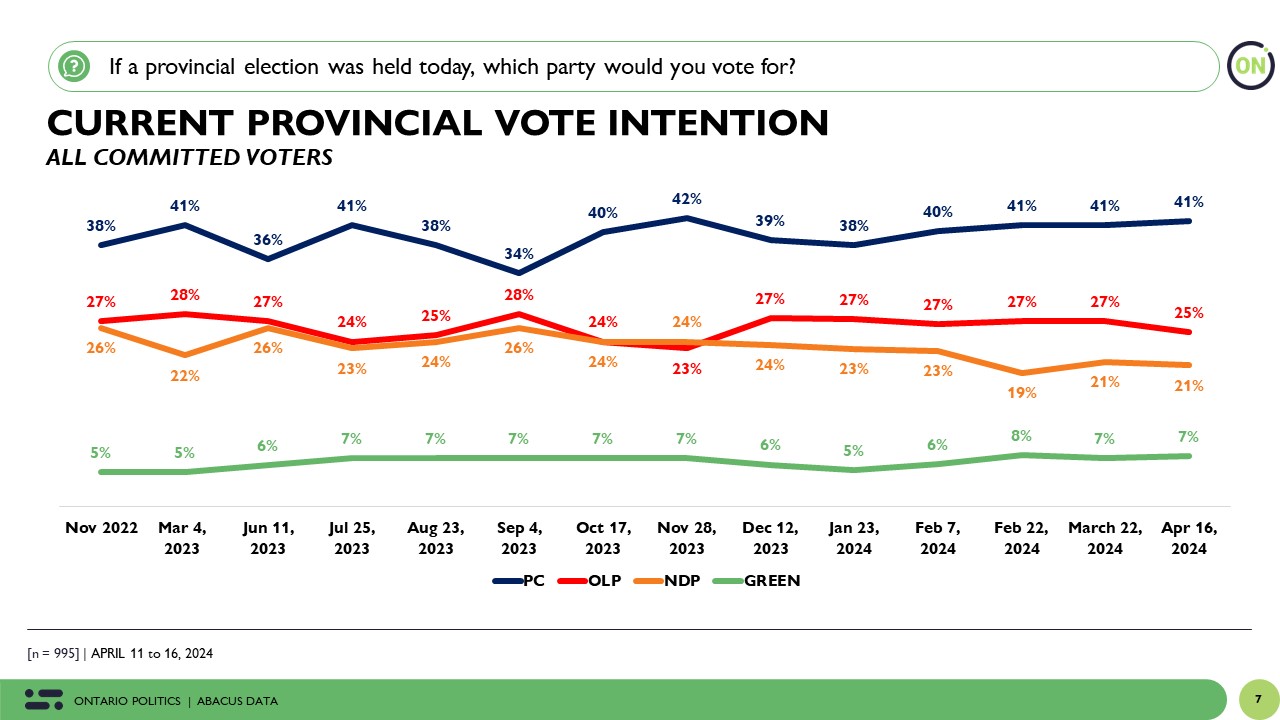
FEDERAL VOTE INTENTION
If the election were today:
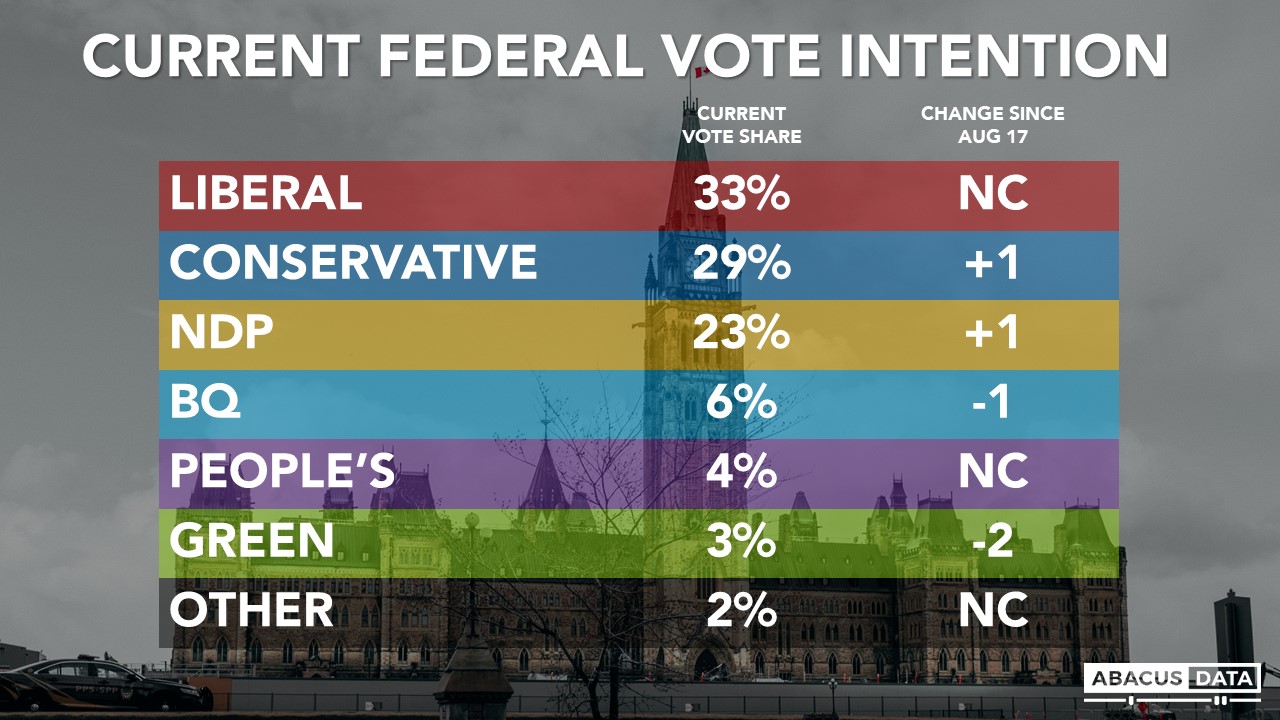
• The Liberals would win 33% of the vote (unchanged from last week, and the same result they got in 2019).
• The Conservatives would garner 29% (+1 from last week but still down 5 from their 2019 result)
• The NDP would get 23% of the vote (+1 over the week, and 7-points above their 2019 result)
• The Green Party would find 3% support (-2 in a week and down 4 from 2019.
• The BQ at 29% in Quebec (down 2 from last week down 3 from their 2019 result.
The regional races look like this:
• In BC, we see the Liberals at 33%, the NDP at 31% and the Conservatives at 28%. The Greens are at 7%.
• In Alberta, 45% would vote Conservative, 30% for the NDP, 15% for the Liberals, and 5% for the People’s Party.
• In Manitoba and Saskatchewan, the Conservatives lead by 9 over the NDP and Liberals.
• In Ontario, the Liberals lead by 6 (36% to 29% for the Conservative Party) with the NDP close behind at 26%. The People’s Party is at 5% in Ontario.
• In Quebec, we see the Liberals with 35%, followed by the BQ (29%), the Conservatives (19%) the NDP at 11%. The Greens are at 3% in Quebec.
• In the Atlantic provinces, the Liberals (45%) are well ahead of the Conservatives (32%) and the NDP (16%).

Some additional breakouts that are worth noting:
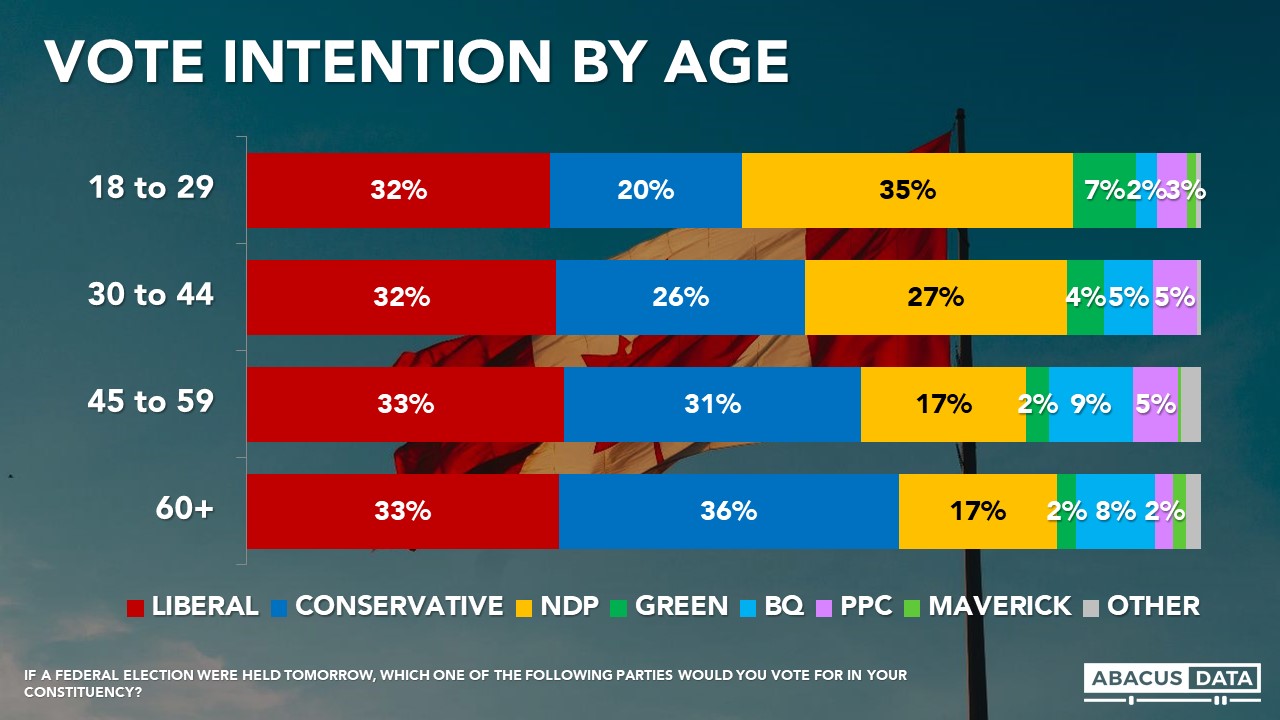
• The NDP and Liberals are statistically tied among those under 30 (NDP 35%, LPC 32%, CPC 20%). The Liberals have a 5-point lead among those aged 30 to 44 (LPC 32%, NDP 27%, CPC 26) while the Conservatives and Liberals are competitive among those aged 45 and over.
• The Liberals have a 7-point lead among those with a university education while the Conservatives have a 4-point lead among those with a high school diploma or less.
• Among union members, 38% would vote Liberal, 28% Conservative and 21% NDP. The NDP does slightly better among those who are not unionized.
• Among those who have received CERB or live in a household who has received CERB, the Liberals are ahead by 8 (LPC 36%, NDP 28%, CPC 26%).
• Among homeowners, the Conservatives lead by 6 (CPC 36%, LPC 30%, NDP 19%). Among renters, the Liberals lead by 14 over the NDP (LPC 39%, NDP 25%, CPC 20%).
VOTE BY THOSE WHO SAY THEY DEFINITELY WILL VOTE
Among the 72% of respondents who said they would definitely be voting, the Liberals and Conservatives are tied at 31% with the NDP at 22%. The BQ is at 7%, the People’s Party at 4%, and the Greens at 3%.

OPEN TO CHANGING MIND?
Right now, 60% of decided voters say they have made up their mind and won’t change while 40% say they could still change their mind about who to vote for.
About two-thirds of Conservative, BQ, and Liberal supporters say their mind is made up (69%, 67%, and 63%), while less than half of NDP (47%) and Green (42%) supporters say they are locked into their choice.

Among those who are firm in their choice, the vote split is 34% Liberal, 34% Conservative, and 18% NDP.
It’s clear many current NDP and Green supporters are still up for grabs. Among these soft NDP and Green supporters, 79% would prefer Justin Trudeau as Prime Minister over Erin O’Toole and 83% would prefer some form of Liberal government while 17% would prefer a Conservative government of some form.
INTRODUCING THE SWITCHERS
To understand the potential shifts in the electorate over the final four weeks of the campaign, we identify two key voter groups: LPC/CPC switchers and LPC/NDP switchers.
LPC/NDP Switchers are those whose first preference is either Liberal or NDP and whose second preference is either Liberal or NDP. In total, they make up 21% of the entire electorate.
Currently, 55% of this group would vote Liberal and 45% would vote NDP. In 2019, 55% voted Liberal, 23% voted NDP and 17% did not vote. 3% voted Conservative while 1% voted Green.
79% have a positive impression of Mr. Singh while 63% have a positive impression of Mr. Trudeau. 55% would prefer Mr. Trudeau as PM after the election while 44% would prefer Mr. Singh.
76% think the Liberals are going to win the election versus 14% who think the NDP will win. 7% are unsure.
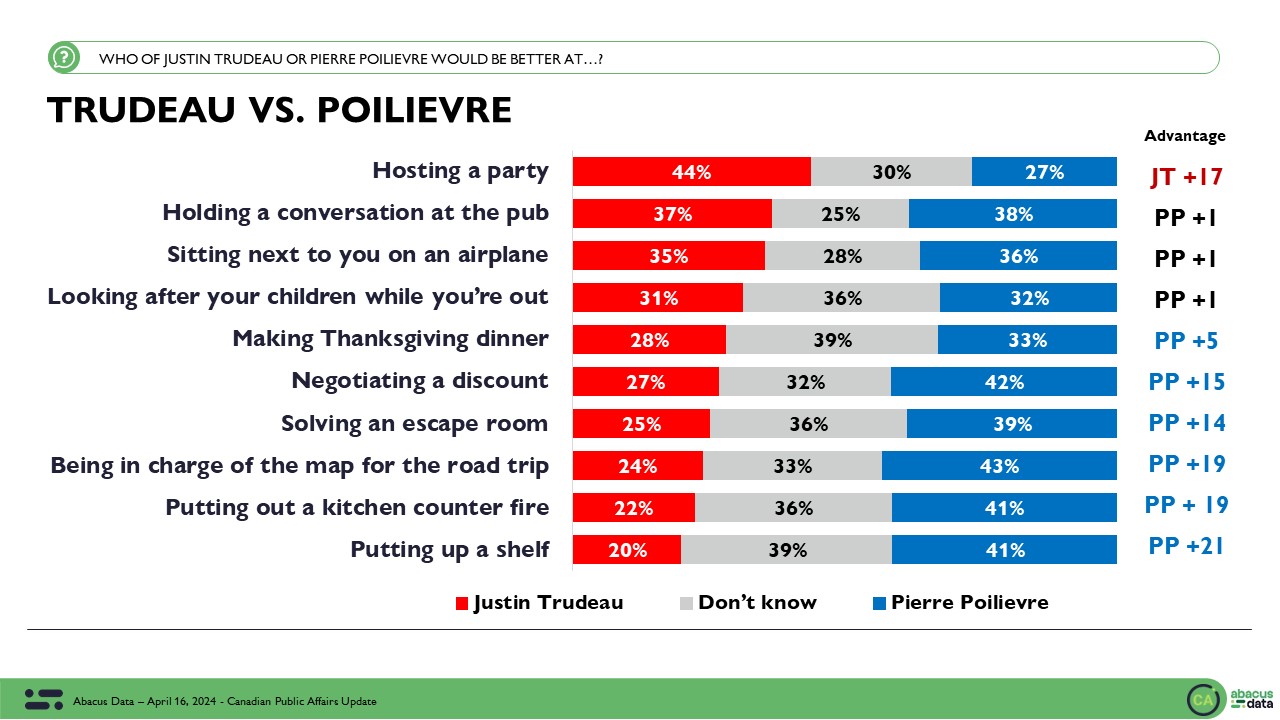
Between Justin Trudeau and Erin O’Toole, 97% would prefer Mr. Trudeau to be Prime Minister after the election while 3% would prefer Mr. O’Toole. 99% would prefer a Liberal government and 1% would prefer a Conservative government.
When asked to select the top two issues from a list, 30% selected cost of living, 29% selected climate change, 24% improving the healthcare system and 20% selected making housing more affordable. 16% said getting more people vaccinated and getting the country back to normal quicker was a top 2 issue for them.
LPC/CPC Switchers are respondents whose first preference is either Liberal or Conservative and whose second preference is either Liberal or Conservative. In total, they make up 9% of the entire electorate.
Currently, 64% of this group would vote Liberal and 36% would vote Conservative. In 2019, 50% voted Liberal, 25% Conservative, 3% NDP, and 21% did not vote.
62% have a positive impression of Mr. Trudeau compared with 42% for Mr. O’Toole although 44% have a neutral opinion of Mr. O’Toole.
72% think the Liberals are going to win the election versus 21% who think the Conservatives will win. 55% are unsure. 73% would prefer a Liberal government after the election while 27% would prefer a Conservative one.
When asked to select the top two issues from a list, 29% selected improving Canada’s health care system, 28% picked growing the economy, and 26% reducing the cost of living. 18% said getting more people vaccinated and getting the country back to normal quicker while 14% picked climate change and reducing carbon emissions.
A CLOSER LOOK AT ONTARIO
In Canada’s most populous province the Liberals hold a 6-point lead over the Conservatives (35% to 29%) which is unchanged from last week. The NDP is not far behind at 26%.
Regionally in Ontario, we find the Liberals well ahead in Toronto (Liberal 48%, Conservative 22%, NDP 20%) but a close three-way race in the Greater Toronto/Hamilton/Niagara region. The Liberals are at 32%, the Conservatives 31%, and the NDP 30%. In Eastern Ontario, we have the Conservatives and Liberals basically tied (36% to 35%) with the NDP at 21% while in Southwestern Ontario, the Liberals and Conservatives are tied at 30% with the NDP not far behind at 25%.
Some other insights to consider:
• Accessible voter pools: In Ontario, the pool of accessible voters is 57% for the Liberals (-4 since before the election), 52% for the NDP (unchanged) and 47% for the Conservatives (+5 since before the election).
• Leader Impressions: While positive impressions of Mr. Singh are largely consistent (before election call 43%, today 42%), those with positive views of Mr. O’Toole in Ontario are up 3 (21% to 24%) and Mr. Trudeau’s positives are down marginally by 2-points (43% to 41%).
• Desire for Change: There has been no change in the more intense desire for change in Ontario. Before the campaign, 43% of Ontarians definitely wanted a change in government, the same number as today.
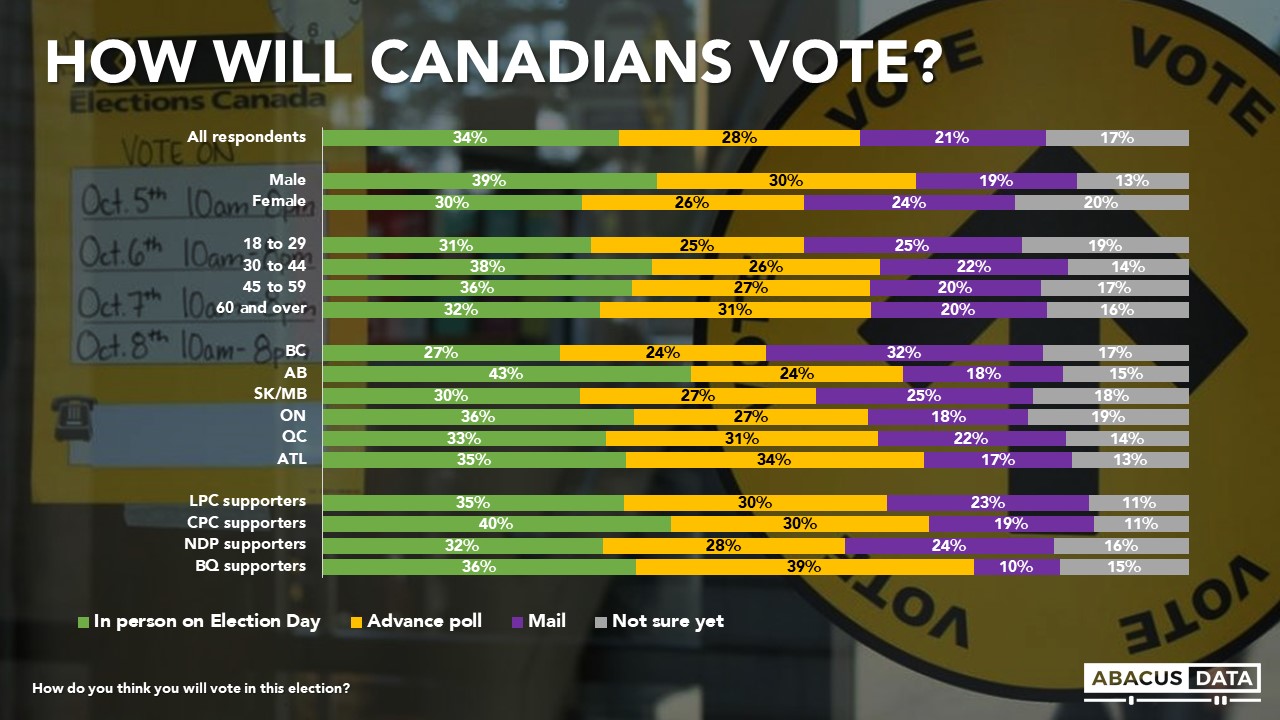
METHOD OF VOTING?
When asked how they think they will vote in this election, 34% said they planned to vote in person on Election Day, 28% planned to vote at an advance polling location before election day, while 21% intend to vote by mail. 17% were not sure yet.
Among those who say they will definitely be voting in the election, 38% plan to vote in person on Election Day, 31% at an advance poll, and 18% by mail.
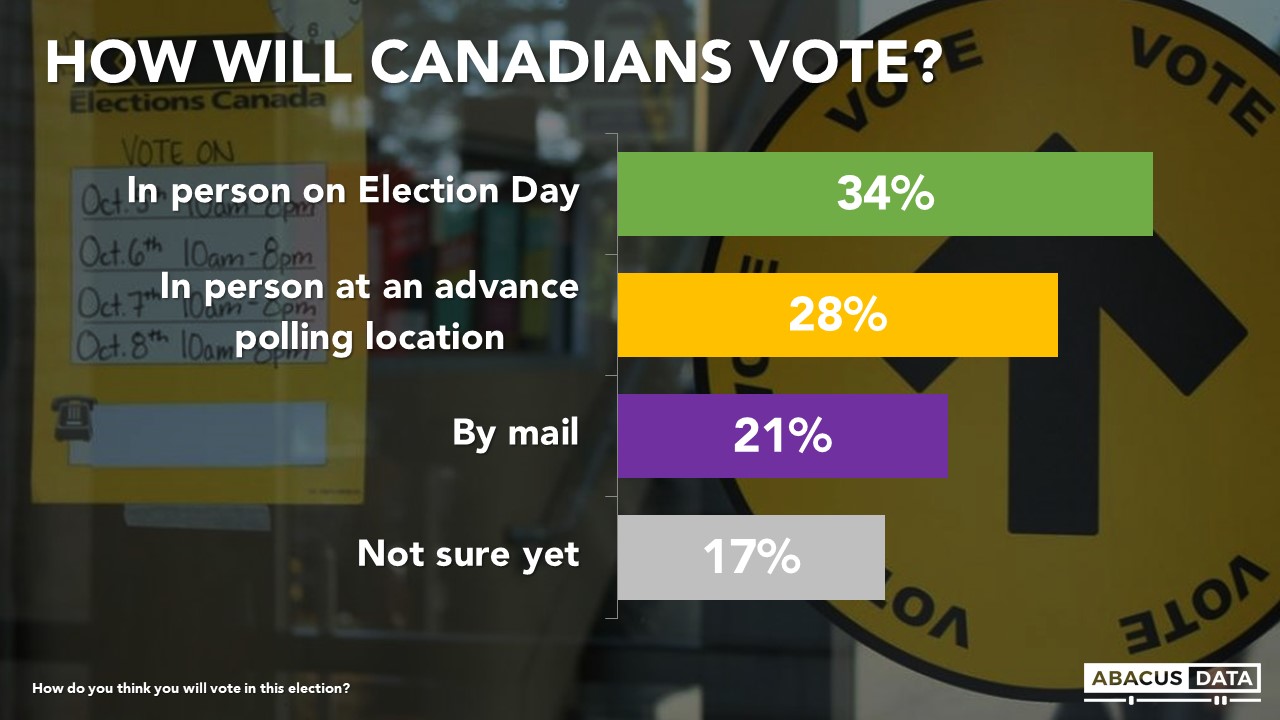
Liberal and NDP supporters are more likely to say they intend to vote by mail (Liberal 24%, NDP 25%, CPC 18%) while Conservative supporters are more likely to say they will vote in person on Election Day (CPC 41%, 34% Liberal, NDP 32%).
UPSHOT
According to Bruce Anderson: “Voters are signalling that now that the hypothetical election is an actual election, they will consider their choices carefully, and are open to persuasion. There’s no doubt that younger voters in particular are showing high levels of interest in the NDP as we’ve reported on for a few months and this trend is continuing. Erin O’Toole is out of the gates well, but still has an image deficit relative to his competitors and Conservative vote intention is hobbled a bit by the presence of the People’s Party on the ballot.
The Liberals see competition from the Conservatives among older voters and from the NDP among younger voters. Clearly there is more to be gained or lost with progressive voters, with so many NDP and Green Party voters unsure if they really want a change in government, and definitely preferring a Liberal to a Conservative outcome. It’s too early to read much into the public mood about any specific thing that has happened in the campaign, but it’s not too early to know that a lot of different outcomes are possible, and winning the vote will take real effort and getting those ballots cast will also require an unusual effort by the campaigns.”
According to David Coletto: “After week one of the campaign, the Liberals continue to hold a five-point national lead over the Conservatives and not a lot has changed in many of the metrics we regularly track like mood, desire for change, government approval, or leader impressions.
Mr. O’Toole seems to have made the most progress over the first week as his positives are up 6-points in a week. Although, the Conservative vote share remains below 30%.
Based on our momentum numbers, Mr. Singh likely had the best week with Mr. O’Toole not far behind. Mr. O’Toole seems to have made a lot of progress over the first week as his positives are up 6-points in a week but he still has a wide affinity gap that he will need to close quickly. The NDP are inching up, especially in Ontario, but the Conservatives are still stuck below 30% in our tracking.
This data also shows that much of NDP and Green support is soft, and many might be persuaded to vote strategically if the Conservatives appear in contention. By a 66-point margin, soft NDP and Green supporters would prefer some form of Liberal government rather than a Conservative government after the election is over.
If voters want this election to be about affordability, housing, the economy, and climate change, the results of this survey give us some insight into how those potential ballot questions are playing out.
Right now, neither Mr. Trudeau nor Mr. O’Toole has an advantage on the economy. Mr. Singh has a slight advantage on housing, while the Liberals and Mr. Trudeau lead on who voters think is best on climate change.
But when it comes to affordability and reducing the cost of living – the NDP, Liberals, and Conservatives are all within three points of each other and none of them have a clear advantage on the issue more voters say will drive their vote than on any other.”
METHODOLOGY
The survey was conducted with 2,000 Canadian adults from August 17 to 22, 2021. A random sample of panelists were invited to complete the survey from a set of partner panels based on the Lucid exchange platform. These partners are typically double opt-in survey panels, blended to manage out potential skews in the data from a single source.
The margin of error for a comparable probability-based random sample of the same size is +/- 2.2%, 19 times out of 20.
The data were weighted according to census data to ensure that the sample matched Canada’s population according to age, gender, educational attainment, and region. Totals may not add up to 100 due to rounding.
Abacus Data follows the CRIC Public Opinion Research Standards and Disclosure Requirements that can be found here: https://
The survey was commissioned and paid for by Abacus Data Inc.


ABOUT ABACUS DATA
We are the only research and strategy firm that helps organizations respond to the disruptive risks and opportunities in a world where demographics and technology are changing more quickly than ever.
We are an innovative, fast-growing public opinion and marketing research consultancy. We use the latest technology, sound science, and deep experience to generate top-flight research-based advice to our clients. We offer global research capacity with a strong focus on customer service, attention to detail and exceptional value.
We were one of the most accurate pollsters conducting research during the 2019 Canadian Election.
Contact us with any questions.
Find out more about how we can help your organization by downloading our corporate profile and service offering.