Liberal fortunes strengthen; Conservatives shed 5 points in a month
June 24, 2021
Our latest national survey of 2,070 Canadian adults from June 18 to 21, 2021 finds the Liberals opening a 10-point lead over the Conservatives as the federal government’s approval rating improves.
APPROVAL OF FEDERAL GOVERNMENT
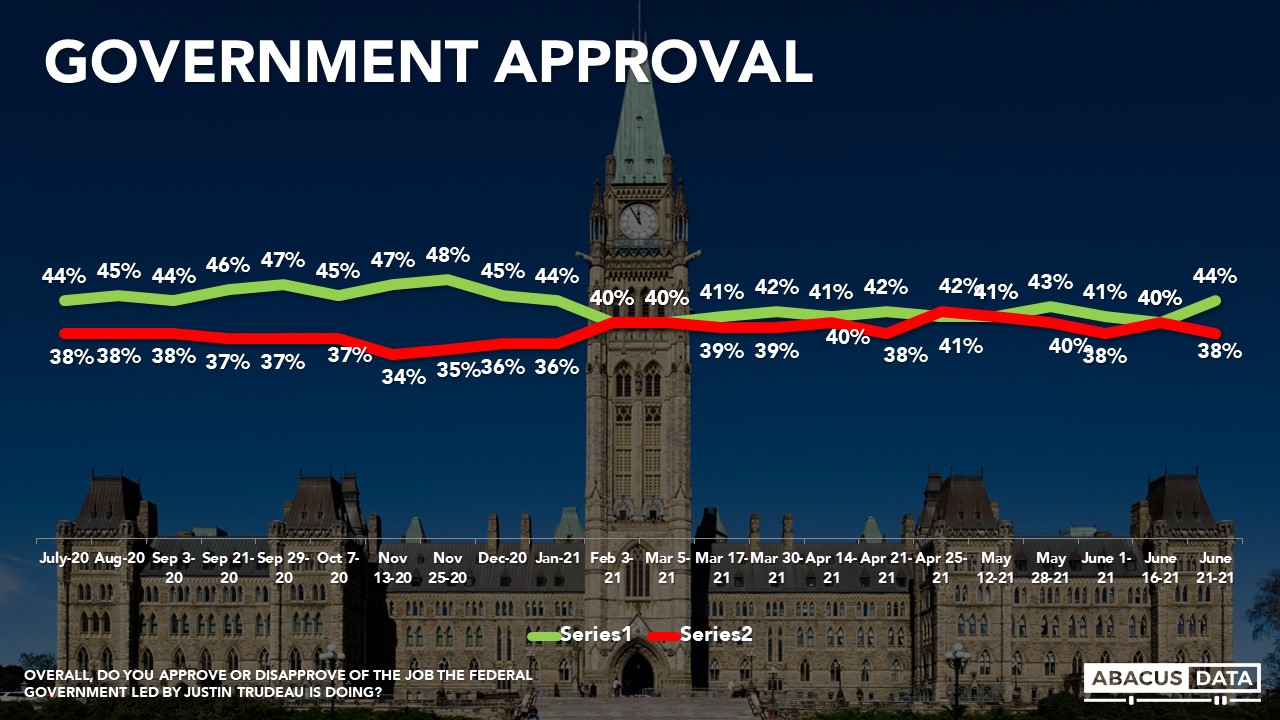
Since our last survey, we see a four-point rise in approval of the federal government’s performance, to 44% with 38% disapprove. While movement on this indicator has been very limited this year, 44% is the highest number we recorded since January.
CURRENT VOTING INTENTION
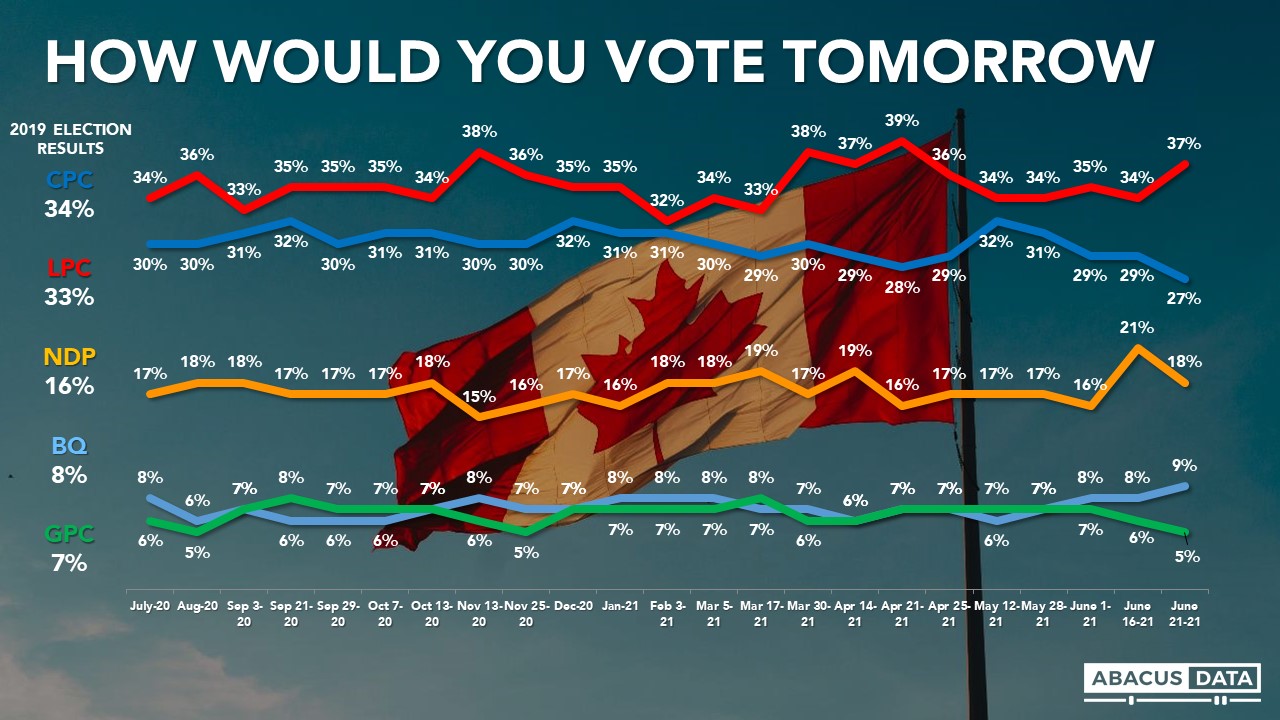
If an election were held now, the Liberals would win 37% of the vote, the Conservatives 27%, the NDP 18%, the Green Party 5% and the BQ would get 39% in Quebec. The Liberals are up 3 points since mid-June, the Conservatives are down 2, and at the lowest vote share in over four years.
Comparing these results to the outcome of the 2019 election, the Liberals are 4 points higher, the Conservatives 7 points lower, and the NDP 2 points higher.
While regional breakdowns are obviously important, readers are encouraged to read these breaks with appropriate caution, as sample sizes are smaller and margins of error higher.
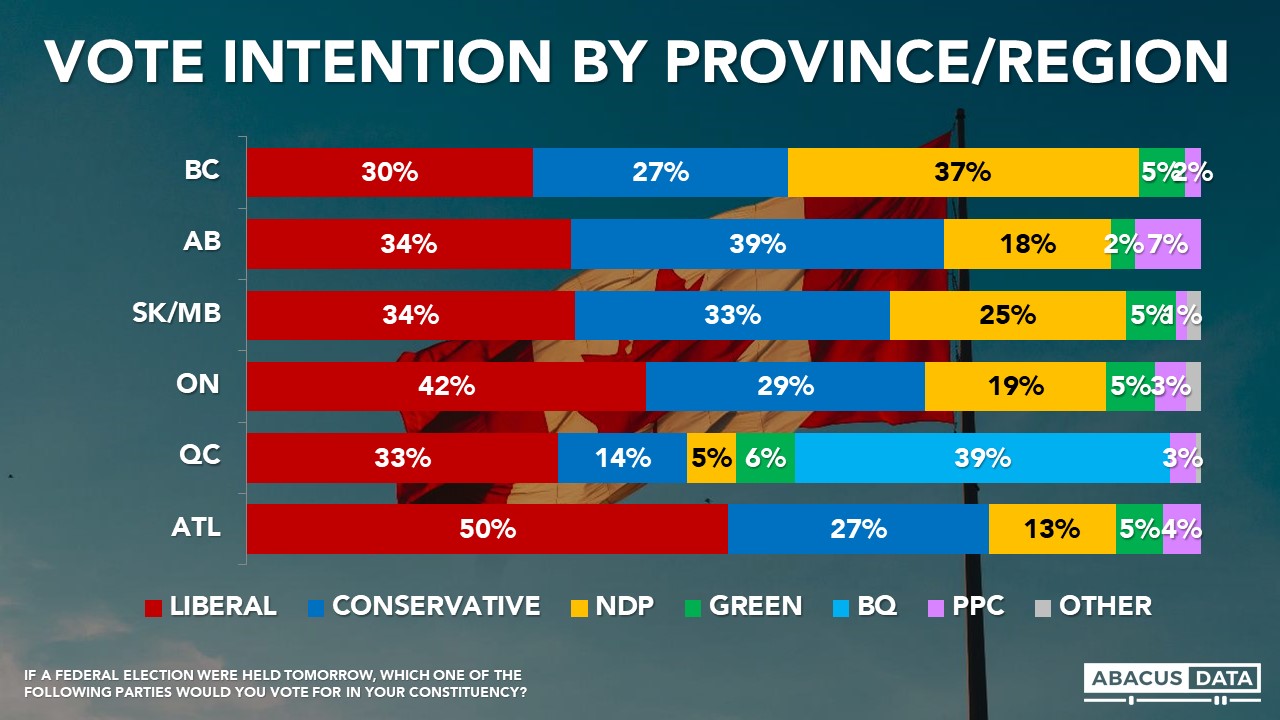
• In BC we see the NDP (37%) with a 7-point lead over the Liberals (30%) followed by the Conservatives (27%).
• In this wave we see the Conservatives with 39% in Alberta, compared to 34% for the Liberals and 18% for the NDP. The People’s Party claims a 7% share.
• In Saskatchewan/Manitoba we are seeing a close race between the Liberals (34%), the Conservatives (33%) and the NDP (25%).
• The Liberals have a 13-point lead in Ontario, with 42% compared to 29% for the Conservatives and 19% for the NDP.
• In Quebec the BQ (39%) are showing stronger than the Liberals (33%) with the Conservatives well back at 14% and the NDP (5%) and Green Party (6%) essentially tied.
• In Atlantic Canada, we find 50% support for the Liberals followed by the Conservatives at 27% and the NDP at 13%.
Worth noting is that the higher support levels for the Liberals in the Prairie provinces may be an anomaly and reflect smaller cell sizes, but we do also see a 6 point rise in federal approval in Alberta and a 9 point rise in Manitoba/Saskatchewan since the beginning of June.
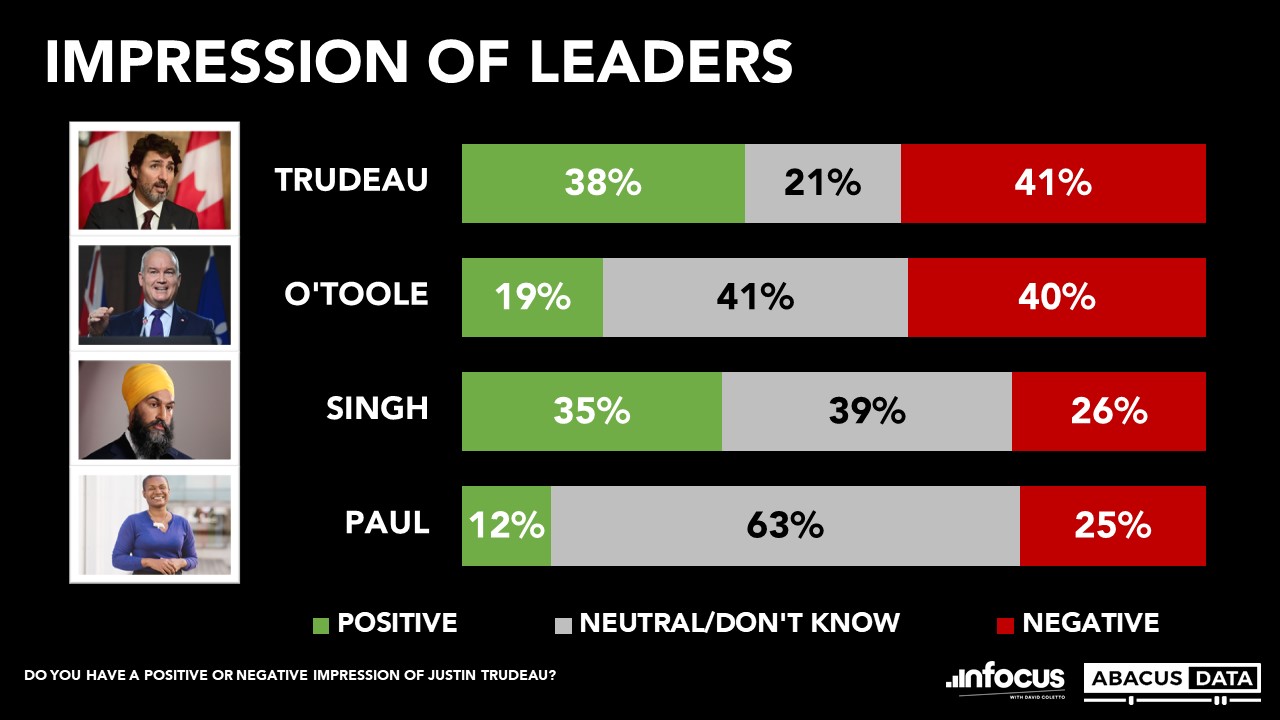
LEADER IMPRESSIONS
Justin Trudeau enjoys a positive impression among 38% and finds negative impressions among 41%, for a net score of -3.
Erin O’Toole enjoys a positive impression among 19% and finds negative impressions among 40%, for a net score of -21.
Jagmeet Singh enjoys a positive impression among 35% and finds negative impressions among 26% for a net score of +9.
Annamie Paul has seen her negatives increase over the past two weeks. 12% have a positive impression while 25% have a negative one for a net score of -13.
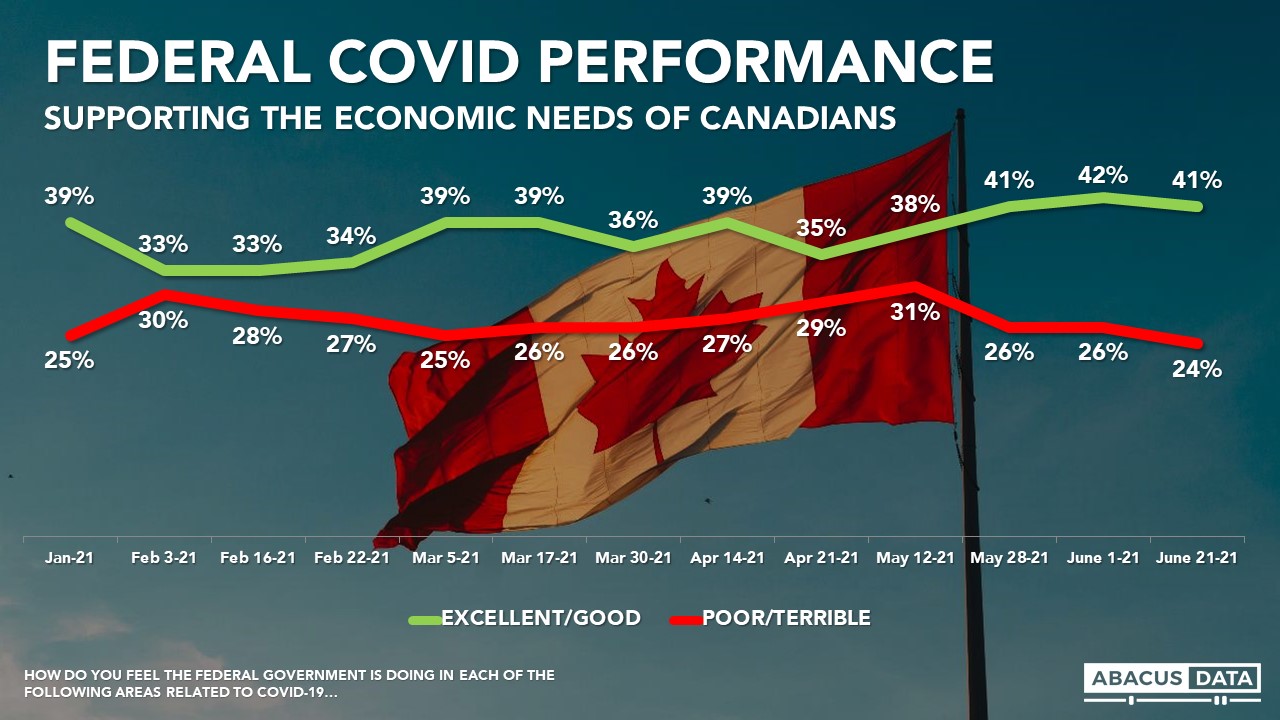
COVID PERFORMANCE
On three measures of federal performance related to the Covid19 pandemic, the federal government has seen generally improving numbers recently.
• On supporting the economic needs of Canadians 41% say Ottawa is doing an excellent or good job compared to 24% poor/terrible for a net +15.
• On finding the right balance between protecting health and the economy, 38% give good marks compared to 29% poor/terrible rating, for a net of +9, up substantially since a -6 net in April.
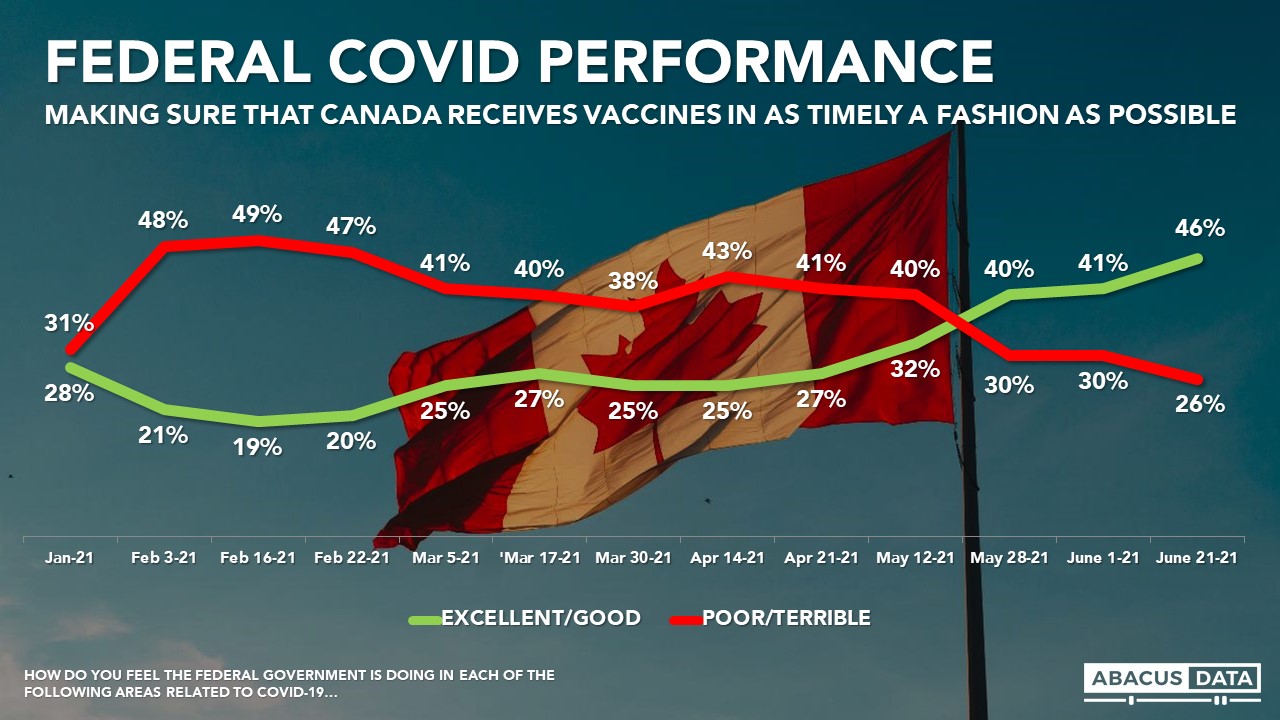
• But by far the biggest improvement has been on “making sure that Canada receives vaccines in as timely a fashion as possible, with 46% giving the government excellent/good ratings compared to 26% poor/terrible. In roughly a month, the government net score on that item has gone from -8 to +20.

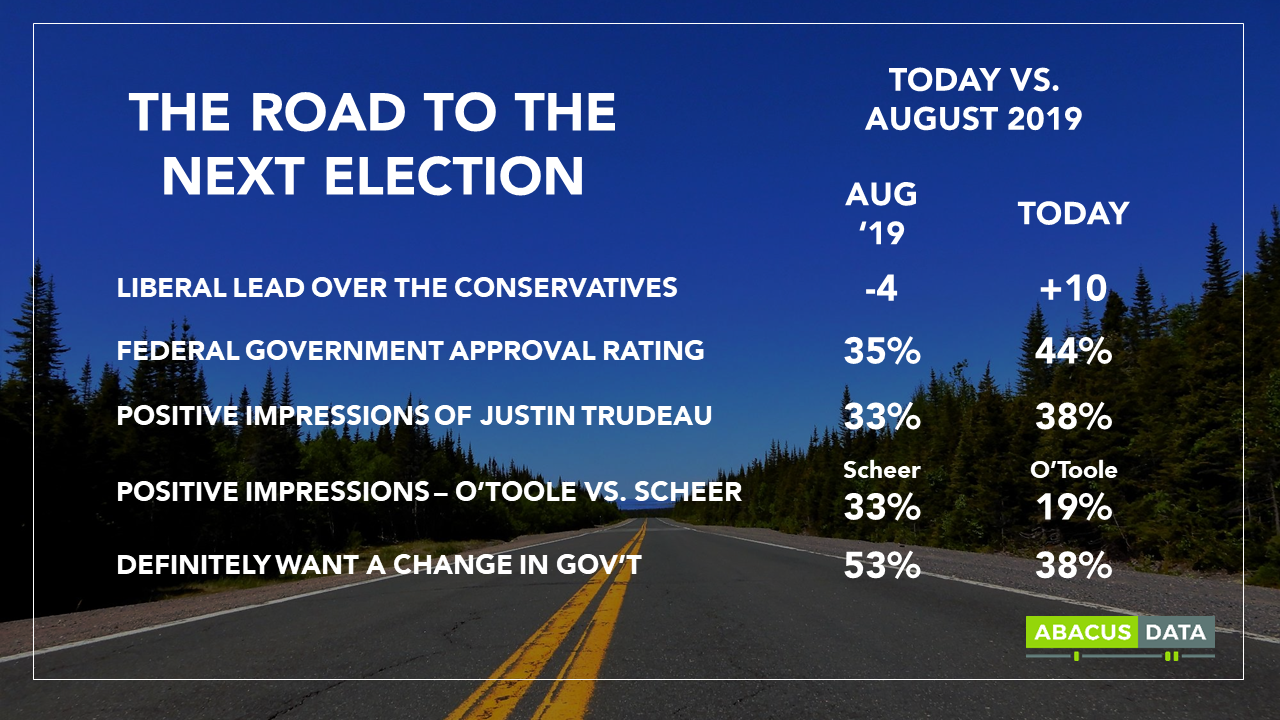
ELECTION SETTING: LIBERALS VERSUS CONSERVATIVES
As election speculation is heating up, we thought it would be useful to compare the situation between the two largest parties in the House today, with where things were before an election call in 2019.
The Liberals trailed by 4 heading into that election, compared to a 10-point lead today. Today’s approval rating for the Trudeau government is 9 points higher than it was in 2019. Impressions of PM Trudeau are 5 points better this year, while impressions of Mr. O’Toole are 14 points lower than they were for Mr. Scheer.
Finally, in August 2019, 53% of voters were determined to see a change in government, today that number is 38%.
A FEW OTHER THINGS WORTH HIGHLIGHTING
SPECTRUM BATTLES
Among self-described left of centre voters, the Liberals have 53% support followed by the NDP at 31% the Conservatives 5%, the Green Party 4% and the BQ 6%.
Among the self-described right of centre voters, the Conservatives have 67% of the vote, followed by the Liberals 14% the NDP 6%, the Peoples’ Party 7%.
Among the largest block of voters, who self-describe as on the centre of the spectrum, the Liberals lead with 36% followed by the Conservatives at 22%, the NDP at 14%, the BQ 15%.
VISIBLE MINORITY
Among those who self describe as visible minority, the Liberals (44%) have a 22-point lead over the Conservatives (22%), followed by the NDP (20%).
URBAN AND RURAL
Among those who live in urban areas the Liberals (38%) have a 15-point lead over the Conservatives (23%), followed by the NDP (20%). In suburban Canada the Liberals lead by 10-points (38%-28%-16%). In rural areas, the Conservatives and Liberals are tied at 33%.
VACCINES AND VOTING INTENTIONS
Among those who have been fully vaccinated the Liberals (42%) have a 13-point lead over the Conservatives (29%), followed by the NDP (16%). Among those who have had one shot the Liberals (39%) have a 16-point lead over the Conservatives (23%), followed by the NDP (22%).
Among those who have had no shots to this point in time, the Conservatives (31%) lead the Liberals (29%) and the NDP (13%) and Greens (9%).
LEADER IMPRESSIONS
Justin Trudeau’s net image (positive impression minus negative impression) in the three biggest seat provinces is +2 in BC, 0 in Ontario and -4 in Quebec. He is +82 among his own party supporters, -5 among NDP voters, and -69 among Conservative voters. Trudeau is -6 among voters under 30.
Jagmeet Singh’s net image in the three biggest seat provinces is +24 in BC, +11 in Ontario and -1 in Quebec. He is +77 among his own party supporters, +24 among Liberal voters, and -38 among Conservative voters. Singh is +36 among voters under 30, and +16 among women.
Erin O’Toole’s net image in the three biggest seat provinces is -20 in BC, -23 in Ontario and -23 in Quebec. He is +55 among his own party supporters, -61 among NDP voters, and -51 among Liberal voters. O’Toole is -23 among voters under 30. He is -13 in Alberta, -20 in Sask/Manitoba, and -27 among men. He is -20 in rural Canada and -23 in urban areas.
UPSHOT
According to Bruce Anderson: “As summer arrives and vaccinations continue to reach more and more people, the Liberals are seeing some wind in their sails. For the Conservatives, the data suggest a continuing struggle to find a message that is compelling or an issue that is galvanizing for them. Their support is softer in the Prairies and rivals on the right are making it more difficult for Mr. O’Toole to fashion a story of momentum, or to find a platform that is uniting western and eastern conservatives, and captivating for non-conservatives. The NDP continues to pose a challenge for the Liberals, especially among younger voters. But for the moment, anyway, progress in ending the pandemic is the focal point for most voters and this is working to ease frustrations with and grow support for the Liberals.”
According to David Coletto: “The Liberals have opened up their largest lead over the Conservatives in three months built on a higher approval rating for the government overall, improving impressions about its handling of the pandemic, and worsening impressions of Mr. O’Toole and the Conservatives. If an election does come this summer, the Liberals are in a much stronger position than they were prior to the start of the 2019 campaign.”
METHODOLOGY
The survey was conducted with 2,070 Canadian adults from June 18 to 21, 2021. A random sample of panelists were invited to complete the survey from a set of partner panels based on the Lucid exchange platform. These partners are typically double opt-in survey panels, blended to manage out potential skews in the data from a single source.
The margin of error for a comparable probability-based random sample of the same size is +/- 2.2%, 19 times out of 20.
The data were weighted according to census data to ensure that the sample matched Canada’s population according to age, gender, educational attainment, and region. Totals may not add up to 100 due to rounding.

ABOUT ABACUS DATA
We are the only research and strategy firm that helps organizations respond to the disruptive risks and opportunities in a world where demographics and technology are changing more quickly than ever.
Find out more about what we are doing to help clients respond to the COVID-19 pandemic.
We are an innovative, fast-growing public opinion and marketing research consultancy. We use the latest technology, sound science, and deep experience to generate top-flight research-based advice to our clients. We offer global research capacity with a strong focus on customer service, attention to detail and exceptional value.
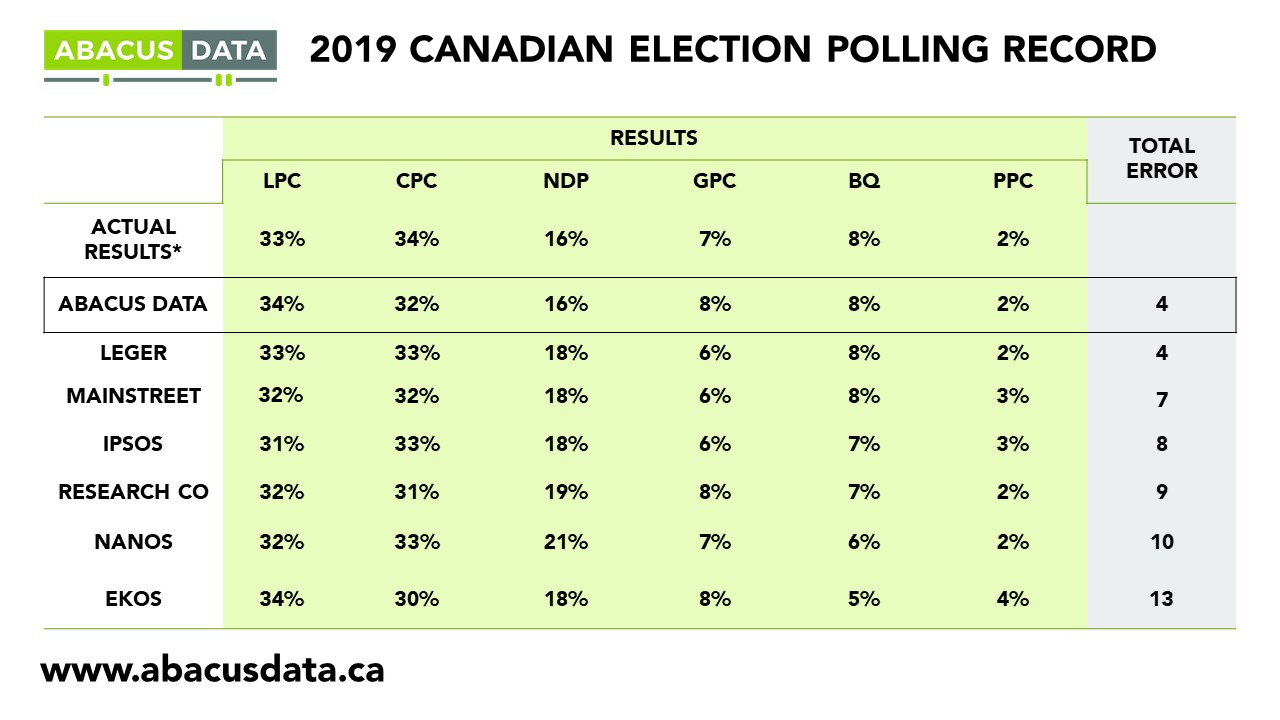
We were one of the most accurate pollsters conducting research during the 2019 Canadian Election.
Contact us with any questions.
Find out more about how we can help your organization by downloading our corporate profile and service offering.