Liberals slightly ahead as the Throne Speech looms
September 23, 2020
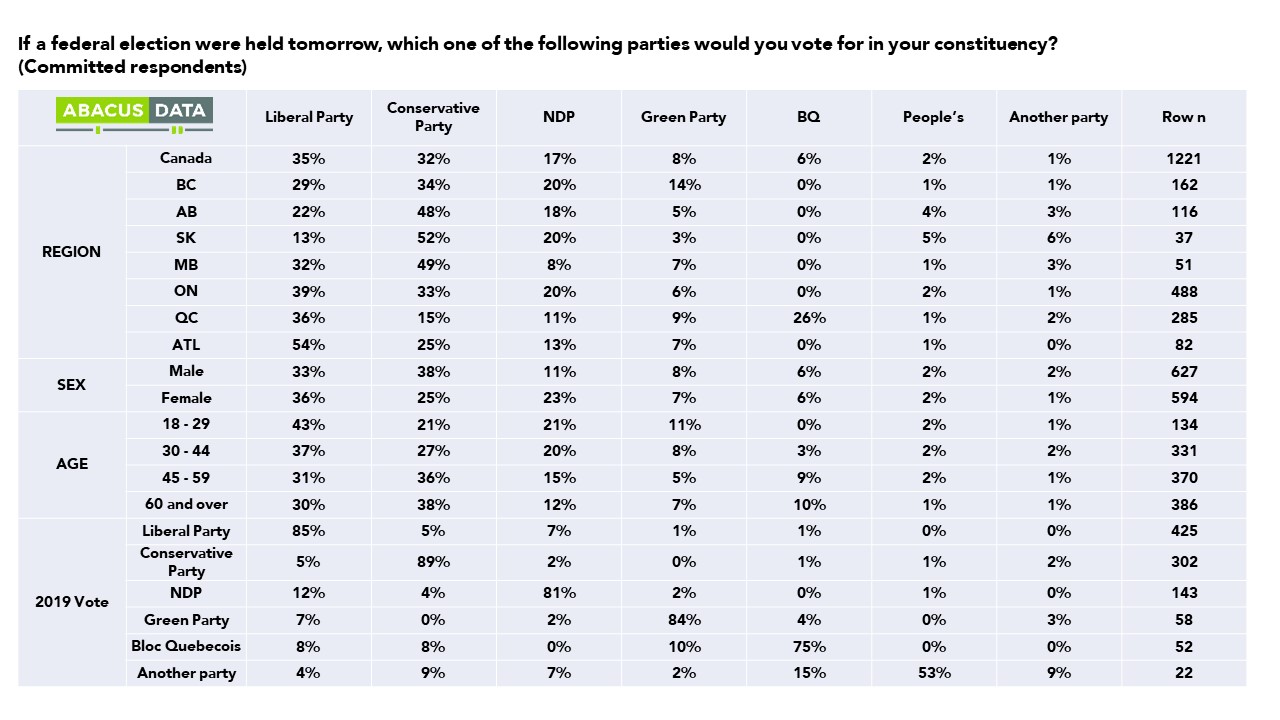
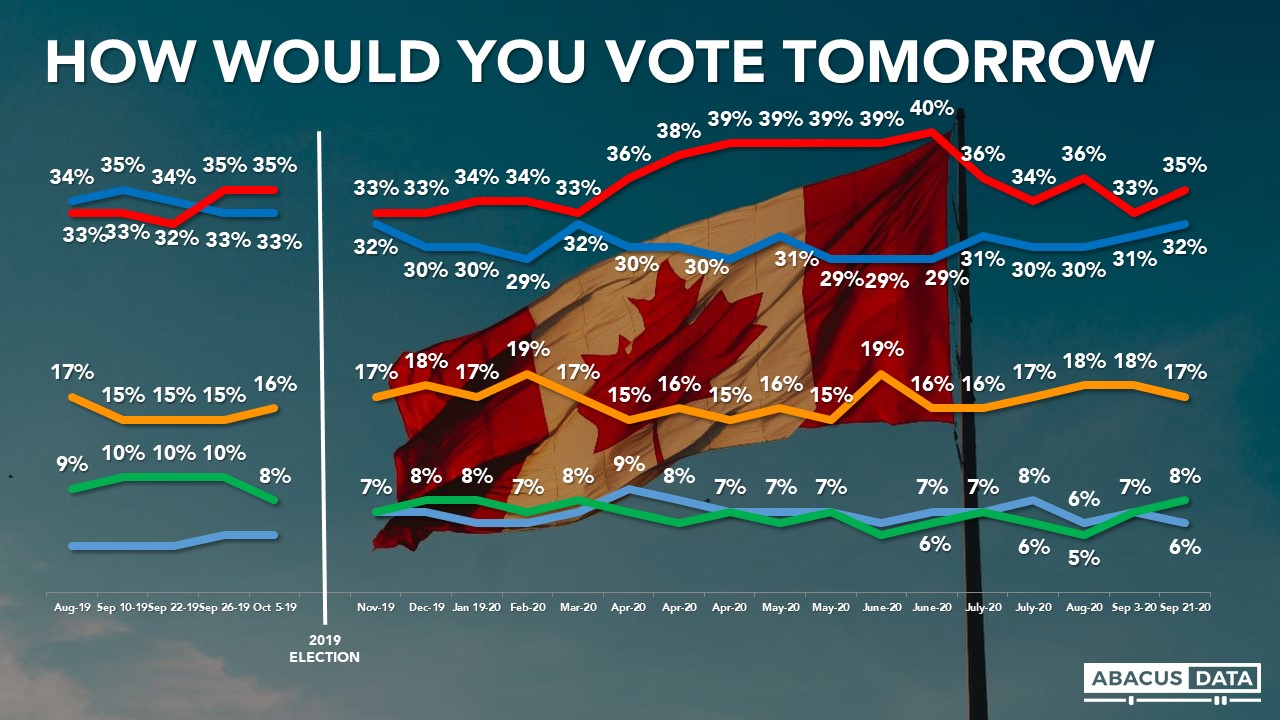
An election today would see the Liberals (35%) slightly ahead of the Conservatives (32%) nationally with the NDP back at 17%. Since early this month, the Liberals are up by two, the Conservatives one, and while the NDP is down one – changes all within the margin of error.
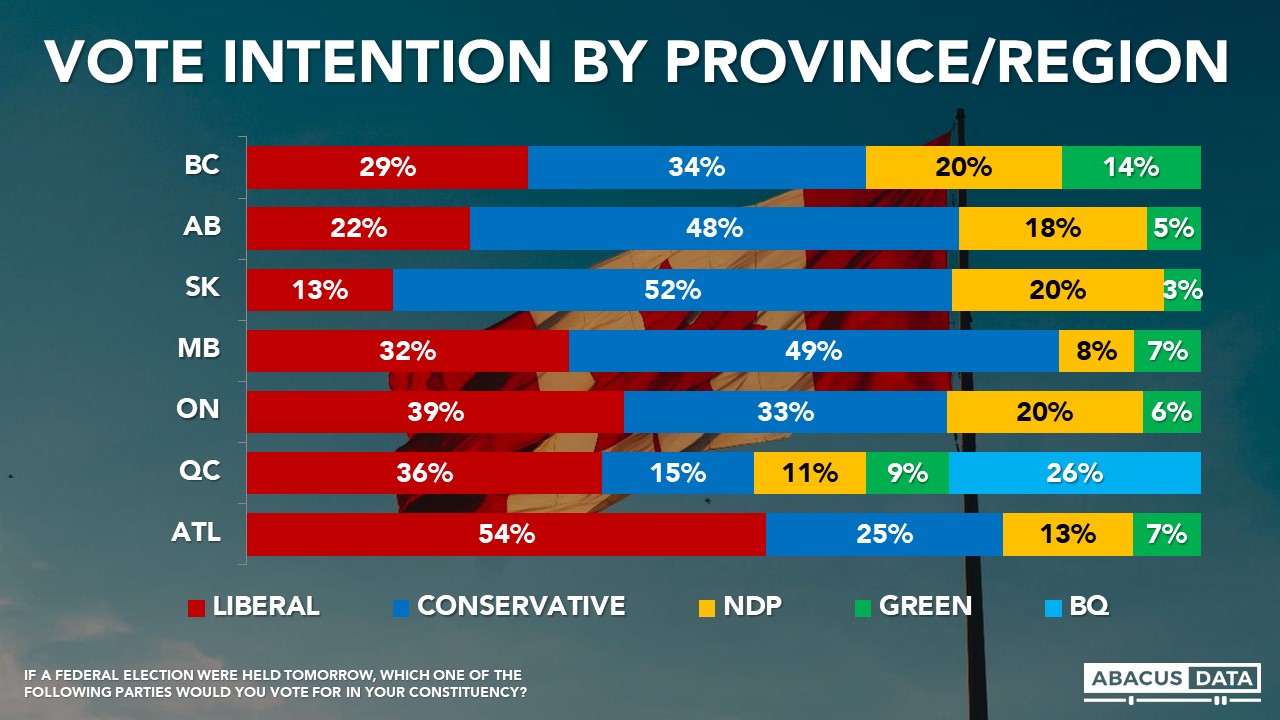
The regional patterns indicate the Liberals are in a strong position than the national number suggests. The Liberals lead the BQ by 10-points in Quebec (36% to 26%), lead the Conservatives by 6 in Ontario (39% to 33%) and have an almost 30-point lead in Atlantic Canada (54% to 25%). The Conservatives and Liberals are close in BC (34% to 29%) while the Conservatives dominate in the Prairies.
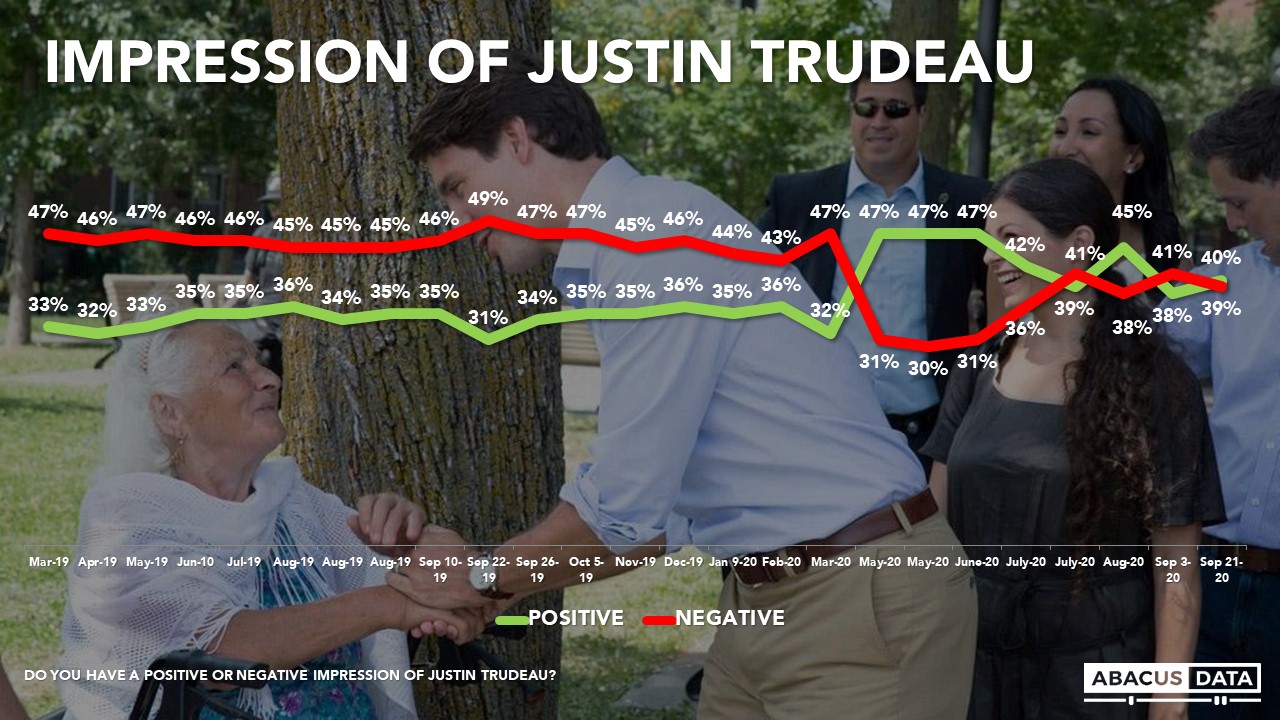
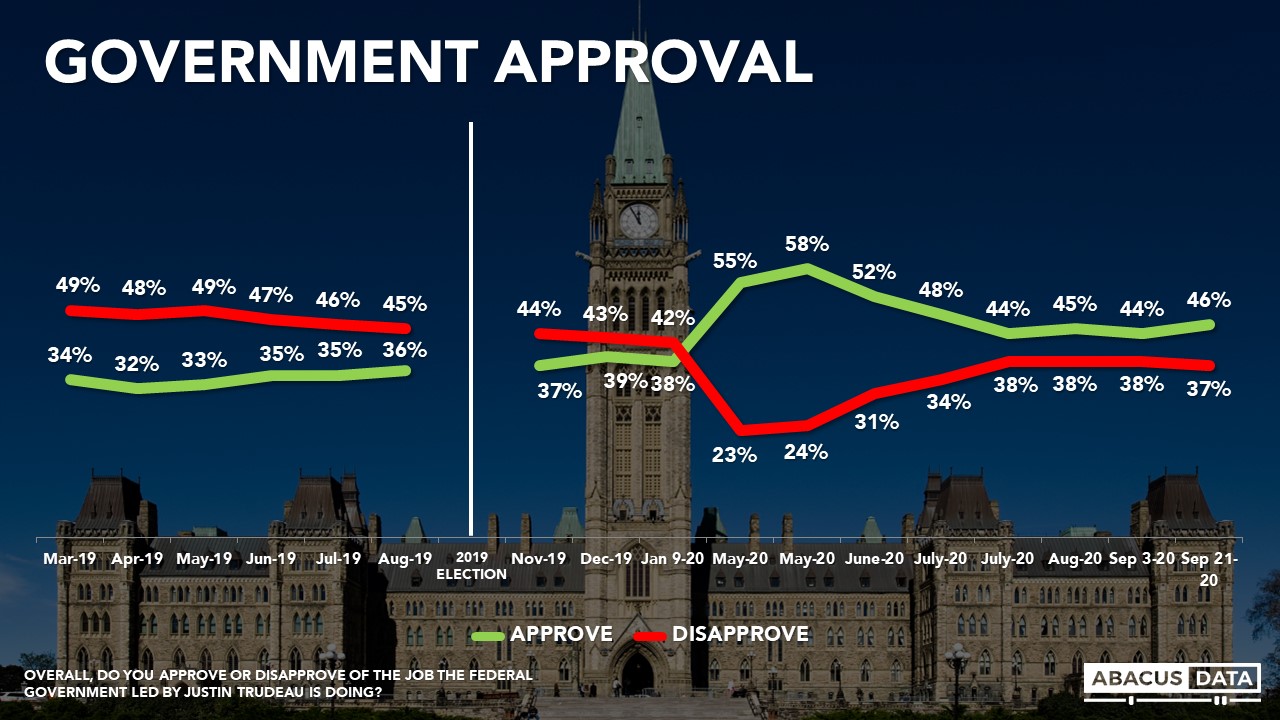
As he sets to outline the government’s agenda to a new session of Parliament, the Prime Minister’s image remains split with 40% having a positive view of him and 39% having a negative view. Although down from highs in May and June, the PM’s numbers are still stronger than they were before the pandemic began.
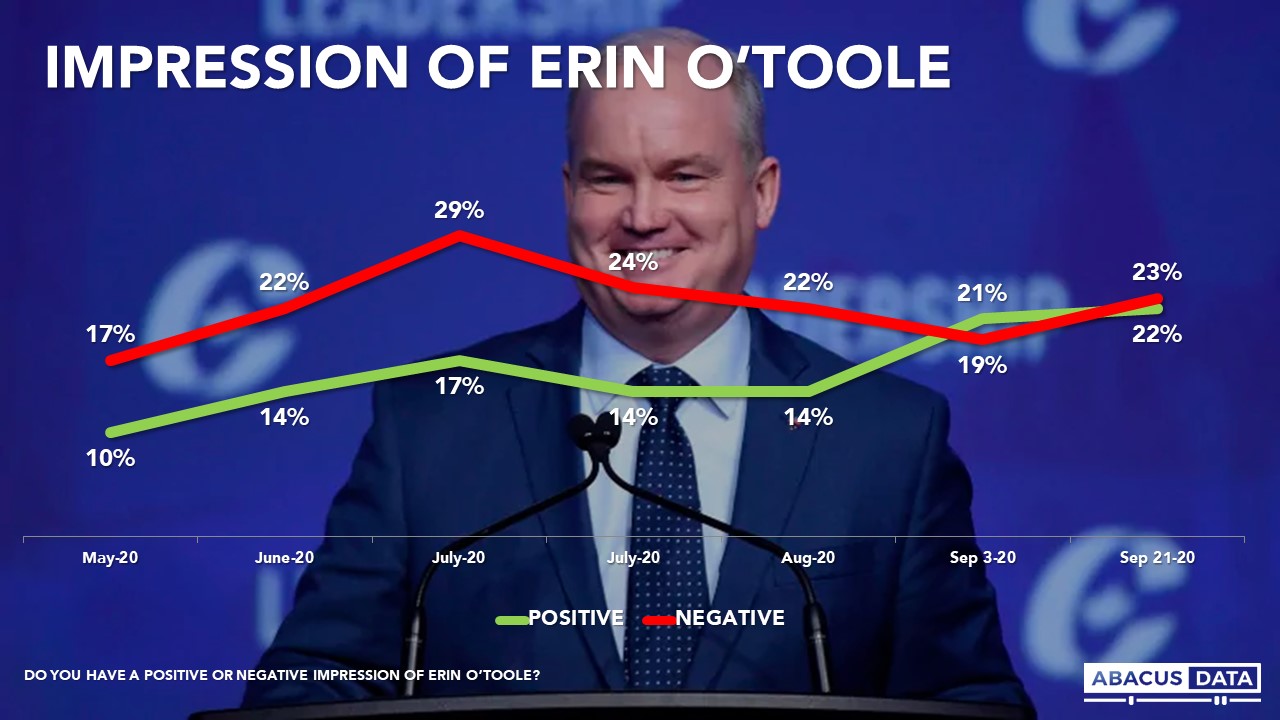
Impressions of Mr. O’Toole have become slightly more negative over the past few weeks. 23% have a negative view of the Conservative leader compared with 22% who have a positive view.
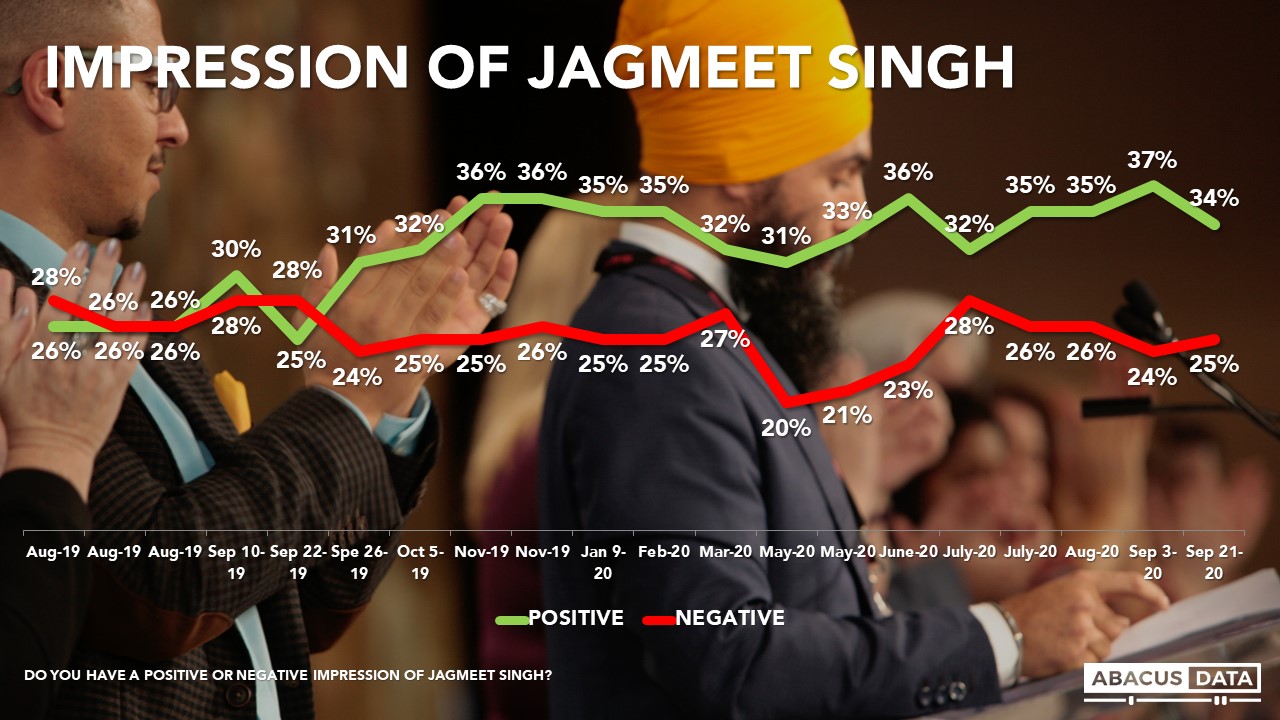
Mr. Singh’s numbers remain more positive with 34% having a positive impression (down 3 since early September) and 25% negative.
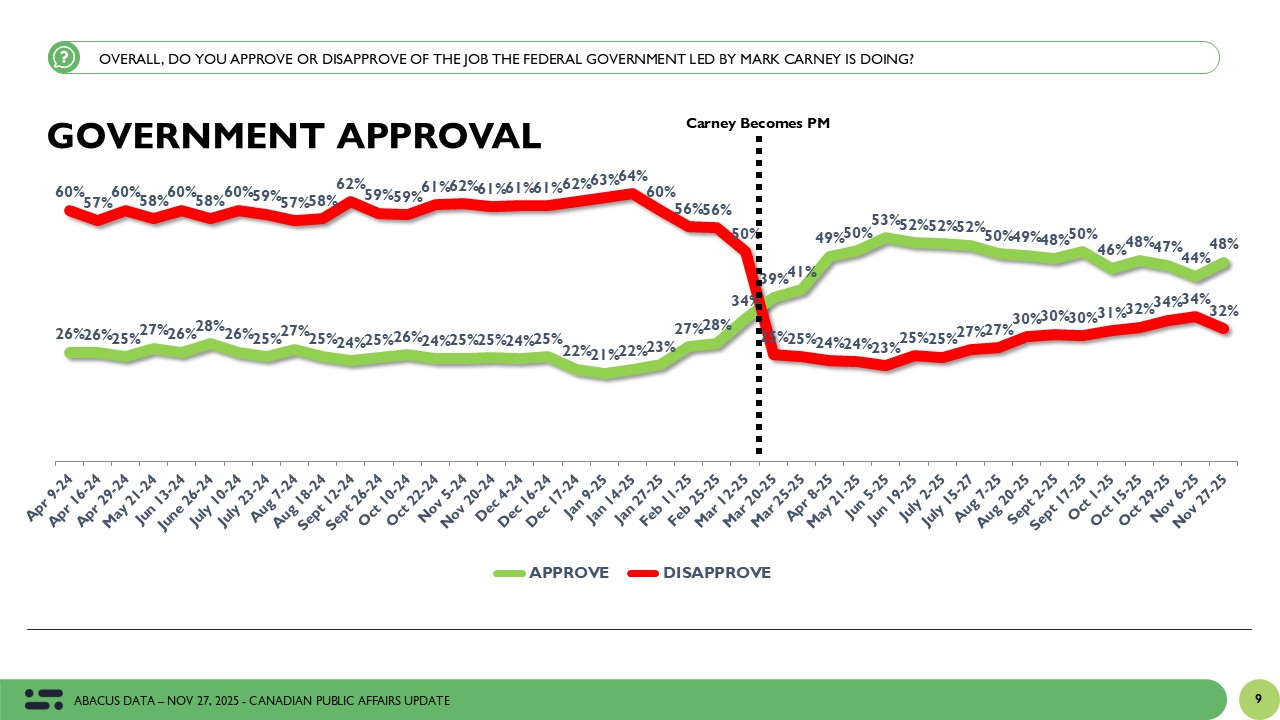
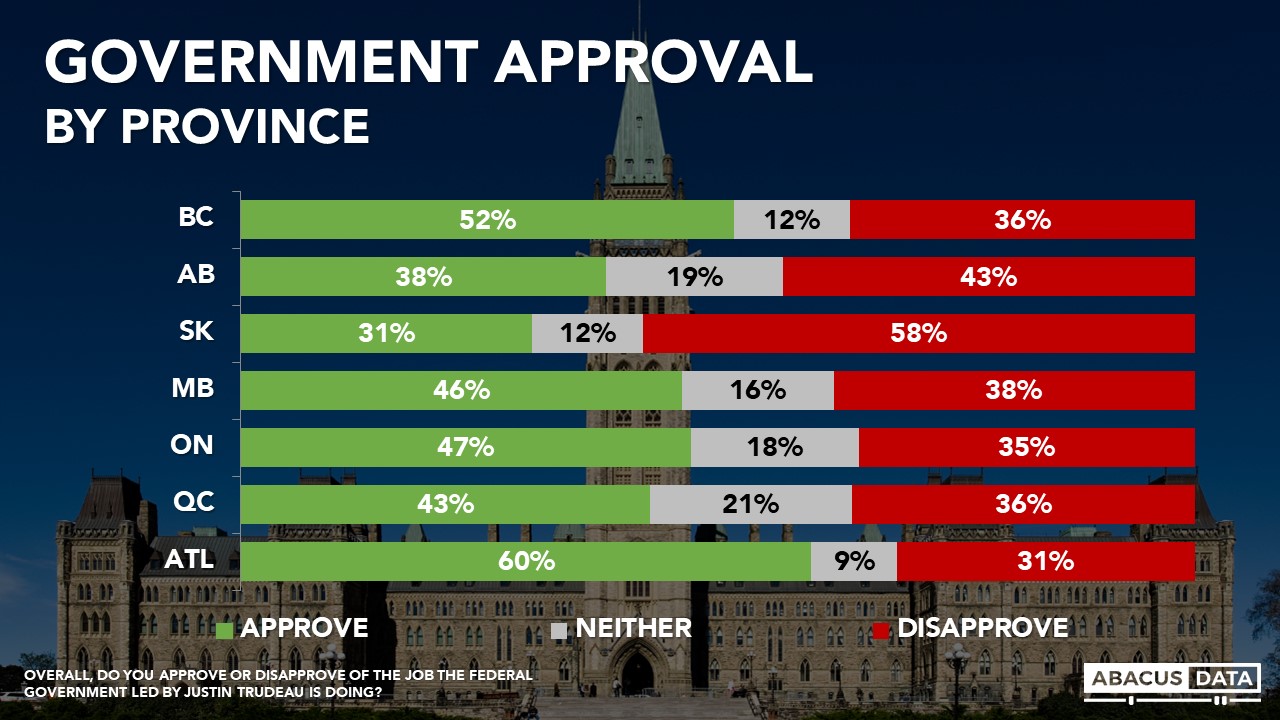
Approval of the federal government is steady and generally positive with 46% approving and 37% disapproving. Outside of Saskatchewan and Alberta, the federal government’s approval rating is at least 43% reaching 60% in Atlantic Canada, 52% in BC, and 47% in Ontario.
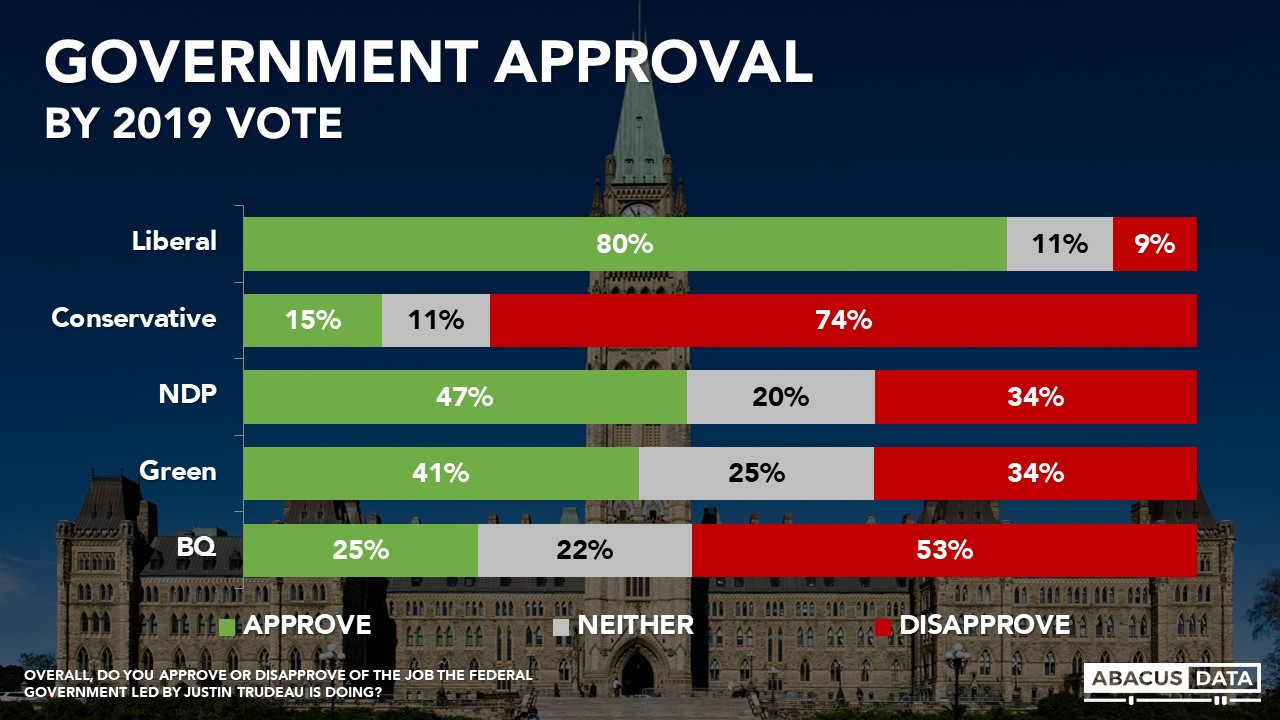
80% of people who voted Liberal last fall approve of how the government is doing, while 9% disapprove. Conservatives hold almost opposite views with 74% disapproving and 15% approving. Almost half of NDP voters approve (47%) while a third disapprove (34%). BQ voters are generally more disapproving of the government than approving (53% disapprove vs. 25% who approve).
The gap between the federal government’s approval rating (46%) and the Liberal vote share (35%) is something to watch carefully. It suggests the Liberal vote share has plenty of room to grow and maybe underperforming. For comparison, just prior to the start of the 2019 election campaign, the government’s approval rating was 36%. It ended up with 34% of the popular vote.
Among the 46% who approve of the job performance of the Liberal government, 56% would vote Liberal today. The other 44% split between preferring the NDP (14%), the Conservatives (8%), the Greens (6%), and the BQ (2%). 13% are currently undecided.
If that 13% who are undecided did vote Liberal, the party’s vote share would increase to 42% and the Liberals would have a 10-point lead over the Conservatives. That gap between approval and vote is something to monitor closely over the next few months.
UPSHOT
According to Bruce Anderson: “We are heading into a period of remarkable uncertainty – on any number of fronts – including the pandemic, the global economy, the US elections. The patterns of opinion provincially and federally tend to underscore that people are drawn towards stability over disruption in this period of time. Events that might in other circumstances carry more political charge seem to be ignored by many people, as the focus is on getting through a day, a week, a month at a time, and hoping for a solution to the pandemic before too many more months. These numbers are a reminder to government that people are looking for steady over flashy and to opposition parties that partisanship for its own sake carries a particularly bad odour today as voters struggle with everyday life.”
According to David Coletto: “The Canadian political landscape appears to have entered another period of stability, despite a high level of public uncertainty and anxiety. Despite Erin O’Toole’s win as Conservative leader and perhaps because of the on-going COVID-19 pandemic, public opinion has remained relatively stable for the past few months.
The Liberals and Conservatives are competitive in vote intentions, but the Liberal government has a solid and durable approval rating. The Prime Minister’s image remains more positive than it was before the pandemic started.
As the government outlines its new agenda for the next session of Parliament, it does so in a position of relative strength. It has healthy leads in Ontario and Quebec and is continued to be viewed positively by almost half the country. The pandemic and its economic and social impact have Canadians on edge but so far, many are satisfied with the federal government’s performance.”
ABOUT ABACUS DATA
We are the only research and strategy firm that helps organizations respond to the disruptive risks and opportunities in a world where demographics and technology are changing more quickly than ever.
Find out more about what we are doing to help clients respond to the COVID-19 pandemic.
We are an innovative, fast-growing public opinion and marketing research consultancy. We use the latest technology, sound science, and deep experience to generate top-flight research-based advice to our clients. We offer global research capacity with a strong focus on customer service, attention to detail and exceptional value.
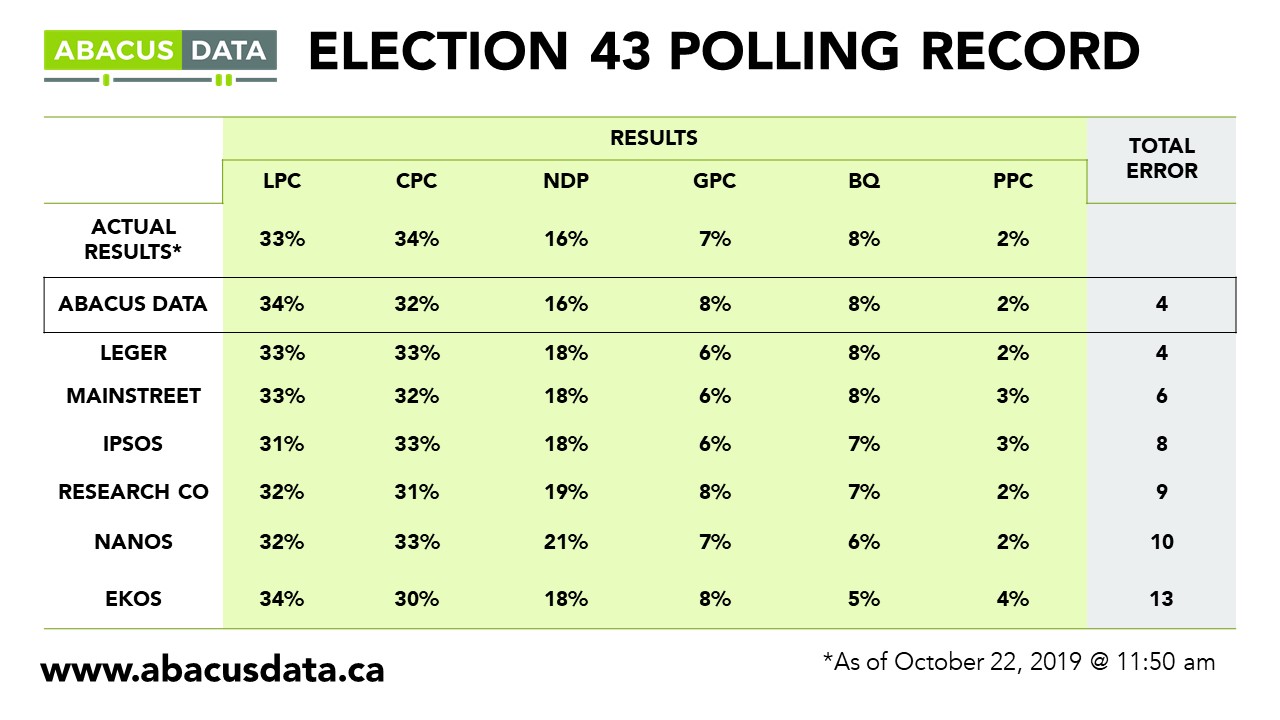
We were one of the most accurate pollsters conducting research during the 2019 Canadian Election.
Contact us with any questions.
Find out more about how we can help your organization by downloading our corporate profile and service offering.
METHODOLOGY
METHODOLOGY
The survey was conducted with 1,500 Canadian residents from September 18 to 21, 2020. A random sample of panelists were invited to complete the survey from a set of partner panels based on the Lucid exchange platform. These partners are typically double opt-in survey panels, blended to manage out potential skews in the data from a single source.
The margin of error for a comparable probability-based random sample of the same size is +/- 2.6%, 19 times out of 20.
The data were weighted according to census data to ensure that the sample matched Canada’s population according to age, gender, educational attainment, and region. Totals may not add up to 100 due to rounding.