She/Her/Hers: Women still saddled with traditional gender roles, even as they break through the glass ceiling
The Inaugural Syndicated Study of Women in Canada
At Abacus Data, we are committed to understanding how Canadian attitudes, behaviours, and perceptions vary across the demographic spectrum. Through our ongoing Canadian Millennials Study we’ve been able to help the general public, government, non-profits, and private companies understand how generational change and technological disruption are reshaping the Canadian public opinion landscape.
Following the findings of some of our latest research, we felt it was high time to bring this kind of rigour to explore how the lived experiences of Canadians, their behaviours, and attitudes are gendered. Today, we are proud to release some of the most fascinating insights from the inaugural fielding of our She/Her/Hers research practice, a biannual syndicated study of 2,000 Canadian women and 500 Canadian men.
The study explores a range of subject areas that inform what it’s like being a Canadian woman today – from home life, work life, finances, and consumer behaviour. Below are some of the study’s key findings. For more on the data please reach out to Oksana and for inquiries related to the purchase of the syndicated study please reach out to Yvonne.
Before we got into specifics, we asked respondents to sum up, in a word, what it’s like being a woman today. Their responses reflect a lot of the trends we see in the survey results.
The most common word to describe what it’s like being a woman today is ‘hard’. Women also feel ‘empowered’ and more ‘independent’, which reflects some of the major institutional hurdles overcome in the last several decades.

While there may be fewer systemic barriers for women to circumvent, there are still other challenges that persist. Workforce participation has soared amongst women over the past several decades and women now have more financial freedom to exercise purchasing power in the consumer space but social pressures, stereotypes, and stigma are still prevalent and prevent women from reaching true equity.
One of the key takeaways from the She/Her/Hers study is just how many of these stereotypes and historically ‘pink tasks’ Canadian women are still carrying with them, even as they break through the glass ceiling.
WOMEN AT HOME
Women are still largely responsible for work in the home such as cooking, cleaning, grocery shopping and parenting responsibilities. Over half of women who live with a partner say they are responsible for the majority of the cooking, cleaning, grocery shopping and (if they have kids) parenting responsibilities. This holds true even among women who are the primary income earners of their household.
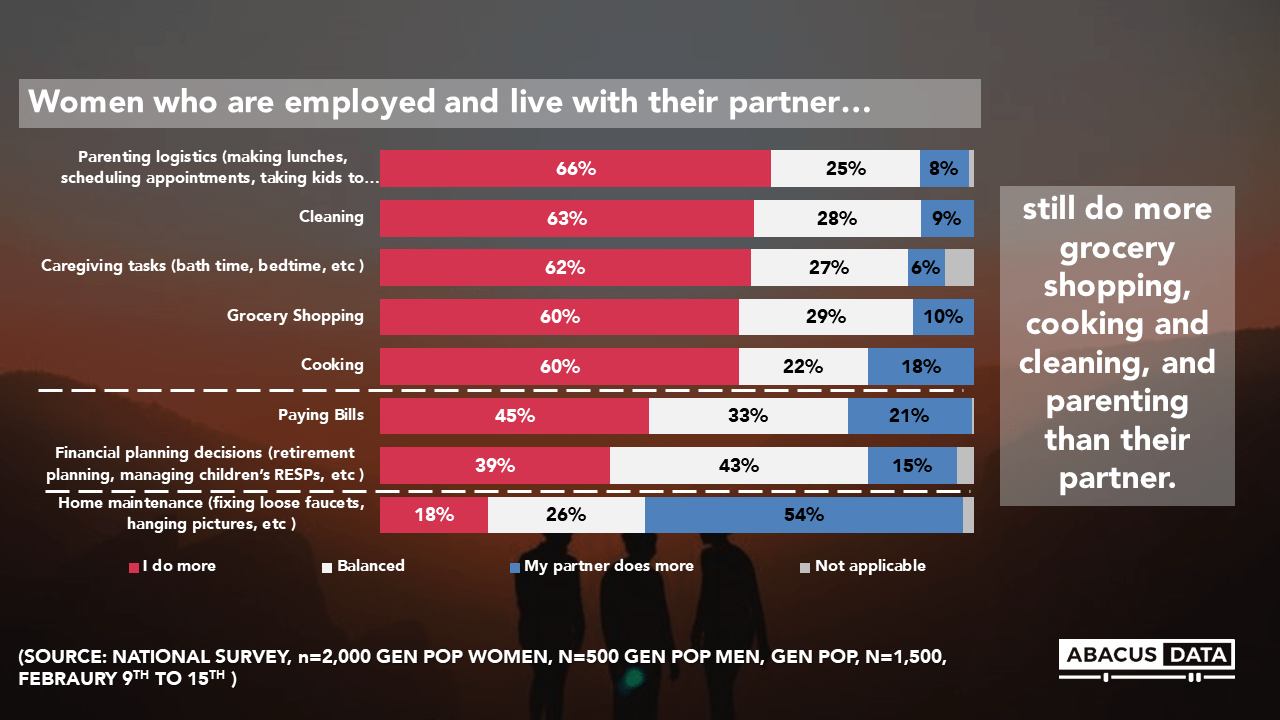
Women say tasks like paying bills and financial planning are more evenly split but home maintenance tasks are more likely to be the left for their partners.
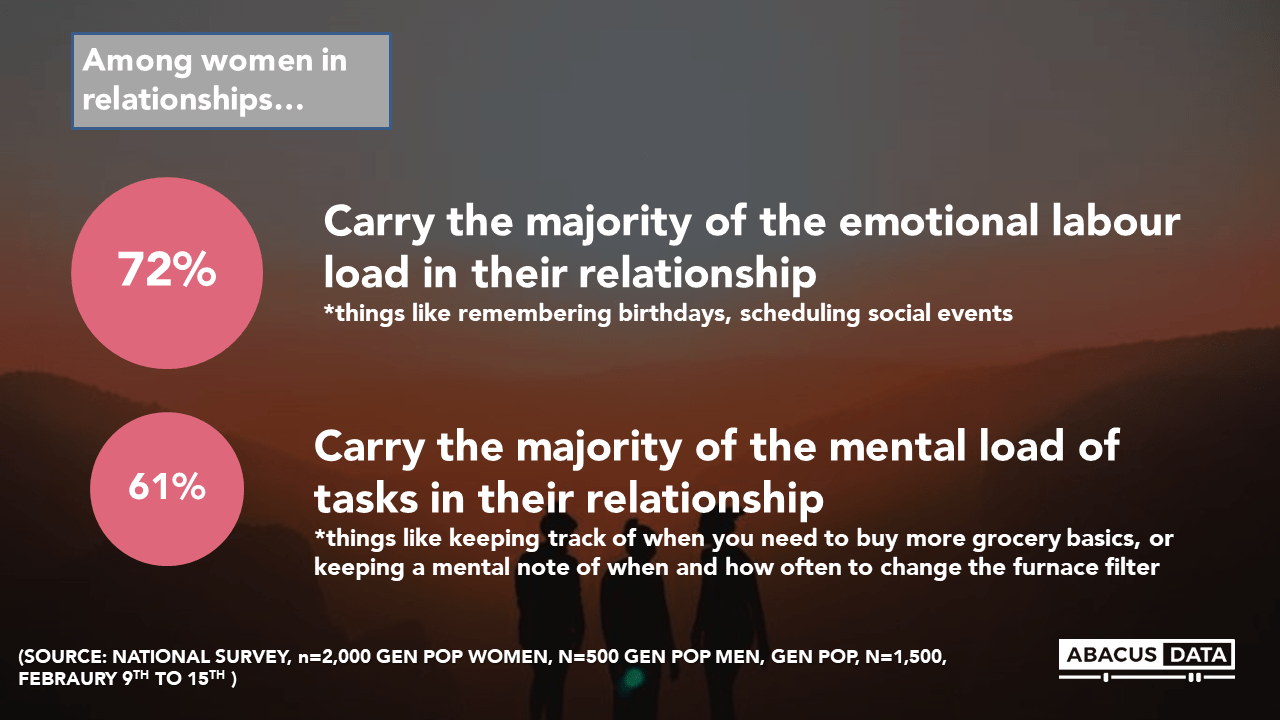
Women also report doing more emotional labour in the household. 72% of women say they are the default partner responsible for remembering birthdays and maintaining a healthy social calendar in their relationship. 61% carry the majority of the mental load of tasks (meaning while their partner may grocery shop or take care of home maintenance, they are responsible for knowing when and what needs to be done for these tasks).
WOMEN IN THE WORKPLACE
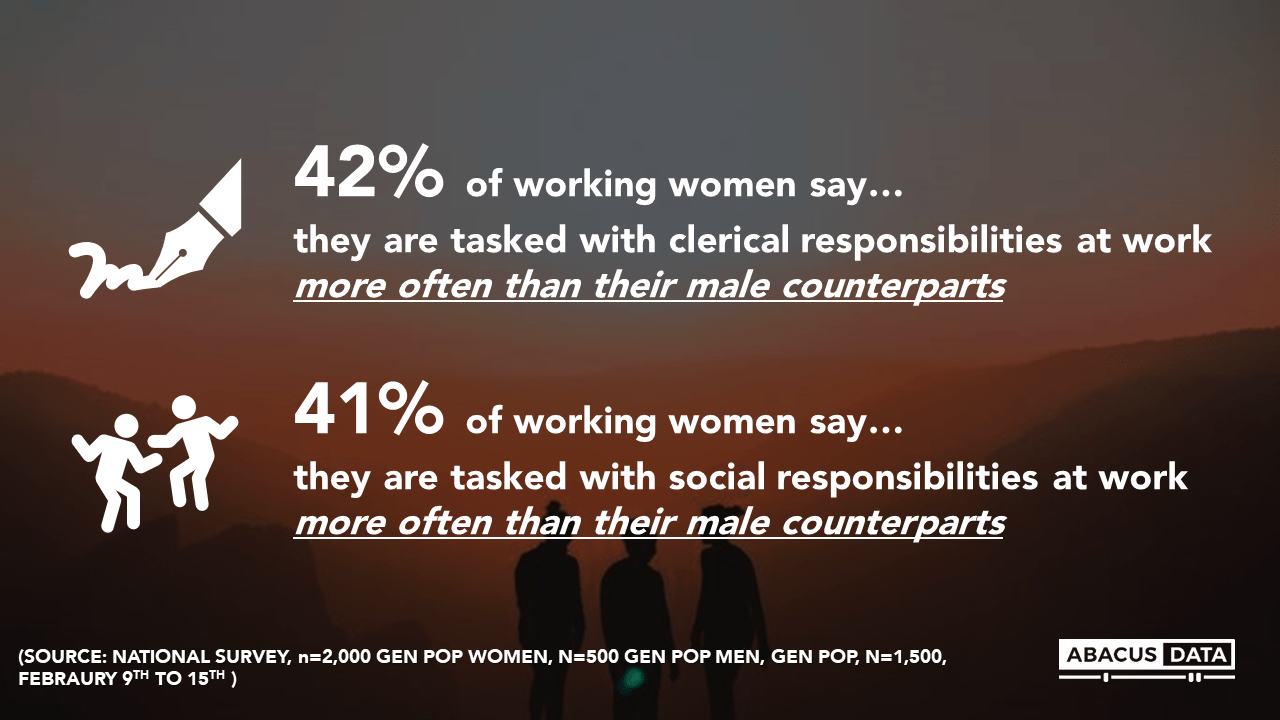
Given the uneven distribution of emotional labour in a domestic setting, it is no surprise that these responsibilities in the workplace also tend to fall to women. 42% of women say they are asked to take on social tasks like birthday cards and planning social events more frequently than their male counterparts. 41% of women say they are asked to take notes in a meeting more frequently than their male counterparts.
Taking on the burden of these tasks means women have less time and are given less support to take on responsibilities that might help them climb the corporate ladder. Increased workforce participation has been an important step towards achieving gender equity in recent years but the nature of and compensation for that participation still remains unequal.
WOMEN AND FINANCES
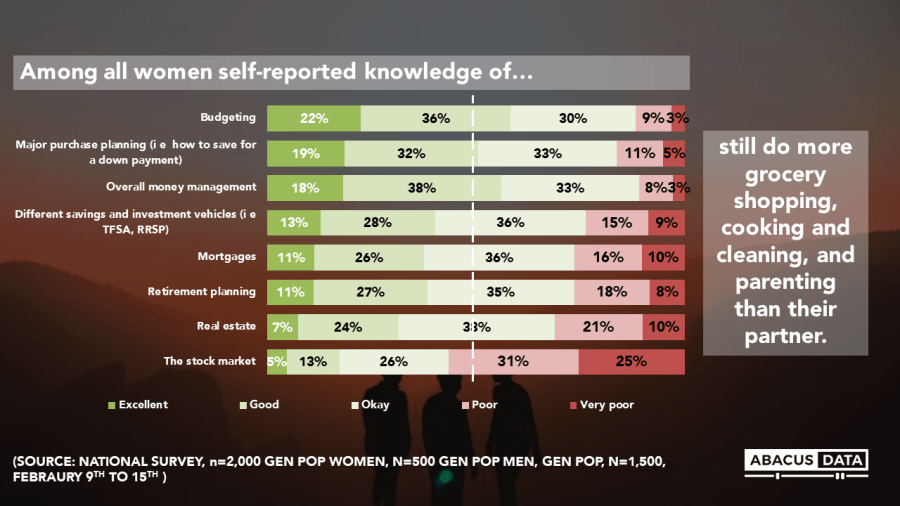
Amongst women in relationships, financial planning is increasingly a shared responsibility among partners. That being said, our findings indicate there is still room for improvement on women’s self-reported financial literacy across several key investment vehicles including the stock market, real estate, and retirement planning. Only 28% of women say they are very comfortable with money management – 8 points lower than men.
Women can access financial tools like credits cards (albeit not until 1974), and savings vehicles just the same as men, but feel much less confident in their knowledge of these financial tools. Women are much less knowledgeable (self-reported) than men on many key components of building wealth and financial stability.
Women are equally as likely as men to have a financial advisor, but still turn to their partner for a large portion of their financial advice. Additionally, 29% of women say a lot of the products they are interested in seem to ignore women. By 2024, it is expected that 50% of the privately held wealth in Canada will be that of women. Canadian women are waiting for businesses and financial services institutions to take this reality seriously.
THE UPSHOT
According to Oksana
 In our inaugural She/Her/Hers study we collected a wide range of data on many topics, but one trend stood out for me throughout. Women are being given more opportunities, responsibilities and power, but are still being disproportionately saddled with domestic and emotional labour. Greater participation in the workforce is a good thing, but if women are still carrying the bulk of the cooking and cleaning, have we really reached equality? We know that women can be equal players in all spaces (the boardroom, the home, the voting booth, the store…), so it’s time that women be invited to contribute, or better yet take the lead, instead of inviting women in just to sit in the corner and take notes.
According to Yvonne
 I was eager to explore the gendered dynamics of Canadian life because many of my personal experiences seeking financial services, car shopping, and getting medical advice felt unequal. Our first She/Her/Hers study has clearly demonstrated that I’m not alone and many women feel ill-served by advertisers, excluded from pathways to improved financial literacy, and discriminated against at the mechanic. I look forward to digging deeper into these findings in the weeks to come and taking an intersectional lens to the data to explore how women of different age, race, income, and political stripe experience life at home, at work, at the bank, and more.
METHODOLOGY
The survey was conducted with 2,500 Canadian adults (2,000 Canadian women and 500 Canadian men) from February 9 to 16, 2023. A random sample of panelists were invited to complete the survey from a set of partner panels based on the Lucid exchange platform. These partners are typically double opt-in survey panels, blended to manage out potential skews in the data from a single source.
The margin of error for a comparable probability-based random sample of the same size is +/- 1.96%, 19 times out of 20.
The data were weighted according to census data to ensure that the sample matched Ontario’s population according to age, gender, and region. Totals may not add up to 100 due to rounding.
This data represents just a fraction of our findings from the inaugural She/Her/Hers study, which encompasses a wide range of topics like women at home, women in the workplace, women and finances, women as consumers and women’s health. If you are interested in purchasing the full study or a specific section thereof, please contact our Vice President, Sales and Marketing, Yvonne Langen.
For media inquiries please contact the lead researcher on the She/Her/Hers Study, Director of Strategy and Insights, Oksana Kishchuk.
ABOUT ABACUS DATA
We are the only research and strategy firm that helps organizations respond to the disruptive risks and opportunities in a world where demographics and technology are changing more quickly than ever.
We are an innovative, fast-growing public opinion and marketing research consultancy. We use the latest technology, sound science, and deep experience to generate top-flight research-based advice to our clients. We offer global research capacity with a strong focus on customer service, attention to detail, and exceptional value.
We were one of the most accurate pollsters conducting research during the 2021 Canadian election following up on our outstanding record in 2019.
Contact us with any questions.
Find out more about how we can help your organization by downloading our corporate profile and service offering.