CIVIX Student Budget Consultation 2015 Results

High school students to Finance Minister Oliver: Balance the budget and increase spending on education, the environment, and healthcare

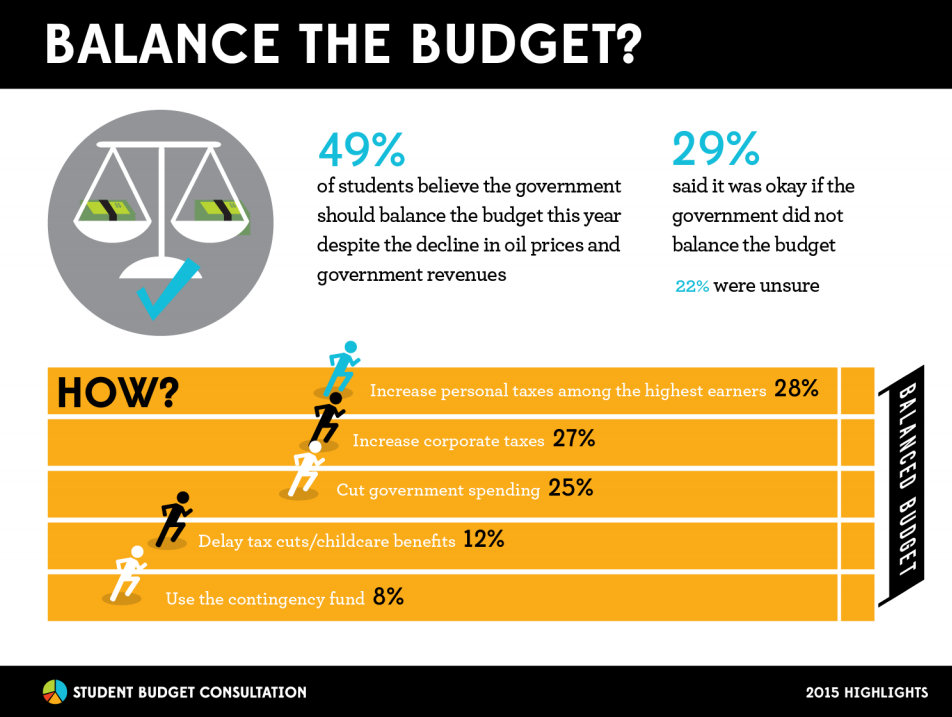
Despite the decline in oil prices and government revenues, 49% of high schools students believe that the federal government should do everything it can to make sure the budget is balanced this year.

balance the budget

For the third year in a row, high school students from across Canada participated in the Student Budget Consultation, a national initiative aimed at engaging youth in the federal government budget process.

Six thousand high school students took part in the 2015 Student Budget Consultation from more than 300 classrooms throughout Canada, representing every province and territory.

Other findings include:

– A balanced budget remains important – When asked how they would spend a budget surplus, students allocated a larger percentage of the surplus towards paying down the federal debt (12.9%) than any other option; purchasing new equipment for the Canadian forces (8.6%) and increasing health care transfers to the provinces (7.8%) were also top selections.

– Increase spending for education, the environment and healthcare – A majority of high school students think the government should spend more on education-related social transfers, protecting the environment and transfers to the provinces for health care. With respect to spending reductions, prisons/increased sentences (29%) and arts and culture (28%) were selected most.

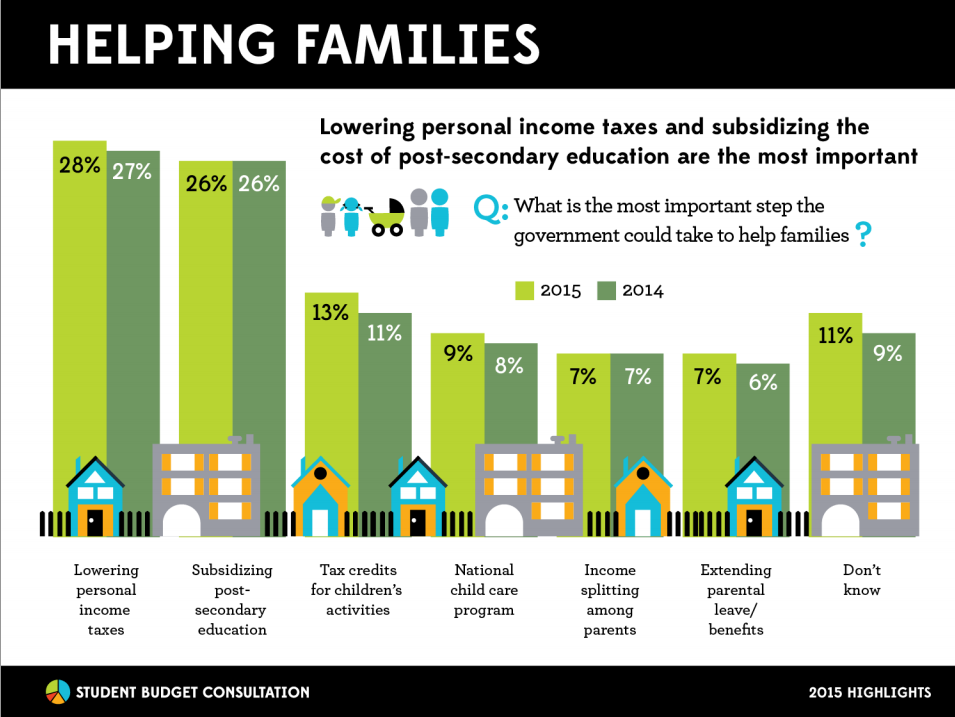
– Lowering personal taxes and education funding most effective approaches to helping families – When asked what would be most helpful for families, students prioritized lowering personal income taxes (28%) and subsidizing post-secondary education (26%). Implementing a national daycare program (9%) and income splitting (7%) received significantly less support.

– Reducing tuition seen as the most important strategy to increase youth employment – Approximately 20% of those surveyed said the cost of education was the biggest hurdle facing them in starting their careers, closely followed by career uncertainty (19%).

– National to scholarship program chosen as best way to mark Canada’s 150th anniversary – A plurality of young Canadians want the Government to mark its 150th anniversary by establishing a new national scholarship program.

helpingfam

To view an infographic of the results highlights, click here.

To view the full results summary, click here.

National Survey of Canadians 18 and over

The results of a corresponding survey of 1,000 Canadians aged 18 and over conducted by polling firm Abacus Data finds that high school students and Canadians 18+ share many of the same priorities and attitudes when it comes to the budget. However, there are also some notable differences between the two groups.

High school students are more likely to prioritize education spending, tuition fee reductions and public debt reduction, while Canadians 18+ are more likely to prioritize healthcare spending, tax reductions, and economic growth.

– While a majority of high school students and Canadians 18+ want the federal government to spend more on healthcare transfers, students were more likely to want to see increased federal spending on education related social transfers, reducing crime through crime prevention programs and protecting the environment. Canadians 18+ wanted to see increased spending on tax credits and/or benefits.

– When asked what was most important to them in thinking about the kind of Canada they want to see 15 years from now, high school students were more likely to rank investments in education and research, and debt reduction as the most important outcomes – while Canadians 18+ were more likely to rank improving health care and strong growth in the Canadian economy as most important.

– When asked to identify what the most important step the government could take to help families, about three in ten students and Canadians 18+ prioritized personal income tax reductions. Students were more likely to select subsidizing tuition while Canadians 18+ were more likely to prioritize family income splitting and a national childcare program.

To view the full results comparison summary (high school students vs Canadians 18+), click here.

About the Student Budget Consultation

The Student Budget Consultation is a civic education and financial literacy program that gives young Canadians an opportunity to learn about government and public policy, debate varying viewpoints and offer their opinion on the priorities of the upcoming federal budget.

The program culminated with a consultation survey, held online and through paper-based questionnaires.

The 2015 survey was conducted in partnership with Abacus Data between December 2014 and April 2015. The results were shared with the Department of Finance earlier this month.

About the Organization

CIVIX is Canada’s leading civic education organization working to build the capacity and commitment of young Canadians to participate in our democracy. CIVIX offers resources and innovative approaches to make it easy and effective for educators to teach democracy and citizen engagement.

Student Vote, the flagship program of CIVIX, is a parallel election for students under the voting age coinciding with official elections. In the 2011 federal election, more than 563,000 students cast a Student Vote ballot from nearly 3,800 schools throughout Canada.

The 2015 Student Budget Consultation was coordinated with the support of the Government of Canada, Interac and the Canadian Association of Former Parliamentarians.

For further information:

For comment or to be directed to students who participated in the survey, contact Taylor Gunn, President of CIVIX at hello@civix.ca or 1 866 488 8775.

Millennials don’t think they are doomed

New poll finds they’re not nearly as pessimistic as often assumed

You’ve probably heard the dispiriting prediction: This is supposed to be the first generation of Canadians who won’t do as well as their parents. Saddled with the debt of the big spenders who came before them, stuck in a “new normal” era of slower economic growth, the Millennials are often said to face bleak prospects.

But a new poll by the Ottawa-based firm Abacus Data, commissioned by the blue-chip Canadian Council of Chief Executives, has found that young Canadians just don’t believe they have it so bad. In fact, most look forward to experiencing lives equally or more prosperous and happy than their elders.

Asked how they expect to fare compared with their parents’ generation, most Canadians aged 18 to 35 surveyed by Abacus were upbeat. Less than one-quarter of them said they believe their age cohort will fail to live up to their parents’ overall level of happiness or standard of living. Nearly half, 46 per cent, expect their own generation’s standard of living to rise above that of their mothers and fathers, while about a third, 32 per cent, anticipate roughly matching their parents’ living standards.

Abacus chief executive officer David Coletto, who oversaw the poll—and is himself only 33—said the remaining roughly one-quarter of young Canadians who expect to fall short of their parents is still significant, “but nowhere near what we’ve heard about this generation being overly pessimistic.”

Keep reading…http://www.macleans.ca/society/life/millennials-dont-think-theyre-doomed/

Life, Work, and the Emerging Workforce Study

Young Canadians are more optimistic than pessimistic about the job market

Most think their generation will live as well or better than their parents’ generation

Young Canadians are significantly more optimistic than pessimistic about the job market and, by a two-to-one margin, believe their generation will enjoy a standard of living higher than that of their parents, according to a new Abacus Data survey of Canadians aged 18 to 35.

Close to half (45%) of young Canadians say they are optimistic about the job market for people such as themselves, compared with 20% who are pessimistic.  However, opinions on the job market itself are mixed.  Asked to describe employment opportunities for people like them who may be looking for work in the area where they live, 48% said they were excellent or good, while 51% said the situation is poor or very poor.  Those living in the Prairies and Quebec were more positive about the job market than those in BC, Ontario or Atlantic Canada.

Respondents aged 18 to 24 were somewhat more optimistic about the job market than those aged 25 to 35. Among those currently pursuing post-secondary education, respondents studying in information technology, health, business and engineering/science fields were more optimistic than those in arts or social science programs or the trades.

The Canadian Council of Chief Executives commissioned the study in advance of a national conference next week in Ottawa on education and skills.  The conference – Creating Opportunities: Jobs and Skills for the 21st Century – will bring together 200 business leaders, educators, senior government officials and recent graduates to explore ways of equipping more young people to find meaningful and rewarding careers.

“Clearly it is not all doom and gloom for Canadian millennials as some would suggest,” said David Coletto, CEO of Abacus Data and the lead researcher on the study.

“Most young Canadians don’t see themselves as ‘Generation Screwed’ or ‘Generation Jobless’.  Most are quite optimistic and happy with their lives. They have established themselves – or are working toward –a career they like and are achieving the goals they set for themselves. Others have not been so fortunate and feel pessimistic, let down, and unsatisfied with the opportunities available to them.”

Will their generation live better than their parents’ generation?

Despite their mixed feelings about the job market, less than a quarter of young Canadians believe their generation will rank below their parents’ generation in overall happiness (22%) or standard of living (23%).  In fact, 46% of those surveyed felt their generation’s standard of living would be better than their parents’ generation, while 32% believed it would be about the same.

But the survey did find that a majority of young Canadians (59%) agree they will have to delay major life events like marriage, buying a home, and having children because of financial pressures.

“The combination of more people pursing post-secondary education, rising tuition and housing costs, and an insecure and precarious job market means that many young Canadians are entering adulthood much later than previous generations,” said Coletto.

A quarter of respondents aged 25 and older said they still live with their parents and only half reported having found a full-time job in their field.

“Young Canadians are facing a challenging job market and most are delaying major life milestones because of financial pressures, but this has not impacted their long-term optimism.  Only a small minority think their generation will be worse off than their parents’ generation and most think their generation is better off when it comes to their ability to pursue their passions and live life the way they want,” said Coletto.

An entitled generation?

Young Canadians are also critical of their peers.  The survey asked young Canadians whether they agreed or disagreed that “many people in my generation want the best that life has to offer, but aren’t willing to work hard for it.”

More than two-thirds (68%) of young Canadians surveyed agreed with the statement while only 9% disagreed.

“Millennials are often described as coddled and lazy.  While those labels certainly do not describe everyone in the generation, young Canadians themselves do appear to believe that many of their peers feel entitled and don’t want to work hard to achieve things that previous generations achieved,” said Coletto.

About the study

These are some of the findings of the Life, Work, and the Emerging Workforce Study, commissioned by the Canadian Council of Chief Executives and conducted by Abacus Data between March 19 and 25, 2015. Researchers interviewed 1,700 Canadians aged 18 to 35 about their attitudes, perceptions and behaviours toward the job market and life overall.

A random sample of panelists was invited to complete the survey from a large representative panel of Canadians, recruited and managed by Research Now, one of the world’s leading provider of online research samples.

The Marketing Research and Intelligence Association policy limits statements about margins of sampling error for most online surveys.   The margin of error for a comparable probability-based random sample of the same size is +/- 2.4%, 19 times out of 20.

The results were weighted according to census data to ensure that the sample matched Canada’s population of 18 to 35 year olds according to age, gender, educational attainment, and region. Totals may not add up to 100 due to rounding.

titlepage
Download the full report (PDF)

Liberals and Tories Tied as Harper’s Negatives Rise

PdfExport

Along with our study on perceptions about the Hijab and Niqb released Wednesday, our latest nationwide polling explored our monthly political tracking questions.

Our findings:

Across Canada, 33% of our decided voters in our sample would vote Liberal, 32% Conservative, and 23% NDP.  The Green Party polls at 6% nationwide and 13% in BC. The BQ is at 17% in Quebec, unchanged from last month.  Overall, the results are largely unchanged from our previous poll in February which had the Conservatives at 35% and the Liberals at 34% and the NDP at 24%.

Slide4

In the two provinces with the most seats at stake, the race is very competitive. In Ontario, the Liberals and Conservatives are in a dead heat with 36% for the Liberals and 34% for the Conservatives, followed by the NDP at 24%.  In Quebec, the Liberals are at 28%, the NDP 27% and the Conservatives stand at 23%.

regional

For the Conservatives, there is a slight softening of some other indicators.  The view that the country is headed in the “wrong direction” is up six points from last month. “Right direction” has slid from 50% in December to 42%.

Slide6

This month, 22% say the government has governed well enough that it deserves to be re-elected, 38% say poorly enough that it deserves to be voted out of office.  These numbers have also shifted slightly for the worse from the standpoint of the incumbents.

Slide10

Feelings about Stephen Harper are also weaker in this latest wave of results.  45% indicate a negative impression of the Prime Minister, up five points since last month.  For his main opponents, impressions have remained consistent from last month.  Thomas Mulcair finds 29% positive and 20% negative impressions.  For Justin Trudeau, the latest results are exactly the same as last month with 35% having a positive impression and 30% negative.

Slide7
Slide8
Slide9

Health care, job creation, and taxes remain the top three issues ranked important by those in our sample. The percentage of Canadians ranking public safety and terrorism as a top issue continues to edge upwards, with 21% now ranking in their top three.

Slide3

Among those who consider health care, jobs, the environment, middle class incomes, and accountability top issues, the Liberals have an advantage.  The Tories lead among those who care about taxes, security and terrorism, fiscal policy and crime and safer communities.  The NDP leads among those who rank poverty in their top three issues.

OMNIResults_March2015_Issueandvote

The Upshot?

The Conservatives and Liberals continue to be statistically tied in voter intentions, which resulted from a rise in CPC support and a softening of LPC support, this month’s result represent a pause in or possibly a slight reversal of that trend.

Feelings about the direction of the country have slipped a bit.  Mr. Harper’s ratings are also weaker than they were last month and views of his competitors have remained stable, and more positive.

The Conservatives have an advantage on fiscal, tax and public safety issues, and the number of voters mentioning terrorism and security as a top concern continues to grow.  On jobs, middle class incomes, accountability and the environment, the Liberals have an advantage.  The NDP continues to struggle to be competitive with the other two party brands, and is least competitive on fiscal, tax, public safety and natural resources development issues.

Methodology

Our survey was conducted online with 1,000 Canadians aged 18 and over from March 20 to 22, 2015. A random sample of panelists was invited to complete the survey from a large representative panel of Canadians, recruited and managed by Research Now, one of the world’s leading provider of online research samples.

The Marketing Research and Intelligence Association policy limits statements about margins of sampling error for most online surveys.   The margin of error for a comparable probability-based random sample of the same size is +/- 3.1%, 19 times out of 20.  The data were weighted according to census data to ensure that the sample matched Canada’s population according to age, gender, educational attainment, and region. Totals may not add up to 100 due to rounding.

We offer global research capacity with a strong focus on customer service, attention to detail and value added insight.  Our team combines the experience of our Chairman Bruce Anderson, one of Canada’s leading research executives for two decades, with the energy, creativity and research expertise of CEO David Coletto, PhD. For more information, visit our website at http://www.abacusdata.ca/

In case you missed it, here are some of our recent releases:

Niqabs, Hijabs, Anxiety and Accommodation

Canada’s mission against ISIL: What comes next?

Conservatives and Liberals locked in dead heat. Eve Adams defection reactions mixed. 

Party Leaders are People Too

Economic anxiety on the rise; Canadians want pragmatic policy making

Should carbon be priced?  Should public opinion decide pipelines?

Niqabs, Hijabs, Anxiety and Accommodation

PdfExport

UPDATED at 12:15pm ET

Our latest nationwide study of public opinion included questions about the rights of Muslim women to wear the hijab or the niqab. To assist respondents in considering this topic, we showed them pictures of both garments, and asked separate questions about each.

Highlights

• 51% “feel uncomfortable around women wearing” a niqab — 22% in the case of a hijab.

• Over half (56%) “prefer if women in Canada did not wear the niqab in public places”; 33% feel that way about the hijab.

• Still, in answer to another question, more than half (55%) found themselves agreeing that “it should be a matter of personal choice in Canada if a woman wishes to wear” a niqab; 73% say that about a hijab. The only subgroup where the majority feels otherwise about the Niqab is among Bloc Quebecois voters.

• Even more – 64% – agreed, “regardless of whether I like the niqab, it’s not really my place to say what others should or shouldn’t wear”. 77% said the same about the hijab.

• 38% believe “all women who wear a niqab do so because they are forced to by men”, and 28% feel that way about the hijab. The majority feel that some women who wear a hijab (71%) or niqab (58%) “do so as a matter of their own personal choice”.

• 62% agree that they “the Muslim faith is in some ways ‘anti-women“. However the same proportion (61%) agreed “I think many religions could be described as somewhat ‘anti women

• 60% feel “political leaders should generally avoid making comment on religious customs” but 64% agree that “it’s appropriate to have rules for what people wear in citizenship ceremonies”.

Slide1
Slide2
Slide3

Citizenship Ceremony

The recent debate about whether women should be obliged to bare their faces during the citizenship ceremony was also part of our probing. We offered two propositions:

“Women should be obliged to have uncovered faces when they are taking the oath of citizenship”

“It should be a matter of personal choice if a woman wants to wear a Niqab as long as she removes it for identification purposes before the ceremony”

Given these alternatives, 61% believe that faces should be uncovered, and 39% see this as a matter of personal choice. Fully 80% in Quebec, 81% of BQ voters, and 87% of Conservative voters do not believe this should be a personal choice.

Slide4
Slide7
Slide6
Slide5

There is also a clear generational divide, with the majority of those under 30 believing it should be a matter of choice and the majority of those over that age feeling it should not.

59% say the federal government is right to “challenge the recent court ruling and do what it can to ensure that women do not wear these garments during citizenship ceremonies” while 41% say Ottawa should let the ruling stand and focus on other issues”. Again, a striking generational divide is evident. Liberal voters are evenly split, as is opinion in Ontario, while Quebecers are more supportive about the challenge.

Note: “After the fact, we realized that our question contained an inaccurate reference to the Court’s ruling: our wording mentioned the Charter of Rights, rather than the Citizenship Act.  We would note that a question earlier in the same poll, which did not mention the Charter, found a similar, slightly larger majority agreeing with the proposition that it is appropriate to have rules for what people wear in citizenship ceremonies or when voting. The conclusion to be drawn is that a majority side with the PM when it comes to faces being covered during a citizenship ceremony.”

Slide8
Slide10
Slide9


Slide11

When asked whether the motive of the PM has more to do with seeking votes or a true belief on the issue, opinion is split, with 53% saying the PM “truly believes this is an important issue and a bad ruling by the court” and 47% saying “he thinks it will be popular with those who may be inclined to vote for his party”.

The Upshot

According to Bruce Anderson:

The results show that this issue is complex and reveal that many Canadians feel somewhat conflicted: on the one hand feeling discomfort with the Niqab but at the same time reluctant to have their views imposed on other people.

The Niqab is clearly seen in a different light than the Hijab, results are often 20 points or more different based on the type of garment being probed.

These issues tend to divide groups of Canadians. Rural, older, Conservative, Quebec and in particular BQ voters are more anxious about the niqab whereas younger, urban Canadians are more persuaded that these are personal choices.

Most resist the generalization that these garments reflect an anti-women culture, and believe that other religions have customs that could be characterized this way as well.

The government finds majority support for its position on wearing of the Niqab during citizenship ceremonies, and for challenging the court ruling. Clearly though, other responses indicate that the public has mixed feelings about how far politicians should go in constraining personal choice.

Methodology

Our survey was conducted online with 1,000 Canadians aged 18 and over from March 20 to 22, 2015. A random sample of panelists was invited to complete the survey from a large representative panel of Canadians, recruited and managed by Research Now, one of the world’s leading provider of online research samples.

The Marketing Research and Intelligence Association policy limits statements about margins of sampling error for most online surveys. The margin of error for a comparable probability-based random sample of the same size is +/- 3.1%, 19 times out of 20. The data were weighted according to census data to ensure that the sample matched Canada’s population according to age, gender, educational attainment, and region. Totals may not add up to 100 due to rounding.

We offer global research capacity with a strong focus on customer service, attention to detail and value added insight. Our team combines the experience of our Chairman Bruce Anderson, one of Canada’s leading research executives for two decades, with the energy, creativity and research expertise of CEO David Coletto, PhD.

In case you missed it, here are some of our recent releases:

Canada’s mission against ISIL: What comes next?

Conservatives and Liberals locked in dead heat. Eve Adams defection reactions mixed. 

Party Leaders are People Too

Economic anxiety on the rise; Canadians want pragmatic policy making

Should carbon be priced?  Should public opinion decide pipelines?

Political Leaders as Brands: What do Voters See?

[Updated at 11:41am ET]

Our latest nationwide polling asked respondents to consider a series of choices of words or thoughts and asked which they most associated with three main party leaders. Our findings:

For Thomas Mulcair

His strongest attributes were: good guy, serious and competent. More than 70% associated these thoughts with the NDP leader.  60% or more also associated Mr. Mulcair with: successful, good ideas, brilliant (the other choice was “lacking intelligence”), trustworthy, even-tempered, future, experienced, thinks of others, reasonable (not “radical”) and new ideas.    Areas of relative weakness (40% or more associated these with Mr. Mulcair):  old ideas, tired, old fashioned.

Slide2 For Stephen Harper

His strongest attributes were: experienced and serious. More than 70% associated these thoughts with the Conservative leader. 60% or more also associated Mr. Harper with: competent, even-tempered, good guy, successful, brilliant, and reasonable.  Areas of relative weakness (40% or more):  self-centered, tired, past (not future), not trustworthy, old fashioned, old ideas, bad ideas, and radical.

Slide1 For Justin Trudeau

Mr. Trudeau’s strongest attributes were: young at heart, good guy, modern, new ideas, future, even tempered. More than 70% associated these with the Liberal leader.  More than 60% also associated Mr. Trudeau with: successful, brilliant, competent, good ideas, trustworthy.   Areas of relative weakness (40% or more associated these with Mr. Trudeau) are:  unproven, radical, and self-centered.   People were evenly divided on whether Mr. Trudeau was more serious, or more fun.

Slide3

Another way to examine these numbers is to look at which leader is most closely associated with the attributes. Here is a selection:

Experienced Harper 74% Mulcair 64% Trudeau 40%
Modern Trudeau 79% Mulcair 58% Harper 50%
Future Trudeau 76% Mulcair 65% Harper 52%
New Ideas Trudeau 74% Mulcair 60% Harper 49%
Even tempered Trudeau 71% Mulcair 67% Harper 64%
Good guy Mulcair 78% Trudeau 78% Harper 62%
Competent Mulcair 74% Trudeau 64% Harper 64%
Thinks of others Mulcair 63% Trudeau 54% Harper 44%
Good ideas Mulcair 69% Trudeau 64% Harper 55%.
Trustworthy Mulcair 68% Trudeau 61% Harper 52%

The Upshot?

Clearly, many people see positive attributes in each of the party leaders. The Prime Minister is seen serious, experienced and competent. He’s more likely seen as a good guy than a bad person, but his ideas are seen by some as more dated and controversial.  He scores weakest on “thinking of others”.  On questions of competence and brainpower, the PM is competitive, but does not lead the others.

Mr. Mulcair is generally quite well regarded by voters. His biggest advantage over the others are being seen as a good guy, competent and empathetic.  His challenges are largely vis a vis Mr. Trudeau, compared to who he is seen as less contemporary.  Despite the “angry Tom” critique sometimes heard, Canadians generally see him as even-tempered. He is not seen as particularly radical.

Mr. Trudeau is seen as someone who can bring a fresh, modern perspective to political leadership.  He is seen as a likeable individual. He is seen as lacking in experience, but competitive when it comes to competence and brainpower.  His biggest risk factors are that one in two wonder if his ideas may be radical, and the feeling that he has less experience than his competitors.

Methodology

Our survey was conducted online with 1,460 Canadians aged 18 and over from February 12 to February 16, 2015. A random sample of panelists was invited to complete the survey from a large representative panel of Canadians, recruited and managed by Research Now, one of the world’s leading provider of online research samples.

The Marketing Research and Intelligence Association policy limits statements about margins of sampling error for most online surveys. The margin of error for a comparable probability-based random sample of the same size is +/- 2.6%, 19 times out of 20. The data were weighted according to census data to ensure that the sample matched Canada’s population according to age, gender, educational attainment, and region. Totals may not add up to 100 due to rounding.

We offer global research capacity with a strong focus on customer service, attention to detail and value added insight.  Our team combines the experience of our Chairman Bruce Anderson, one of Canada’s leading research executives for two decades, with the energy, creativity and research expertise of CEO David Coletto, PhD. For more information, visit our website at http://www.abacusdata.ca/

Provincial and Federal Liberals have a big lead in Newfoundland and Labrador

PdfExport

According to a new Abacus Data random telephone survey of 653 eligible voters in Newfoundland and Labrador conducted from February 17 to 25, 2015, the NL Liberals continue to hold a large lead over the PC Party.

The Liberals lead the Tories by 25-points with support for the Liberals at 57% among committed voters compared with 32% for the Tories and 9% for the NDP.  Liberal support is up 9-points since August, while the PC support is down 2, and NDP support is down 5.

More concerning for the PC Party is the finding that fewer eligible voters would even consider voting PC. Four in ten eligible voters said they would consider voting PC while 48% said they would not consider voting PC.   That is an eleven point decrease from August 2014.. This compared with 65% of eligible voters who said they would consider voting Liberal.

Other findings from the survey include:

– 72% think the Liberals will win the next NL election; 15% picked the PCs and 2% picked the NDP

– Top provincial issues: economy/jobs (27%), healthcare (20%), budget deficit (13%).39% think NL is headed in the right direction; 40% think it is off on the wrong track.

– Impression of Liberal leader Dwight Ball – 47% positive, 30% neutral, 13% negative

– Impression of PC leader Paul Davis – 32% positive, 36% neutral, 26% negative

– 51% approved of Premier Davis’ dispute with the federal government over the CETA

– 54% approved of the decision to reduce number of seats in House of Assembly from 48 to  40

– 65% of those who voted PC in 2011, but now support another party or undecided say there is nothing the PC Party can do that would make them support it again.

Federally, the Liberal Party of Canada holds a commanding 35-point lead over the Conservative Party in Newfoundland and Labrador among committed voters.  58% of committed voters said they would vote Liberal if an election was held at the time of survey, compared with 23% for the Conservatives and 16% for the NDP.

Near the end of the survey, respondents were asked who – NDP MP Ryan Cleary or Liberal candidate Seamus O’Regan running in St. John’s South-Mount Pearl – would they rather see representing NL ‘s interests in Ottawa.  Cleary edged out O’Regan across the province 40% to 36%.  On the Avalon Peninsula and in St. John’s Cleary’s lead was six-points over O’Regan.

Methodology

The random live-interview telephone survey was conducted with 653 eligible voters living in Newfoundland and Labrador.  The survey was completed from February 17 to 25, 2015.

The margin of error for a probability-based random sample of 653 respondents using a probability sample is +/- 3.9%, 19 times out of 20.

The data was statistically weighted according to census data to ensure that the sample matched population of Newfoundland and Labrador.

Note the small sample sizes when reviewing results in subgroups.

Download the full report (pdf)

Canada’s mission against ISIL: What comes next?

PdfExport

In our latest nationwide poll, we asked some questions about Canada’s mission against ISIS/ISIL. Here are the results:

When informed that the Government of Canada must soon decide whether to continue or end our participation in the mission, 43% felt that Canada should continue, while 38% said that Canada should withdraw when the period of time we committed to is over. Another 19% said they didn’t know.

Support for continuing was higher in Alberta (53%) and Ontario (48%) and lower than average in Quebec (31%). Most men favour continuing (51%) while the plurality of women would prefer to see the mission end (40%). There is a significant generational skew to these results, with younger people favouring an end, and older voters taking the opposite position.

By a margin of 61%-27% Conservative voters would rather see the mission be extended. That is the plurality view of Liberal voters too (49%-35%). NDP voters lean in the opposite direction (48% withdraw – 34% continue).

Slide1


We asked what the opposition parties should do if the government decided to extend the mission. Across the country, 48% said the Liberals should support that decision, while only 27% said the Liberals should vote against such a decision.

Slide2

Among Liberal Party voters, 57% said the Liberals should support a government decision to continue. In the critical battleground of Ontario, 54% said the Liberals should vote to support a motion to continue, while 24% said the Liberals should oppose.

When asked what the NDP should do in the event of a government decision to continue, the results are highly similar: 46% said the NDP should support, and 26% oppose. Among NDP voters, there was an even split with 37% saying the NDP should vote with the government, 36% against.

Slide3


Worth noting is that about one in five people who personally would rather see Canada withdraw think the opposition parties should support a decision to continue, if that is the position taken by the government. Among those who aren’t sure what Canada should do, the tendency is to want to see opposition parties support rather than oppose the government, if it decides to continue.

Slide4


Canadians may hesitate to support a combat role (boots on the ground) but seem reluctant to rule it out as well. 35% say if we participate “we should have our troops be involved in any and all combat roles that are necessary” while 42% say “If we participate we should make sure our troops are not involved in on the ground combat roles” and 23% are unsure.

In Quebec (52%) and BC (42%) , more prefer to avoid combat roles, while in Ontario, the Prairies and Alberta pluralities say we should play whatever role is needed. Opinion is split in Atlantic Canada.

Views on this question are also divided by gender and generation, and political leaning. Worth noting for the Liberals is that voters who will consider only the Liberals and NDP there is a preference for avoiding combat (49%) whereas among those voters who would consider either the Liberals or the Conservatives, the opposite tendency exists.

Slide5


Finally, when asked what effect they thought our participation was having on the threat of terror activities against Canada, 37% said they thought the risk was increasing, 23% reducing and 20% having no effect. Another 20% said they did not know.

Slide6


Among those who think that participating in the mission is resulting in a heightened risk to Canada, 31% support taking on combat roles, while 53% prefer to see Canadian troops avoid combat roles. The oppose is true among those who think the mission is reducing the threat of terror attacks in Canada: 57% support a combat role while 33% do not.

Slide7
The upshot?

Canadians reveal a degree of uncertainty about the mission, but nothing that could be described as widespread resistance to the idea of continuing. This seems to be a situation where people believe that government leadership should make the decision it feels is best, given the information at their disposal, and if that decision is to continue, then it would be best not to have this be opposed by the other parties.

On the question of combat participation, the results suggest that people might prefer to see Canada avoid such risks, but are also open to the argument that pulling our share means taking on riskier assignments too.

Willingness to go along with the mission, despite feeling that it may be increasing the risks of terrorism against Canada suggests that many Canadians have decided that this is a fight we are obliged to support, and that degrading the risk will take time.

Opposition parties may read these results as a signal that Canadians expect scrutiny and thoughtful debate about our role, but that unless they offer a persuasive argument about what alternative approach would be better, they will be expected by many voters to avoid the temptation to make this a routine exercise in partisan disagreement.

Methodology

Our survey was conducted online with 1,460 Canadians aged 18 and over from February 12 to February 16, 2015. A random sample of panelists was invited to complete the survey from a large representative panel of Canadians, recruited and managed by Research Now, one of the world’s leading provider of online research samples.

The Marketing Research and Intelligence Association policy limits statements about margins of sampling error for most online surveys. The margin of error for a comparable probability-based random sample of the same size is +/- 2.6%, 19 times out of 20. The data were weighted according to census data to ensure that the sample matched Canada’s population according to age, gender, educational attainment, and region. Totals may not add up to 100 due to rounding.

We offer global research capacity with a strong focus on customer service, attention to detail and value added insight. Our team combines the experience of our Chairman Bruce Anderson, one of Canada’s leading research executives for two decades, with the energy, creativity and research expertise of CEO David Coletto, PhD. For more information, visit our website at http://www.abacusdata.ca/

In case you missed it, here are some of our recent releases:

Conservatives and Liberals locked in dead heat. Eve Adams defection reactions mixed. 

Party Leaders are People Too

Economic anxiety on the rise; Canadians want pragmatic policy making

Should carbon be priced?  Should public opinion decide pipelines?

Looks, Gender, and Ideas: Do these matter?

Political Leaders’ Choices and Voters’ Perspectives

Conservatives and Liberals locked in dead heat. Eve Adams defection reactions mixed.

PdfExport

Our latest nationwide polling explored a number of topics, which we will post over the next week. For this initial release, we look at the headline numbers as well as reactions to the high profile floor crossing of MP Eve Adams.

Our findings:

Across Canada, 35% of decided voters in our sample would vote Conservative, 34% Liberal, and 21% NDP. The Green Party polls at 4% nationwide and 9% in BC. The BQ is at 17% in Quebec. This is largely unchanged from our previous poll in January which had the Conservatives at 33% and the Liberals at 32% and the NDP at 24%.

Based on the sample size (1,460) there is a 65% chance that the Conservatives are leading the Liberals. Based on the confidence interval, the Conservatives could be leading by as much as six points while the Liberals could be leading by as much as four points.

In the three most critical provincial races, results continue to show tight competition involving the three national parties. In BC, we see the Liberals with 35%, followed by the Conservatives at 32% and the NDP at 21%. In Ontario, the Conservatives have a lead with 42%, followed by the Liberals at 34% and the NDP at 19%. In Quebec, the Liberals are at 32%, the NDP 31% and the Conservatives have climbed to 18%.

Slide3
Slide2

Asked to predict the winner of the next election, 34% say the Conservatives will win, 33% the Liberals. In August of last year, the Liberals were predicted to win by 39%, the Conservatives by 25%.  A fairly steady 7% predict an NDP win.

Slide4

While some indicators have improved for the Conservatives in recent months, including voting intentions, in this latest survey we also see some softening of a few indicators. The number of people who say the country is heading in the right direction has slipped from 50% in December to 43% now.

Slide5

Feelings about Stephen Harper improved through the fall, and have been stable of late. As in January, our February survey shows the PM with 34% positive impressions and 40% negative.

For Thomas Mulcair, results are also not shifting noticeably. He finds 28% positive and 20% negative impressions.

As for Justin Trudeau, the latest results are slightly better than last month’s. He finds 35% positive, 30% negative opinions. Mr. Trudeau’s negatives had risen from 27% to 34% between November and January, before dropping this month.

Slide6
Slide7
Slide8

This month, 24% say the government has governed well enough that it deserves to be re-elected, 34% say poorly enough that it deserves to be voted out of office, and 31% find themselves “in between these two points of view”. These numbers are a substantial improvement for the government over those found late last summer, when 38% said voted out, and 19% said re-elected.

Slide9

The floor crossing decision of MP Eve Adams attracted considerable attention among political observers, and generated lots of commentary. Among the public, just over half 56% heard of this event.

Of those aware of the floor crossing:

28% said Ms. Adams made a bad decision, 33% said an “acceptable decision given her circumstances” and 16% said she made a good decision. Among CPC voters, 9% said “good” and 25% said “acceptable” decision. Among NDP voters, 20% said “good” and 36% said “acceptable”. Among LPC voters 25% said “good” and 44% “acceptable”.

36% said the Liberal Party was right to accept her, while 40% said the Liberals should have turned her away. Among Liberals, the majority (58%) said the party was right to accept her, 24% said the opposite. NDP voters were evenly split (38%-37%). Among Conservatives 24% said the Liberals did the right thing, while the majority said she should have been rejected. Among swing voters, the plurality view (48%-31%) was in favour of accepting Ms. Adams rather than rejecting her.

Slide18

In terms of the motivation for her decision, we provided three possible scenarios: she was unwanted by the Conservatives, she was uncomfortable with Mr. Harper’s leadership, or both equally. 36% said the main reason was being unwanted by the Conservatives, 31% said both factors were equally involved, and 17% said the main driver was discomfort with the Prime Minister’s leadership.

Women as well as NDP and Liberal supporters were more likely than average to believe that discomfort with the PM was at least partly a motivating factor. Conservative voters were inclined to believe the main reason was being unwanted (56%) although a total of 29% imagined that her feeling about the PM was an equal or greater factor.

Slide19

The Upshot?

According to Abacus Chairman Bruce Anderson:

For the Conservatives, these results are the latest indication of improving competitiveness, including in Quebec and Ontario. We have seen numbers swing back and forth a bit in Ontario in some of our more recent unpublished polls, which underscores the value of studying aggregations and averages over time rather than trying to provide seat projections at this time.

The Liberal Party can see mixed news in these results. While the recent softening of impressions of Mr. Trudeau has not continued this month, the consistent and substantial lead they enjoyed for many months has been replaced by a dynamic and competitive situation. They will have to beat a competitive Conservative Party if they are going to win an election this year. Overall levels of anger towards the government are modest, especially for a government that has been in office for this length of time. Roughly a third of likely voters remain to be persuaded of the case for change or against change.

The situation for the NDP remains largely unchanged. They are highly competitive in Quebec, but are having trouble gaining momentum in other parts of the country. Few see them as a likely winner of the next election, which means continued risk of strategic voting working to the advantage of the Liberals.

On the Eve Adams decision, it seems unlikely that this episode will have a major lingering effect on public opinion. While many political commentators had strong views, almost half of the public did not notice the story, and among those who did, opinions seem rather mixed. While there isn’t much evidence of enthusiasm for the outcome among Liberals, neither is there a great deal of outrage.

Methodology

Our survey was conducted online with 1,460 Canadians aged 18 and over from February 12 to February 16, 2015. A random sample of panelists was invited to complete the survey from a large representative panel of Canadians, recruited and managed by Research Now, one of the world’s leading provider of online research samples.

The Marketing Research and Intelligence Association policy limits statements about margins of sampling error for most online surveys. The margin of error for a comparable probability-based random sample of the same size is +/- 2.6%, 19 times out of 20. The data were weighted according to census data to ensure that the sample matched Canada’s population according to age, gender, educational attainment, and region. Totals may not add up to 100 due to rounding.

We offer global research capacity with a strong focus on customer service, attention to detail and value added insight. Our team combines the experience of our Chairman Bruce Anderson, one of Canada’s leading research executives for two decades, with the energy, creativity and research expertise of CEO David Coletto, PhD. For more information, visit our website at http://www.abacusdata.ca/

In case you missed it, here are some of our recent releases:

Party Leaders are People Too

Economic anxiety on the rise; Canadians want pragmatic policy making

Should carbon be priced?  Should public opinion decide pipelines?

Looks, Gender, and Ideas: Do these matter?

Political Leaders’ Choices and Voters’ Perspectives

Party Leaders are People Too

PdfExport

Our latest nationwide study of political opinion included some questions that were intended to explore what underlying perceptions Canadians have about the traits and talents of the three main party leaders. We posed a series of 16 different questions, and asked respondents to indicate which of the three leaders was most closely matched to the descriptor. Respondents received a random set of 8  scenarios.

Highlights

Stephen Harper was first choice on 5 of 16 items. The plurality picked him as the leader best suited:

• To be the CEO of a large company (47%)
• To give you advice about how to invest your money (46%)
• To give you advice about your career (41%)
• To give advice to your children about their future (37%)
• To have negotiate a contract on your behalf (38%)

Mr. Harper’s weaker associations were these:

• Most like to vacation with (24%)
• Most able to survive in the wilderness (24%)
• Most likely to stop and help if your car was stranded (22%)
• Trust to choose a good movie to watch (21%)

Thomas Mulcair was first choice on 1 of 16 items. The plurality picked him as best suited:

• To lend you $100 if you needed it (38%)

However he also finished close second on the following items, (in each case to Mr. Harper):

• To have negotiate a contract on your behalf (35%)
• To give you advice about your career (36%)
• To give advice to your children about their future (33%)

Mr. Mulcair’s weaker associations were these:

• Prefer to have babysit your kids for an evening (28%)
• Most like to have over for dinner with your family (25%)
• Most want to hear sing your favourite song (23%)
• Most like to go on vacation with (21%)

Justin Trudeau was first choice on 10 of 16 items, coming out on top on these items:

• Most like to vacation with (55%)
• Trust to choose a good movie to watch (53%)
• Most want to hear sing your favourite song (47%)
• Prefer to have babysit your kids (44%)
• Most like to have over for dinner with your family (43%)
• Most able to survive in the wilderness (42%)
• Cook the best meal (41%)
• Most like to have speak at an event in your neighborhood (41%)
• Most likely to stop and help if your car was stranded (40%)
• Trust to look after your pet (40%)

Mr. Trudeau’s weaker associations were these:

• To have negotiate a contract on your behalf (26%)
• To give you advice about how to invest your money (24%)
• To give you advice about your career (24%)
• To be the CEO of a large company (23%)

Slide15

The Upshot

According to Abacus Chairman Bruce Anderson:

These numbers paint a more detailed picture of the competition among these leaders, illuminating some of their strengths and the challenges they must seek to overcome. Mr. Harper is seen as a solid choice when it comes to the some key attributes that people look for when it comes to leadership, especially financial and management skills. At the same time, he is seen as less approachable and compassionate than his rivals.

For Mr. Mulcair the result indicate that people tend to see him as compassionate and competent, themes that he has been at pains to draw out since becoming leader of the NDP. However he is also seen as somewhat less approachable than Mr. Trudeau and not on a par with Mr. Harper in terms of CEO skills and financial judgment.

For Justin Trudeau, the results underscore the popular chord he has struck, and many Canadians sense he would be able to empathize with them and be enjoyable company. These are traits many politicians aspire to, and few achieve to this level. At the same time, Mr. Trudeau finds some hesitation on the part of voters. When it comes to his ability to manage a large organization, make sound financial decisions, negotiate on behalf of others, these data suggest he is well liked, but that he has work to do to strengthen confidence that he is a better choice across the board

We intend to revisit these traits over time, including measuring the impact of advertising on the perceptions of these leaders’ strengths and weaknesses.  Detailed tables are available here (pdf)

Methodology

Our survey was conducted online with 1,005 Canadians aged 18 and over from January 26 to January 28, 2015. A random sample of panelists was invited to complete the survey from a large representative panel of Canadians, recruited and managed by Research Now, one of the world’s leading provider of online research samples.

The Marketing Research and Intelligence Association policy limits statements about margins of sampling error for most online surveys. The margin of error for a comparable probability-based random sample of the same size is +/- 3.1%, 19 times out of 20. The data were weighted according to census data to ensure that the sample matched Canada’s population according to age, gender, educational attainment, and region. Totals may not add up to 100 due to rounding.

We offer global research capacity with a strong focus on customer service, attention to detail and value added insight. Our team combines the experience of our Chairman Bruce Anderson, one of Canada’s leading research executives for two decades, with the energy, creativity and research expertise of CEO David Coletto, PhD. For more information, visit our website at http://www.abacusdata.ca/

In case you missed it, here are some of our recent releases:

Federal Tories and Liberals in a Dead Heat

Economic anxiety on the rise; Canadians want pragmatic policy making

Should carbon be priced?  Should public opinion decide pipelines?

Looks, Gender, and Ideas: Do these matter?

Political Leaders’ Choices and Voters’ Perspectives