The public perception of Canadian politics as 2019 comes to a close
December 18, 2019
Earlier this week, we completed a national survey of 1,500 Canadians and updated our federal political tracking. While not much has changed since Canadians voted on October 21, the results point to some of the strengths and weaknesses facing parties and their leaders amid the minority parliament.
Here’s what our data show.
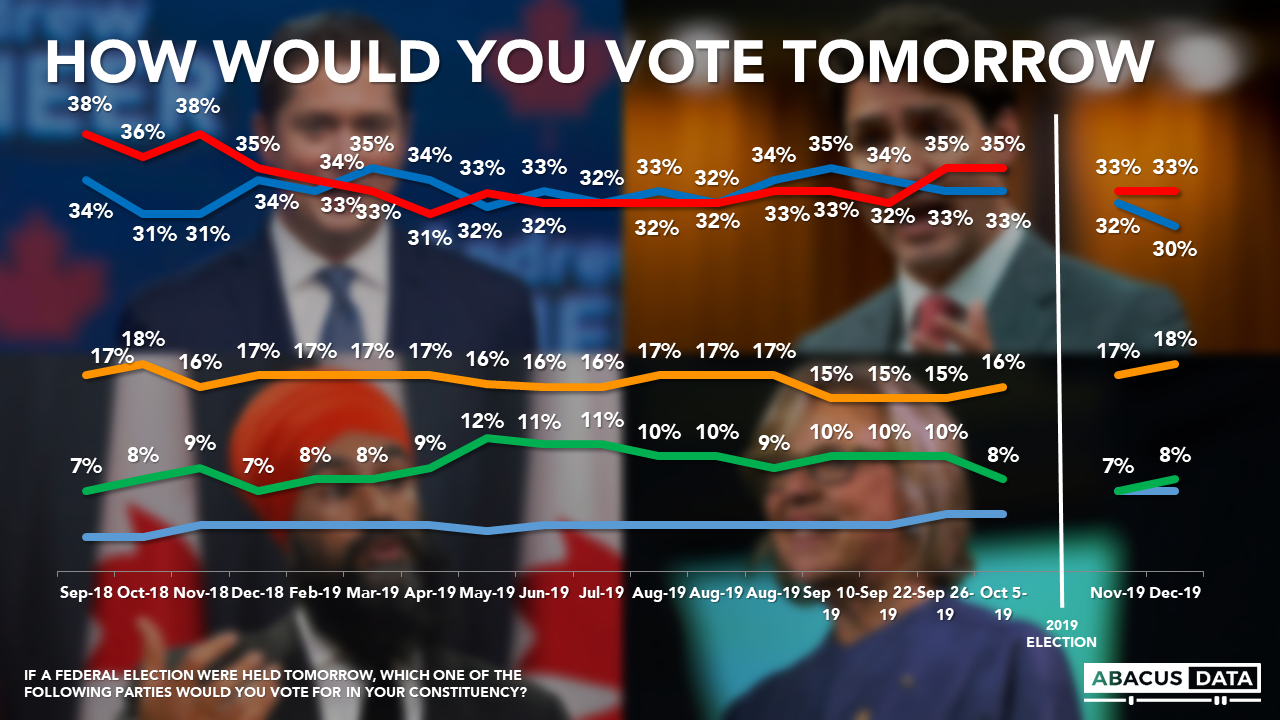
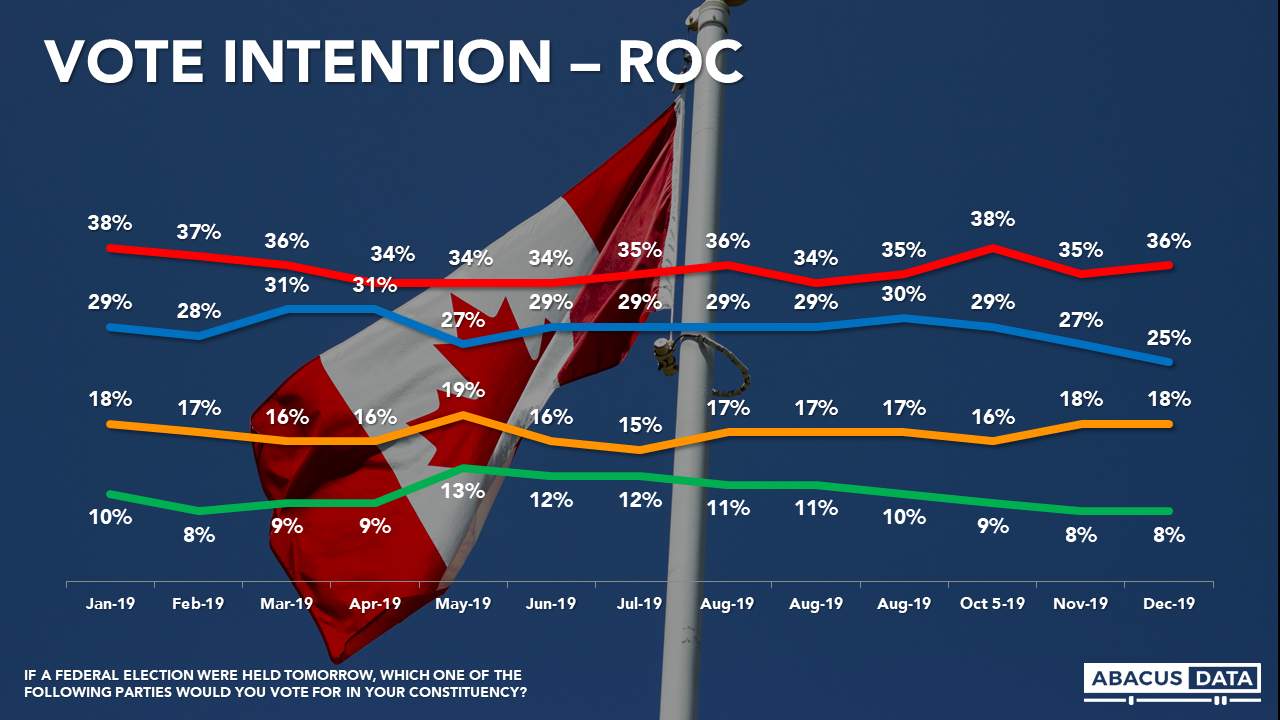
1. The national race remains tight with the Liberals ahead of the Conservatives by 3-points. Since the election, the Conservatives are down 4-points to 30% while the Liberals are steady at 33%. The NDP is at 18% nationally.
2. Regionally, the Liberals have a wide lead in Atlantic Canada, an 8-point lead in Ontario, and are statistically tied with the BQ in Quebec (31% for the BQ vs. 29% for the Liberals). The Conservatives have a wide lead in Alberta and the prairies while the NDP and Liberals are statistically tied in BC. We have the Conservatives at 21% in BC.
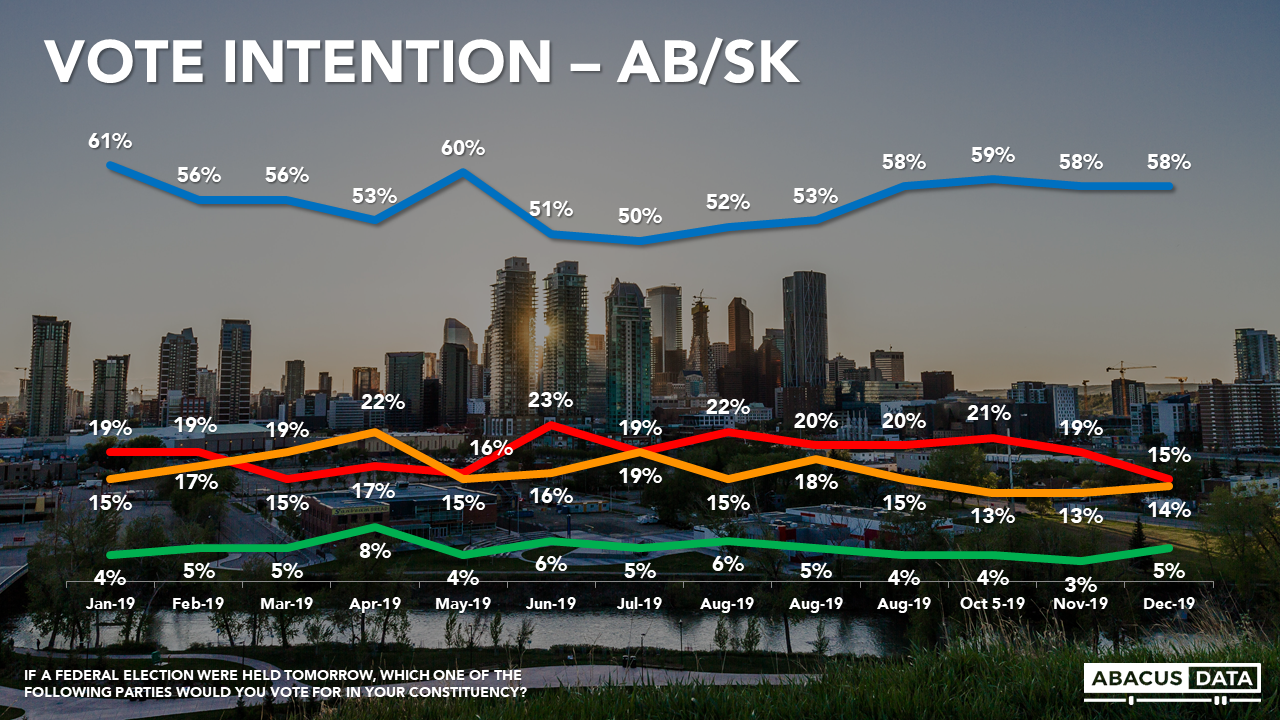
3. If we divide the country between Alberta/Saskatchewan and the rest of the country, the Liberals lead the Conservatives by 11-points outside of AB/SK (36% to 25%) while the Conservatives now lead by 43% over the Liberals in Alberta and Saskatchewan. The differences between these two regions have grown since the election.
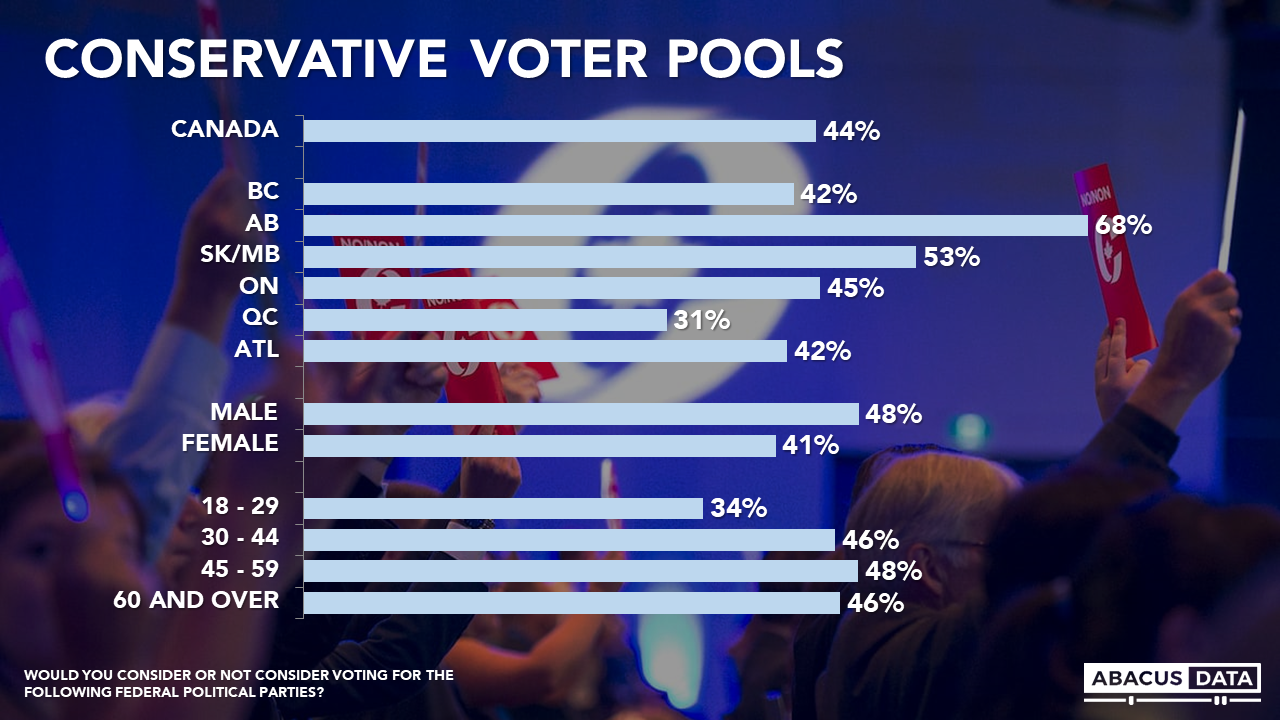
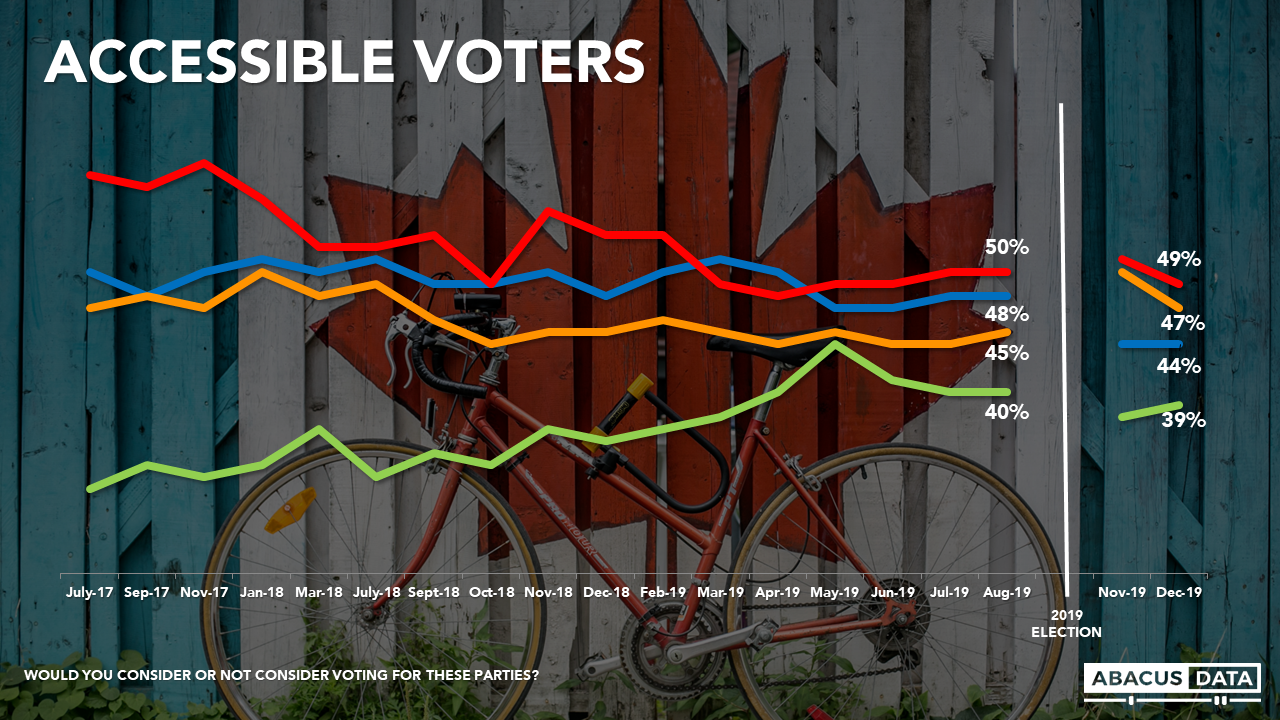
4. The Liberal Party has the largest pool of accessible voters, with 49% saying they would consider voting Liberal, unchanged from the end of August before the campaign started, and 5-points more than would consider voting Conservative. 44% would consider voting Conservative, down 4 from the start of the 2019 campaign. 47% would consider voting NDP, 39% would consider voting Green, while 46% of Quebecers would consider voting BQ.
5. For the Conservatives, its accessible voter pool is largest in Alberta (68%) and smallest in Quebec (31%). 45% of Ontarians are open to voting Conservative while 42% in BC and Atlantic Canada feel the same way. The party also needs to find a way to appeal to younger Canadians as only 34% of those aged 18 to 29 would even consider voting Conservative, 13-points lower than those aged 30 and over.
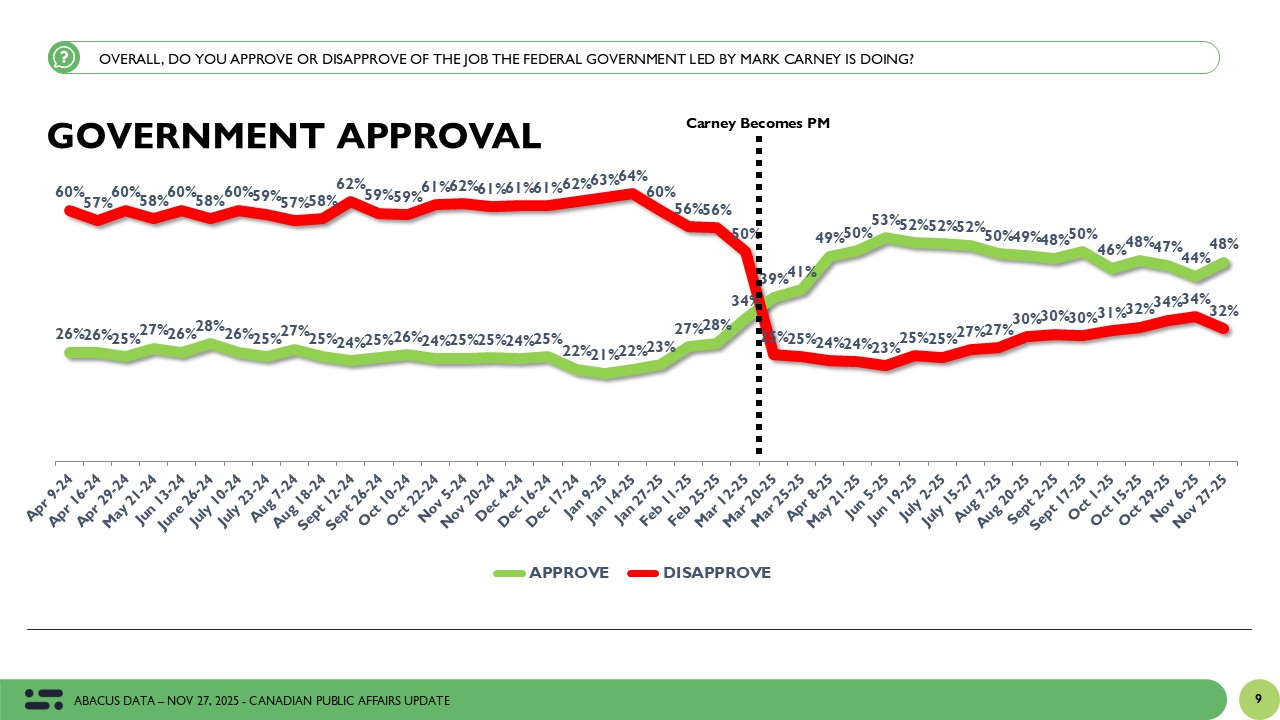
6. The federal government’s approval rating has improved slightly since the end of the election campaign. In April 2019, 32% approved compared with 48% who disapproved. Today, 39% approve and 43% disapprove. Approval is higher in Atlantic Canada (49%), Ontario (44%), Quebec (38%), and BC (37%) and lower in Alberta (26%).
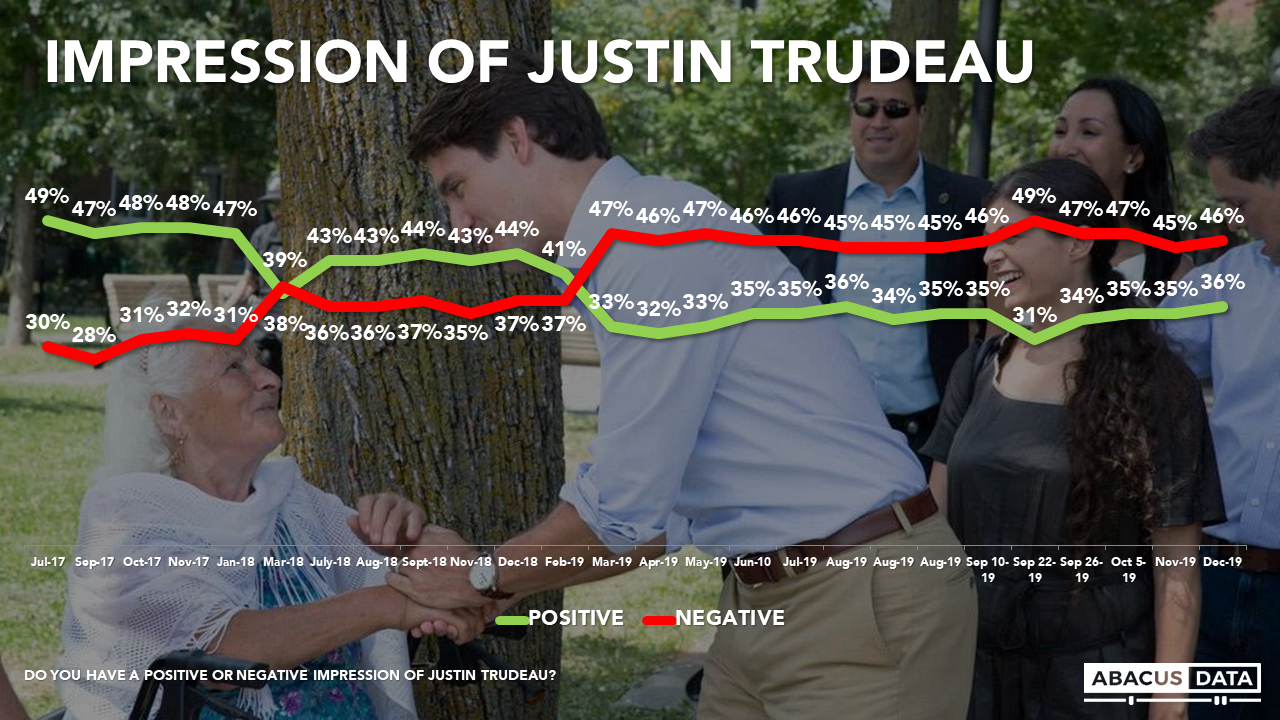
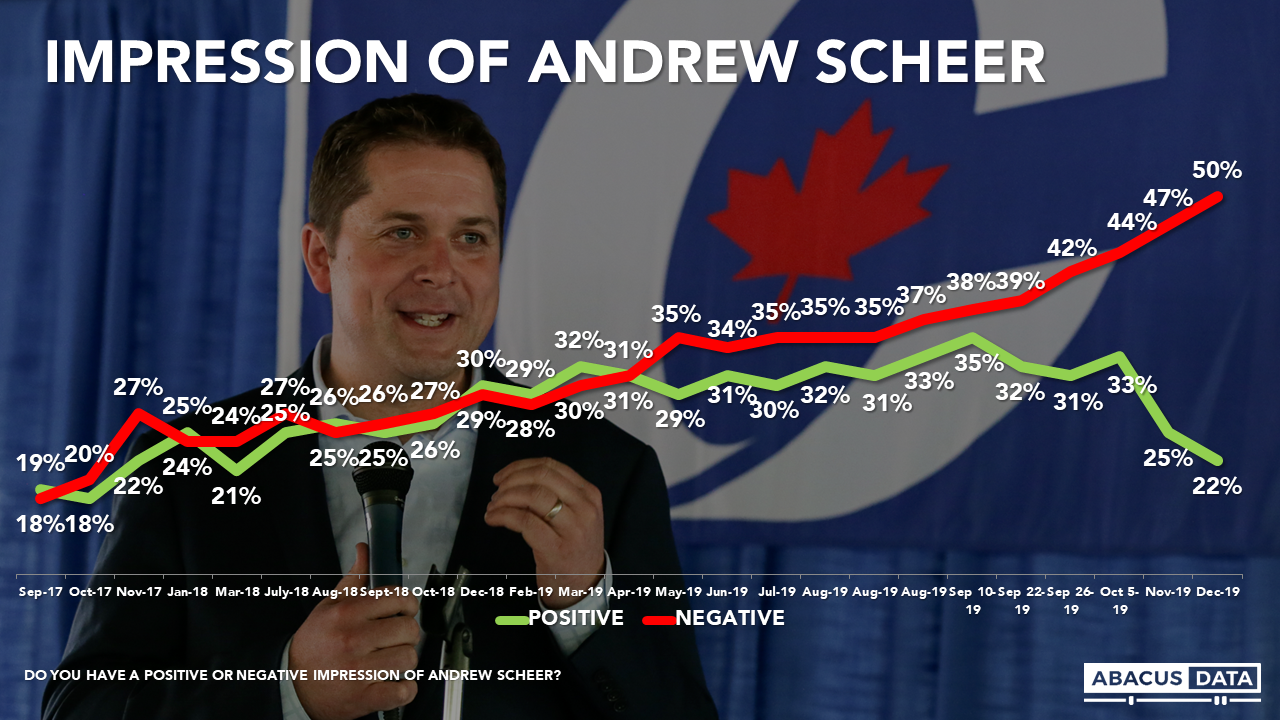
7. Impressions of Prime Minister Trudeau are consistent from last month, with 36% viewing him positively and 46% negatively. Mr. Scheer ends his time as Conservative leader with even more negative numbers. Today, only 22% have a positive impression of him, down 11 points since early October and down 3 from last month. 50% of Canadians have a negative view of Mr. Scheer.
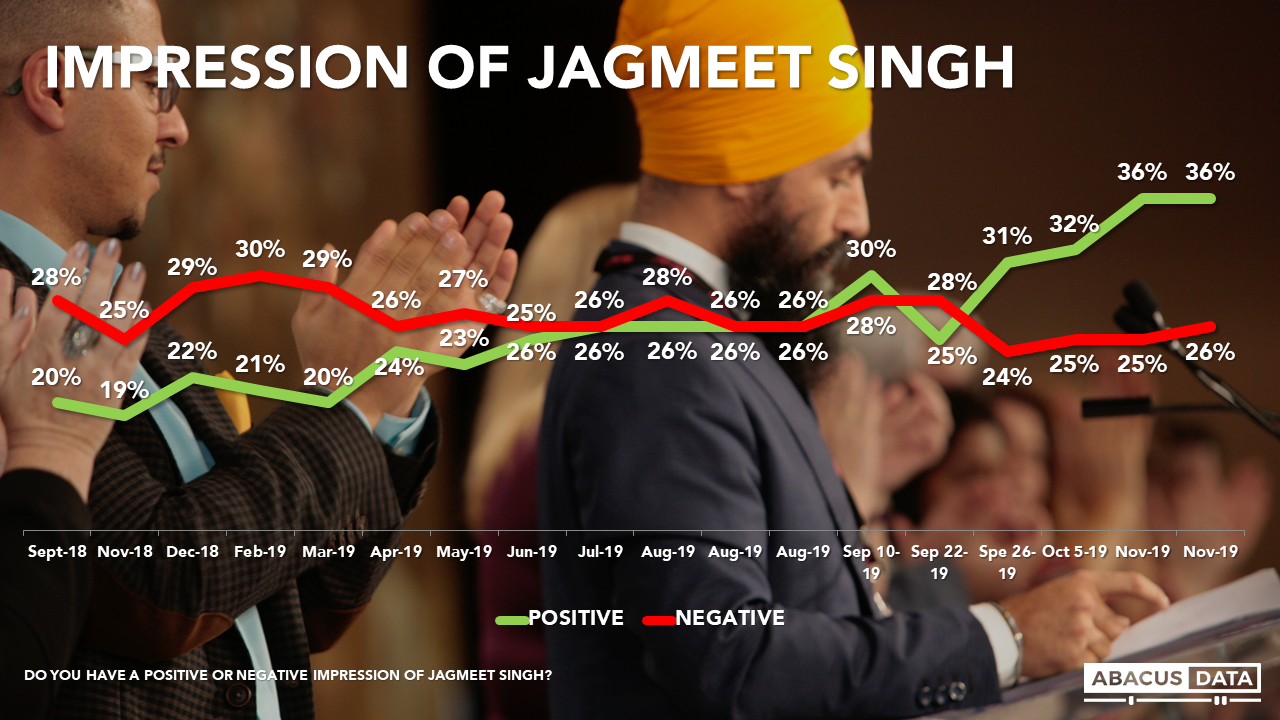
8. Mr. Singh’s numbers remain more positive than the other party leaders. 36% have a positive view of him compared with 26% who have a negative view. He’s particularly popular with those under 30 (44% positive vs. 12% negative), while those 60 and over are more likely to have a negative view of the NDP leader (28% positive, 34% negative).
UPSHOT
According to Bruce Anderson: “The trend line on public views of Andrew Scheer reinforces that the Conservative leader was struggling to find a positive connection with voters, and winning a renewed mandate would have been difficult.
Mr. Scheer’s positive ratings sagged to a level last seen a year and a half ago, but at that time, his negatives were half what they are today. In this survey, only 40% of Albertans and just 63% of Conservative voters expressed a positive view of Mr. Scheer.
Looking ahead, the Conservative Party’s accessible voter pool has declined to just 31% in Quebec, just 34% among under 30 voters, and 41% among women – thresholds that make it very difficult to put together a winning electoral coalition. As the party begins the search for a new leader, the conundrum of how to win the base, versus how to win the country is perhaps clearer than ever. There are few voters to the right of where the party stands today – many more to the left. The Party’s 43 point advantage in two provinces can create an echo chamber effect that drives policy and rhetorical choices, which could worsen the 11 point gap to the Liberals in the rest of the country. The positioning of the Conservatives on social equality and climate change will likely be central to this battle for the role of Conservative leader – and for reasons that are evident in these polling trends.”
According to David Coletto: “As 2019 comes to an end, Canadians continued to hold mixed feelings about the federal government and their political leaders. The federal government’s approval rating is up slightly, Mr. Trudeau’s personal numbers are holding steady but still more negative than positive, and the Liberals have the largest pool of accessible voters.
For the Conservatives, Mr. Scheer’s resignation provides the party to reset and assess its offering to Canadians. Mr. Scheer is now substantially less popular than he was at the start of the campaign. 50% of Canadians have a negative view of him, while only 22% view him positively, including just over half (56%) of those who voted Conservative in October. The party has a smaller pool of accessible voters than both the Liberals and NDP, something its new leader needs to expand if the party hopes to win. The focus needs to be on younger voters and Quebecers as two-thirds of those groups would not even consider voting Conservative today.
For the NDP, Mr. Singh remains the most popular leader nationally. So his strategy in 2020 should continue to focus on building on that goodwill and leveraging it expand support and appeal. While 59% of those aged 18 to 29 would consider voting NDP, Mr. Singh and the party has to find a way to appeal to older Canadians, especially Boomers who are 22-points less likely to consider voting NDP than those under 30.”
DATA GRAPHICS


METHODOLOGY
Our survey was conducted online with 1,500 Canadians aged 18 and over from December 12 to 16, 2019. A random sample of panellists was invited to complete the survey from a set of partner panels based on the Lucid exchange platform. These partners are double opt-in survey panels, blended to manage out potential skews in the data from a single source.
The margin of error for a comparable probability-based random sample of the same size is +/- 2.1%, 19 times out of 20. The data were weighted according to census data to ensure that the sample matched Canada’s population according to age, gender, educational attainment, and region. Totals may not add up to 100 due to rounding.
ABOUT ABACUS DATA
We are the only research and strategy firm that helps organizations respond to the disruptive risks and opportunities in a world where demographics and technology are changing more quickly than ever.
We are an innovative, fast-growing public opinion and marketing research consultancy. We use the latest technology, sound science, and deep experience to generate top-flight research-based advice to our clients. We offer global research capacity with a strong focus on customer service, attention to detail and exceptional value.
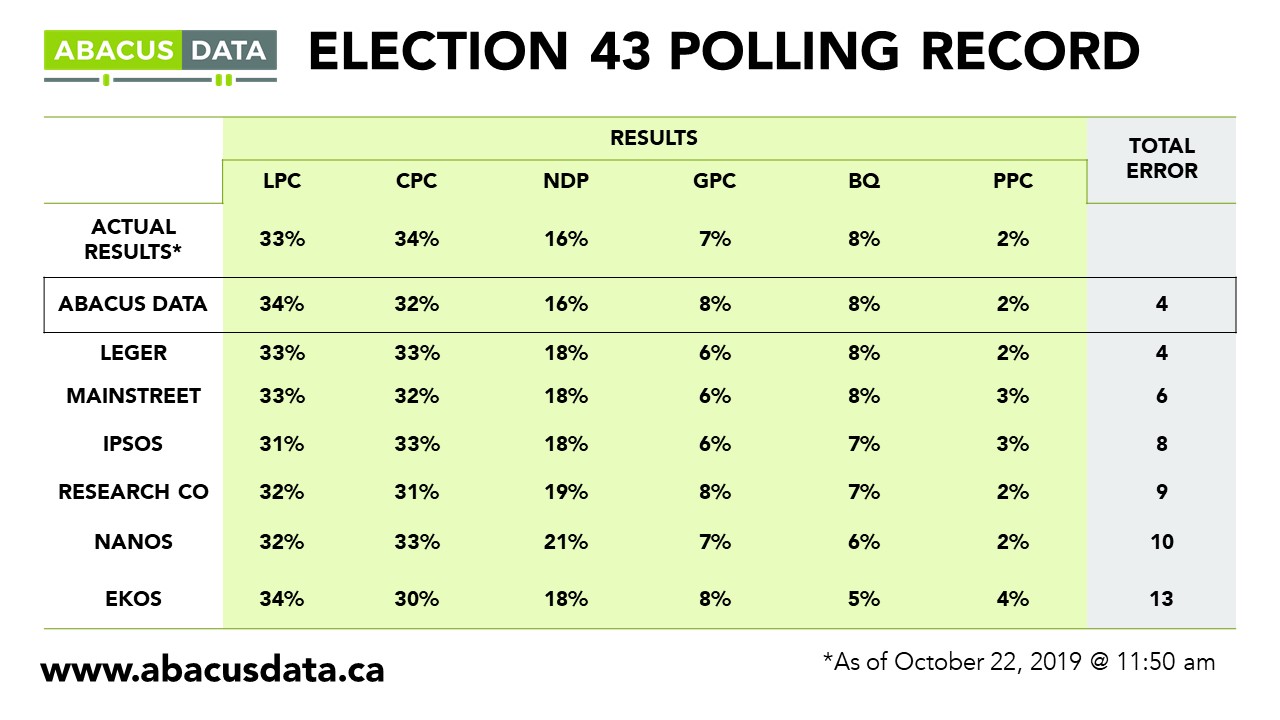
We were one of the most accurate pollsters conducting research during the 2019 Canadian Election.
Contact us with any questions.
Find out more about how we can help your organization by downloading our corporate profile and service offering.