PIPELINE POLITICS IN 2016
May 24, 2016
By Bruce Anderson & David Coletto
 For several years, construction of new pipelines to get Canadian oil to offshore markets have generated controversy involving environmental groups, industry, and politicians.
But where does the public actually stand?
Our latest survey included a series of questions designed to characterize the current mood. Here’s what we found:
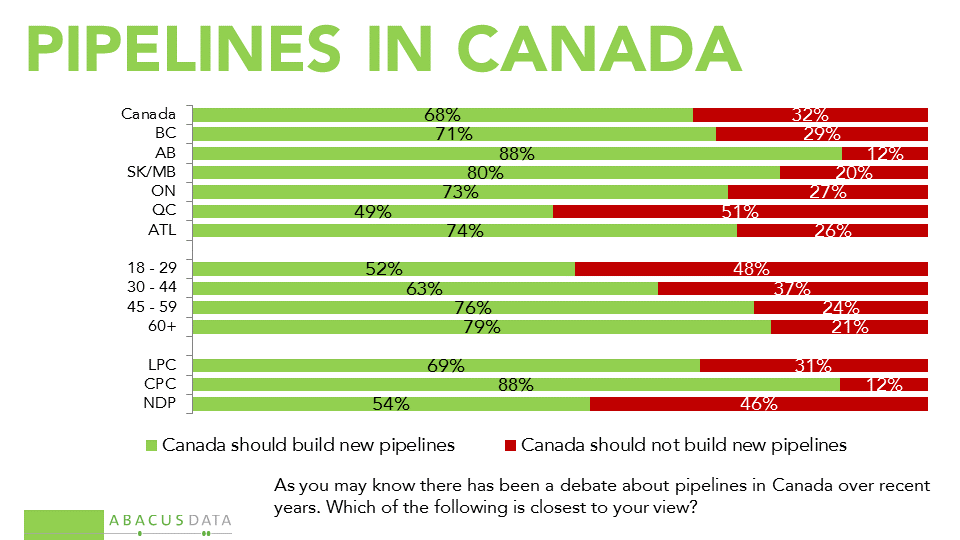
• Only one in three (32%) people agree with the proposition argued by some prominent environmental campaigners, that “Canada should build no new pipeline capacity because doing so will end up causing more oil to be used and make the climate change problem worse.”
More than twice as many (68%) took the alternative view, that “Canada should build new pipeline capacity and use our oil resources but also invest in renewable energy and ways to reduce the amount of emissions the country produces”.
• Only in Quebec, among voters under 30, and among NDP voters, are the proportions on this question close to equal.
• Fully 69% of those who voted Liberal in October would prefer to see pipelines built along with parallel efforts to reduce emissions.
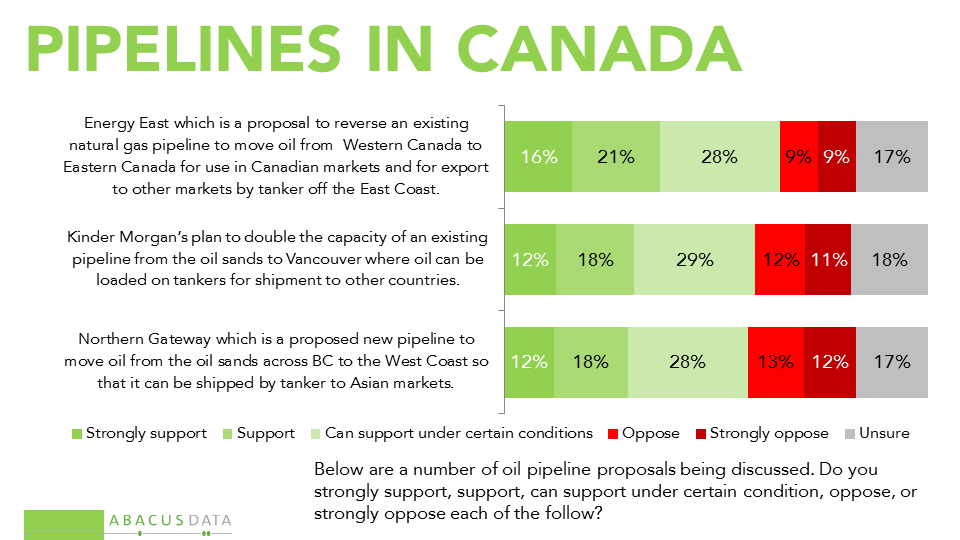
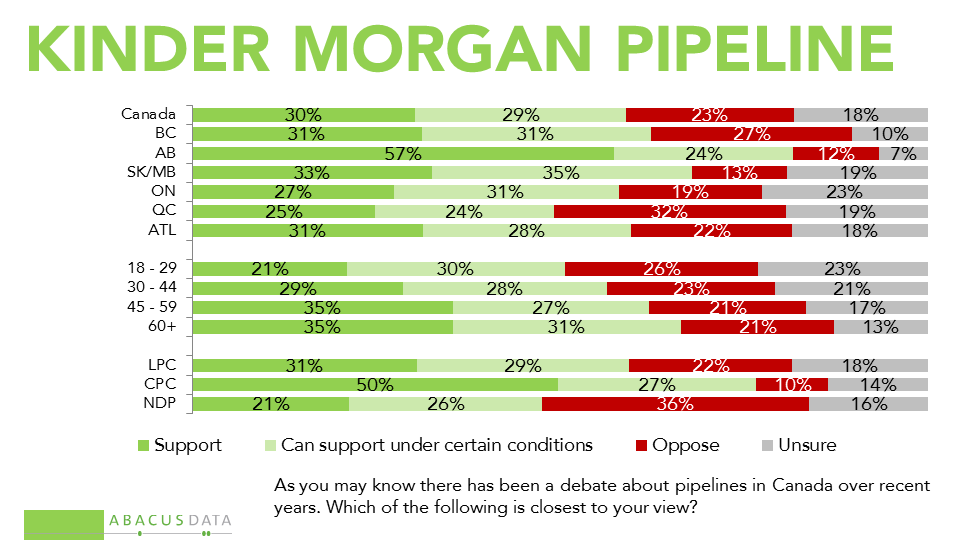
• 30% say they support the proposed Kinder Morgan Trans Mountain project, another 29% say they can support it under certain circumstances, while 23% are outright opposed. 18% are unsure. In BC the numbers are 31% support, 31% can support, and 27% oppose.
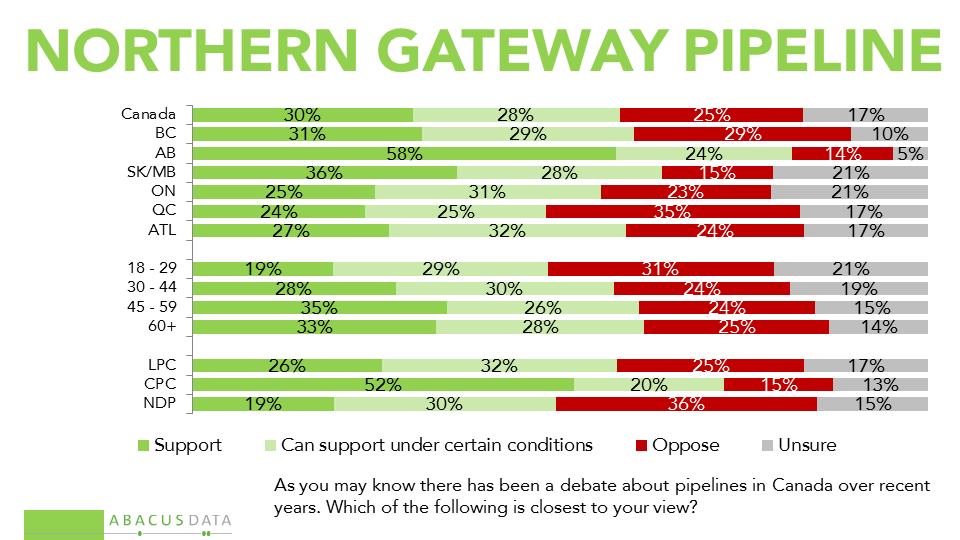
• 30% support the Northern Gateway proposal of Enbridge, 28% can support it, and 25% oppose this proposal. 17% are unsure. In BC, the numbers are 31% support, 29% can support, and 29% oppose.
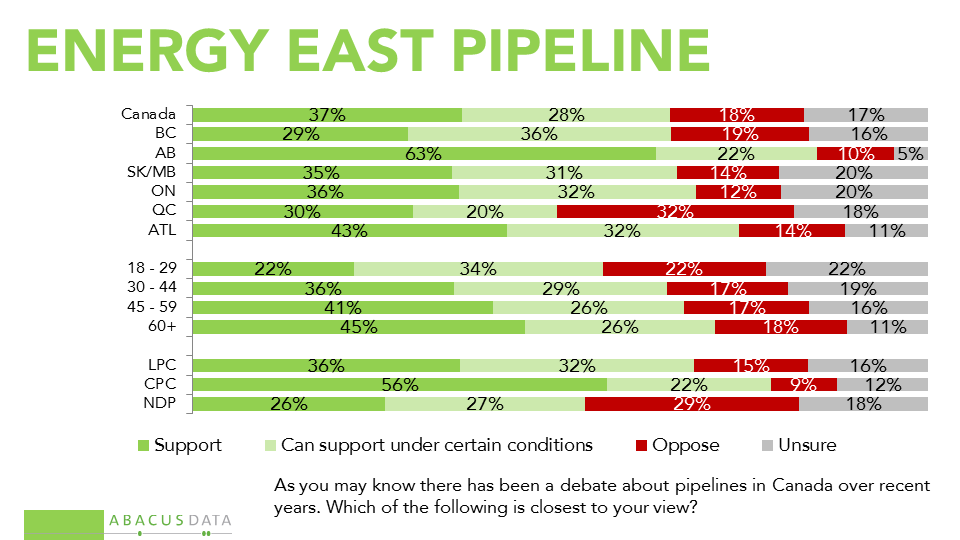
• 37% support TransCanada’s Energy East proposal 28% can support it, and 18% oppose the proposal. In Ontario, the numbers are 36% support, 32% can support, only 12% oppose. In Quebec, the numbers are 30% support, 20% can support, and 32% oppose. Only 15% of Liberal voters oppose this project outright.
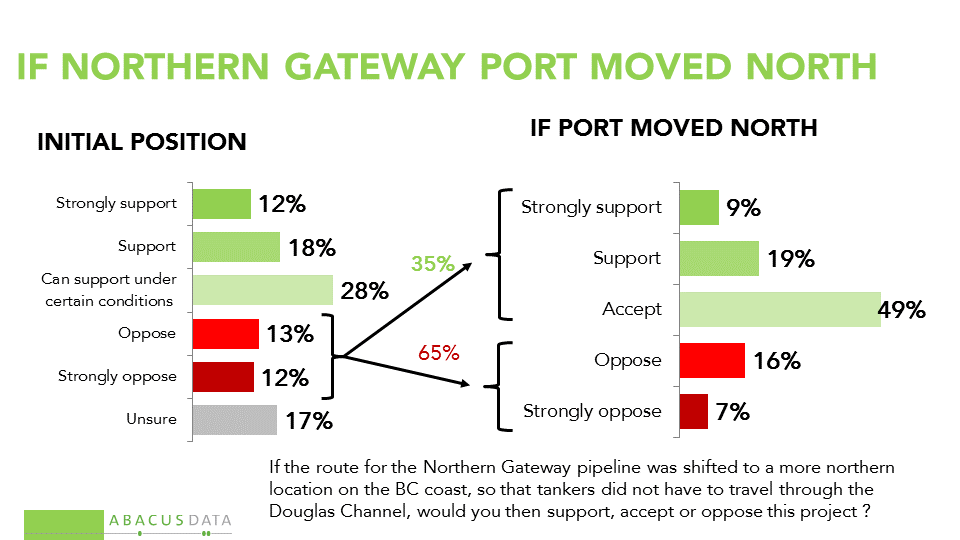
• If the Northern Gateway project was shifted to a more northern coastal endpoint so that tankers did not have to travel through the Douglas Channel, 28% say they would support the project, 49% would accept it, and 23% would oppose. In BC, the numbers would be 34% support -41% accept-26% oppose.
• Among the 25% who initially said they were against Northern Gateway, about one in three (35%) would accept the project if the project was shifted to a more northern coastal endpoint.
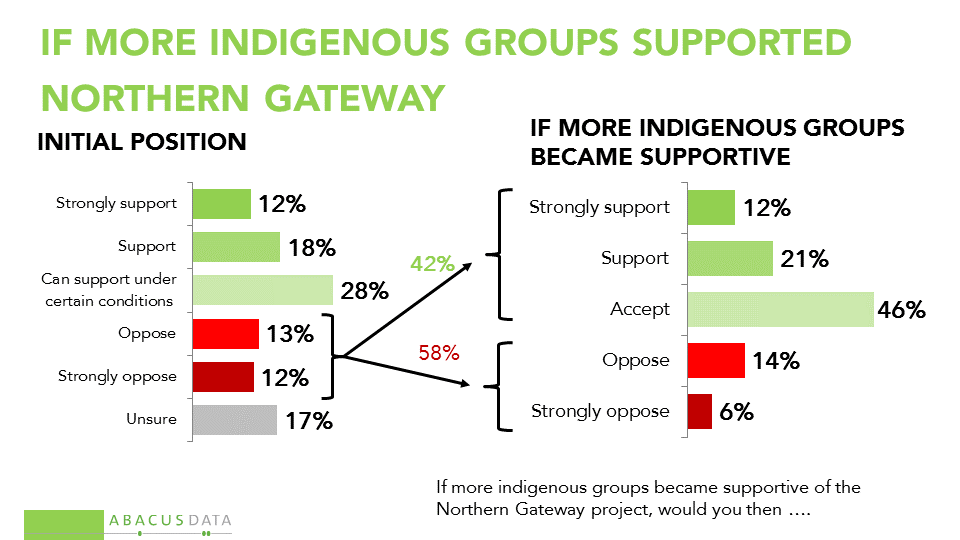
• If people saw that more indigenous groups became supportive of the Northern Gateway project, 33% would support the project, 46% could accept it, and 20% oppose. In BC, the proportions are 36%-44%-20%.
• Among the 25% who were initially opposed to Northern Gateway, 42% said they would accept the project if more indigenous groups became supportive.
Despite strenuous campaigns by some in the environmental movement, there is little public opinion pressure on the Liberal government to scrap these projects..
According to Bruce Anderson: “In a sense, social licence clearly exists. A broad cross section of voters and the large majority of Liberal voters feel uncomfortable with the anti-pipeline argument – believing instead that the best course for the country is to continue to harness the value of our oil resources, while putting increasing effort into reducing emissions and promoting other forms of energy.
This is consistent with the blend of aspiration and pragmatism which has long marked Canadian political culture. For elected officials who believe these projects have merit, the data suggests approval of these projects, alongside efforts to minimize environmental risks and increase First Nations involvement would encounter less resistance than some may suspect.”
Methodology
Our survey was conducted online with 2,000 Canadians aged 18 and over from May 17 to 20, 2016. A random sample of panelists was invited to complete the survey from a large representative panel of over 500,000 Canadians.
The Marketing Research and Intelligence Association policy limits statements about margins of sampling error for most online surveys.
The margin of error for a comparable probability-based random sample of 2,000 is +/- 2.2%, 19 times out of 20.
The data were weighted according to census data to ensure that the sample matched Canada’s population according to age, gender, educational attainment, and region. Totals may not add up to 100 due to rounding.
Abacus Data Inc.
We offer global research capacity with a strong focus on customer service, attention to detail and value added insight. Our team combines the experience of our Chairman Bruce Anderson, one of Canada’s leading research executives for two decades, with the energy, creativity and research expertise of CEO David Coletto, PhD.
For more information, visit our website at http://www.abacusdata.ca/


