The Happiness Monitor- Happiness & Mental Health
December 8, 2020
At first glance, a question about someone’s level of happiness may appear superficial. But our perceived level of happiness is tied to all sorts of aspects of our lives- including our mental health. In fact, one of my first questions when starting the Happiness Monitor was what our happiness says about our mental health and the ability to access services and supports to keep us healthy.
So we asked people to tell us about their mental health. Unsurprisingly, how we self-asses the state of our happiness, is very much tied to how we assess the state of our mental health. In fact, they almost align perfectly.
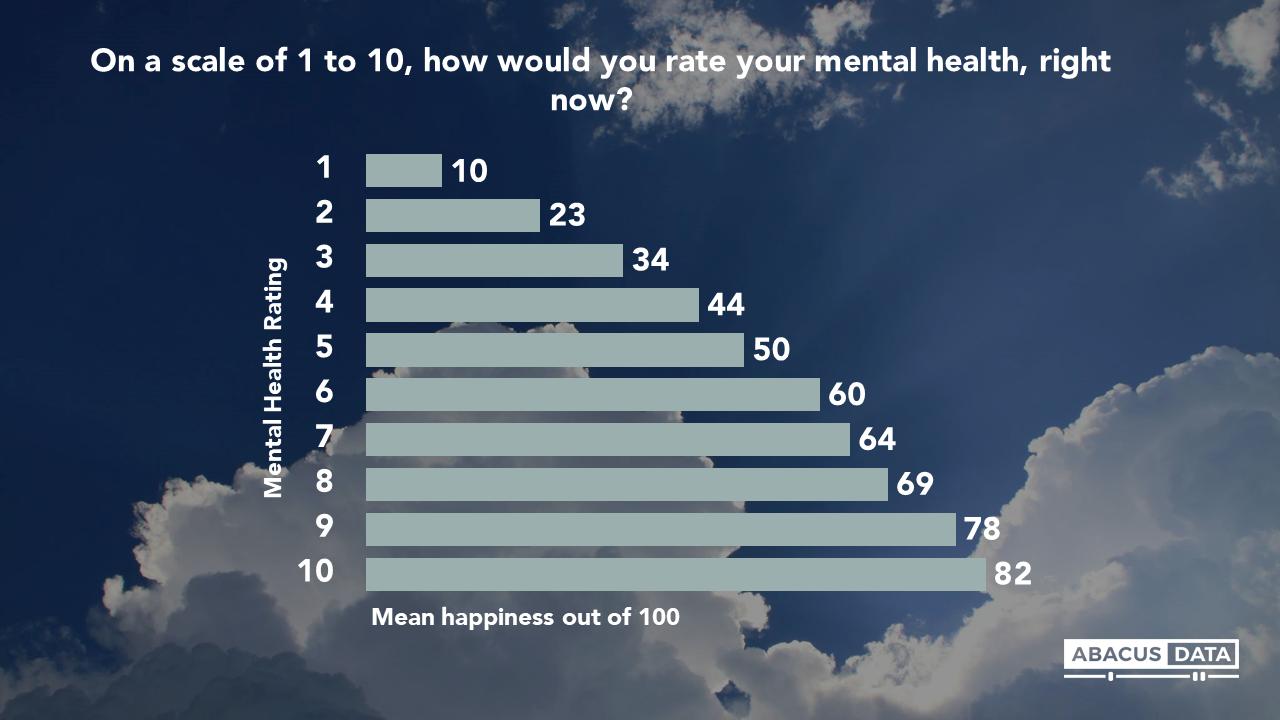
So, what does this mean about the state of mental health of Canadians? We often talk about mental health as if it was just one part of who we are. But the strong relationship with happiness belies this. Mental health is core to us. If it dictates our level of happiness, that means that it also has big consequences for everything from our productivity, big life decisions, consumer behavior, and even civic engagement. Considering that our average happiness score is still sitting just above 60 out of 100, it is worth thinking about how Canadians are dealing with their mental health and the role that happiness plays.
First, half of us say our struggles with mental health are interfering with our lives. Happiness aside, this is a rather startling finding. Sure, the pandemic has created additional insurmountable pressures on the lives of nearly all Canadians- but for half of us, this pressure is having real tangible impacts on our day to day lives.
Young Canadians (who are on average less happy than older Canadians) are much more likely to say their lives have been negatively impacted by mental health struggles. In fact, those 18-29 are more than twice as likely to say they are impacted all or some of the time by mental health, compared to those 60+. And the correlation between mental health and happiness is just as strong among those 18-29 as it is for those 60+. This means, it isn’t just older Canadians willing to acknowledge their mental health challenges, rather it may signal to the unique challenges young Canadians face with their mental health, that subsequently has a negative impact on their ability to cope with challenging situations.
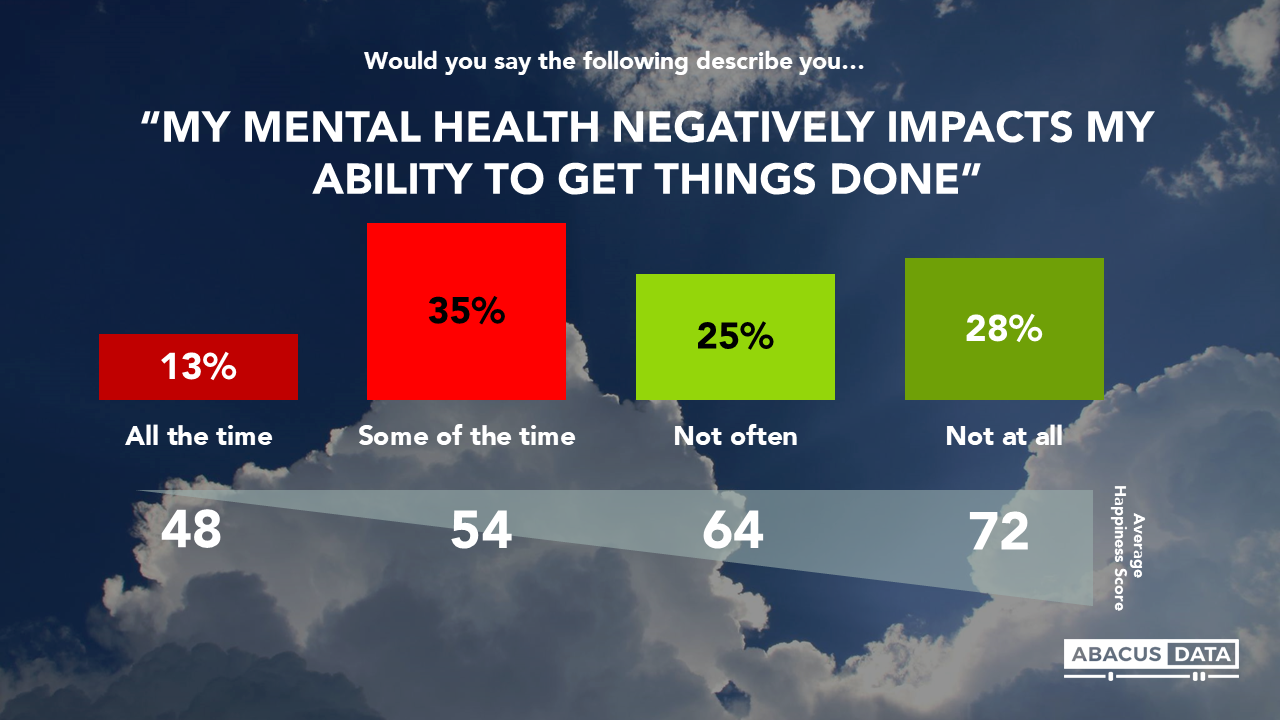
There is also a relationship between happiness and the negative impact mental health struggles have on one’s life. There is a very significant difference between the happiness scores of those who face negative mental health impacts all the time (48 out of 100), and those who do not face them at all (72 out of 100). Those who feel fewer negative mental health impacts, are happier.
And conversely, unhappy people are more likely to see that they get less done because of how they feel. 84% of unhappy people (those who rate their happiness at a between 0-20 out of 100) say this is something they struggle with all/some of the time. This is compared to the just 29% of those who are very happy (rate their happiness an 80 or higher).
The good news is that most of us are able to navigate those situations. 79% say that we can easily navigate these stressful or anxious situations, at least some of the time. Still, this means that 1 in 5 are not able to navigate these situations on their own.

People who are better able to manage a stressful situation are happier. Among those who say they can navigate these situations all the time, they rate their average happiness at a 72. And those who say they can’t navigate these situations at all rate their happiness as a 54.
The same inverse relationship applies here too. Happy people are also able to better manage a stressful or anxious situation. 86% of very happy people (80 or higher) say they can easily navigate these situations at least some of the time. Among unhappy people (a 20 or less), this drops to 61%.
Access to support services for mental health is key for our mental health, and subsequently our happiness. Those who have good access to these services are much happier than those who do not have access to services. The inverse relationship is also present here too. Very happy people are twice as likely to have access to supports for mental health, compared to unhappy people.
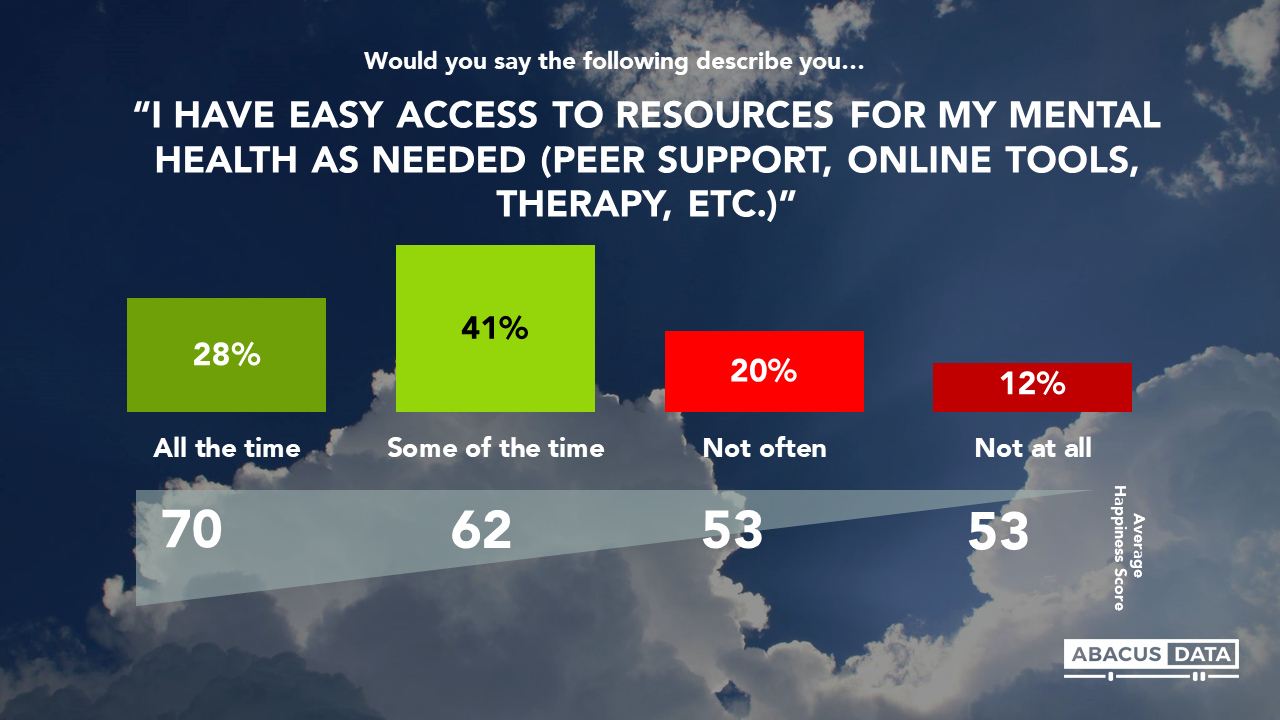
That said, only a third of Canadians say they have easy access to resources for mental health all of the time. For these Canadians, their average happiness score is 70, well above the national average. And on the other end of the scale, those who don’t have access to these services at all have an average happiness score of 53, well below the national average.
And this applies across demographics. Canadians who are less happy (younger, live in Quebec, lower income and less education) also struggle the most with accessing these services.
So, what does this all mean?
A moderate happiness score of Canadians overall means that there can be definite improvements to the mental health services in this country. If happiness is tied to our ability to access services to improve our mental health, then a moderate score of happiness at 61 out of 100 means that we could be doing a better job of helping Canadians access the services they need.
A decline in the average happiness scores should be a warning sign about the mental health of Canadians. Lower happiness scores indicate that we are struggling with events that have a real impact on our mental health, and they also indicate that we might be struggling with how to navigate these situations on our own or access services and supports. Accessing services and having the mental health capacity to work through situations of stress an anxiety are linked to happiness is a bit of a self-fulfilling prophecy. Access to services brings about greater happiness, but only those with greater happiness have good access to these services. This link that we identified is helpful- but it also highlights that there is still work to be done. Lower happiness scores among certain demographics can highlight those who need better access to mental health services the most.
If mental health is intrinsically linked to our happiness, then we need to start paying a lot more attention to the mental health of Canadians. We often think of mental health as one aspect of our health and our lives, but it’s relationship with happiness suggests that its influence is much greater. Lower happiness scores (which in turn signal lower levels of mental health) has all sorts of consequences like lower levels of civic engagement, and lower rates of workforce participation. Health aside, these are some pretty serious consequences.
To subscribe to updates and releases on the Happiness Monitor, click here.
ABOUT ABACUS DATA
We are the only research and strategy firm that helps organizations respond to the disruptive risks and opportunities in a world where demographics and technology are changing more quickly than ever.
Find out more about what we are doing to help clients respond to the COVID-19 pandemic.
We are an innovative, fast-growing public opinion and marketing research consultancy. We use the latest technology, sound science, and deep experience to generate top-flight research-based advice to our clients. We offer global research capacity with a strong focus on customer service, attention to detail and exceptional value.
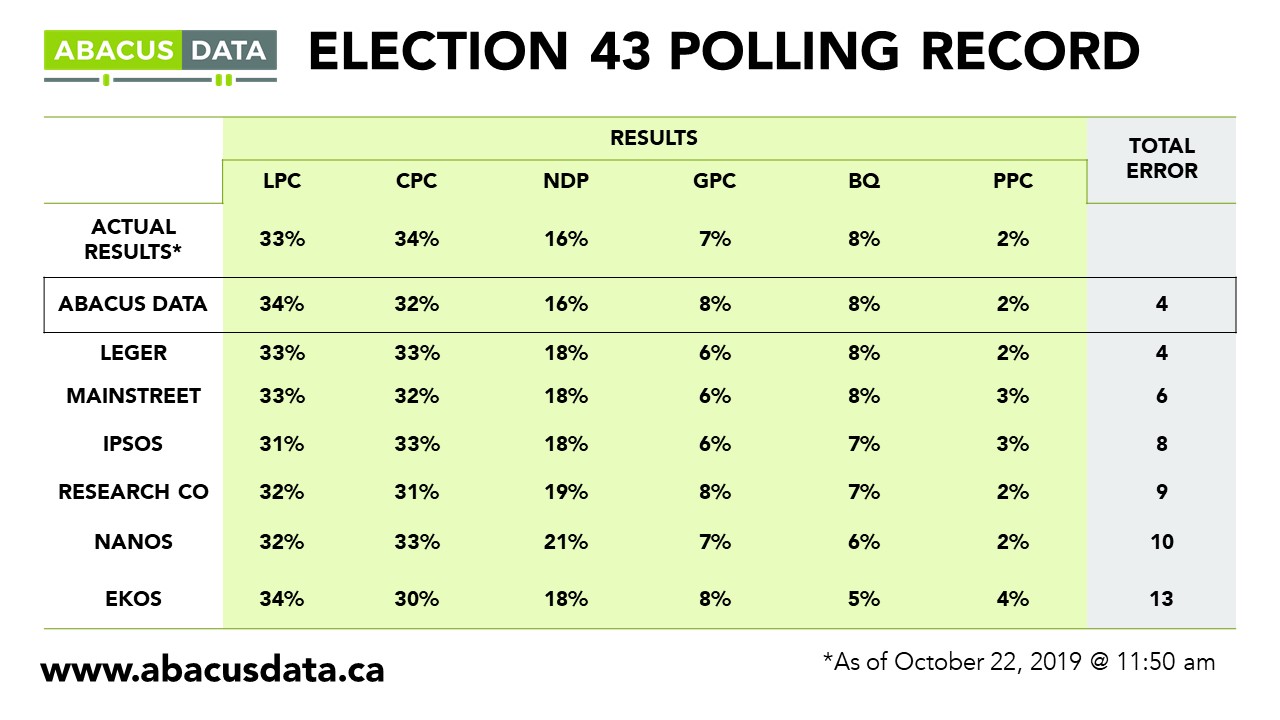
We were one of the most accurate pollsters conducting research during the 2019 Canadian Election.
Contact us with any questions.
Find out more about how we can help your organization by downloading our corporate profile and service offering.
METHODOLOGY
The survey was conducted with 1,500 Canadian residents from November 13 to 18, 2020. A random sample of panelists were invited to complete the survey from a set of partner panels based on the Lucid exchange platform. These partners are typically double opt-in survey panels, blended to manage out potential skews in the data from a single source.
The margin of error for a comparable probability-based random sample of the same size is +/- 2.51%, 19 times out of 20.
The data were weighted according to census data to ensure that the sample matched Canada’s population according to age, gender, educational attainment, and region. Totals may not add up to 100 due to rounding.