Do you love oil? Hate oil? Either way, you’re in the minority.
October 2, 2018
In our most recent national public opinion survey, we explored one of the most contentious topics in Canadian politics – oil – and found most people don’t find it all that contentious.
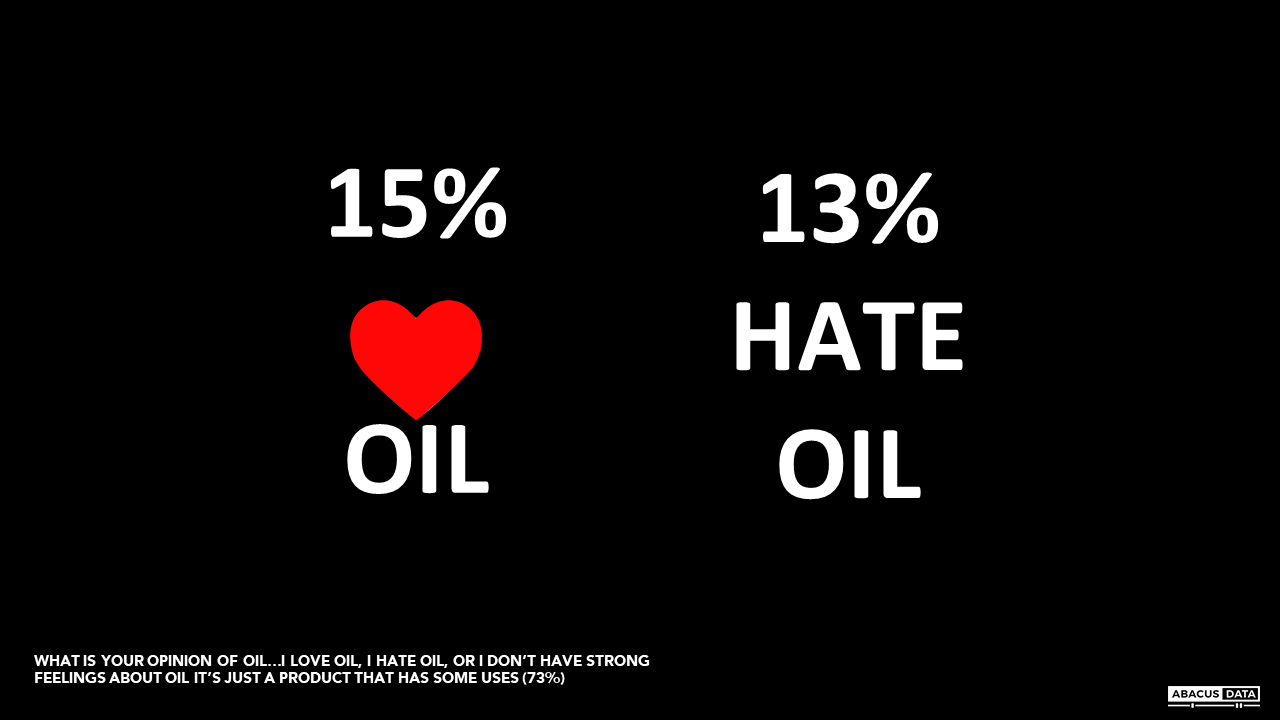
When asked if they loved oil, hated oil, or “don’t have strong feelings about oil, it’s just a product that has some uses”, 73% chose the latter option to describe their view.
No strong feelings about oil is the view of 72% in BC, 76% in Ontario, and 74% in Quebec. A remarkably consistent 73% of NDP, Conservative, and Liberal voters say they have no strong feelings about oil.
Roughly equal, and small, numbers of Canadians love (15%) and hate (13%) oil. Only 21% of NDP voters hate oil, and only 21% of Conservative voters love oil. 37% of Albertans love oil.
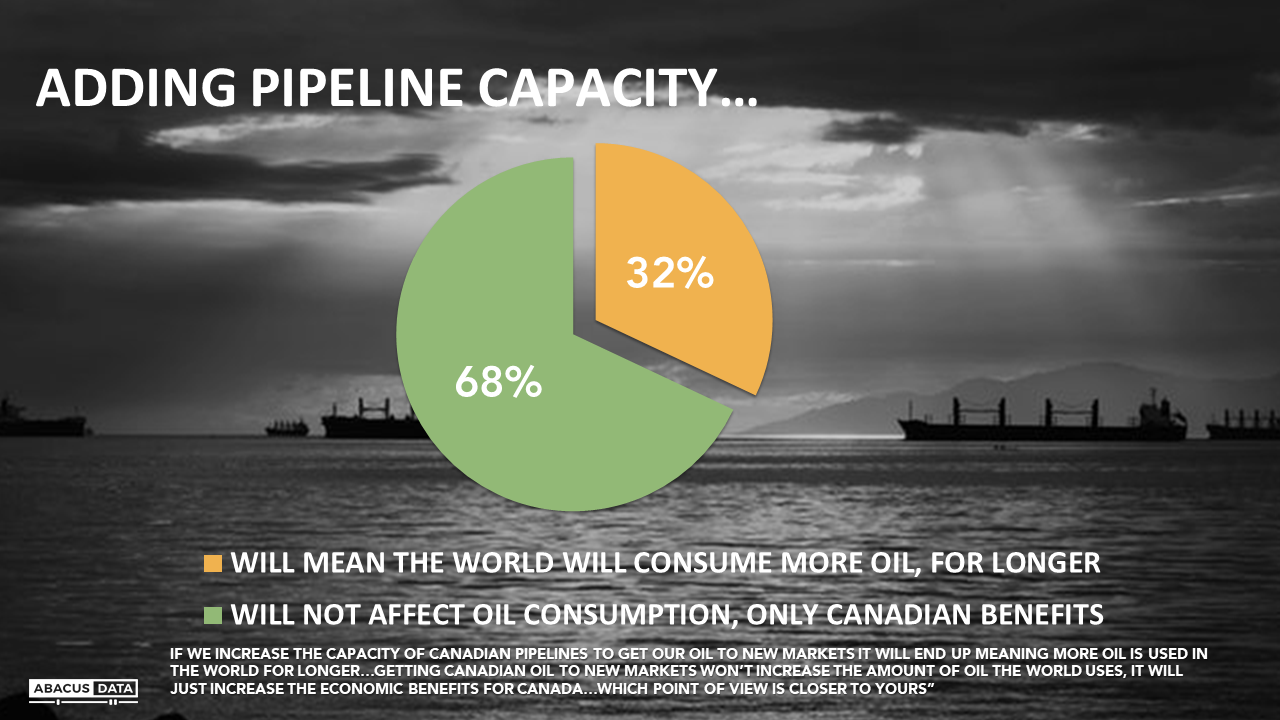
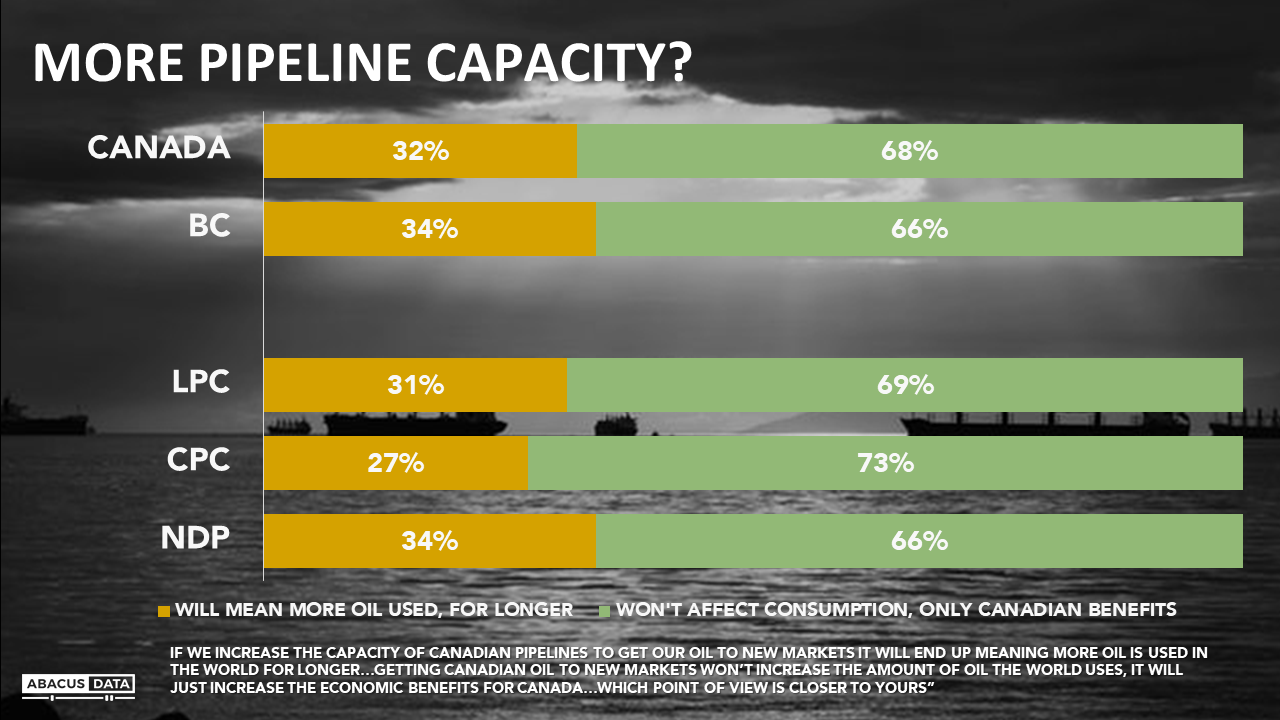
Most Canadians reject the argument that increasing the capacity of pipelines to get our oil to new markets will end up meaning more oil will be used in the world for longer. The majority (68%) believes that expanding our access to new markets won’t affect global oil consumption but will increase the economic benefits for Canadians.
This is the majority view of 69% of Liberal voters, 66% of NDP voters and 73% of Conservative voters.
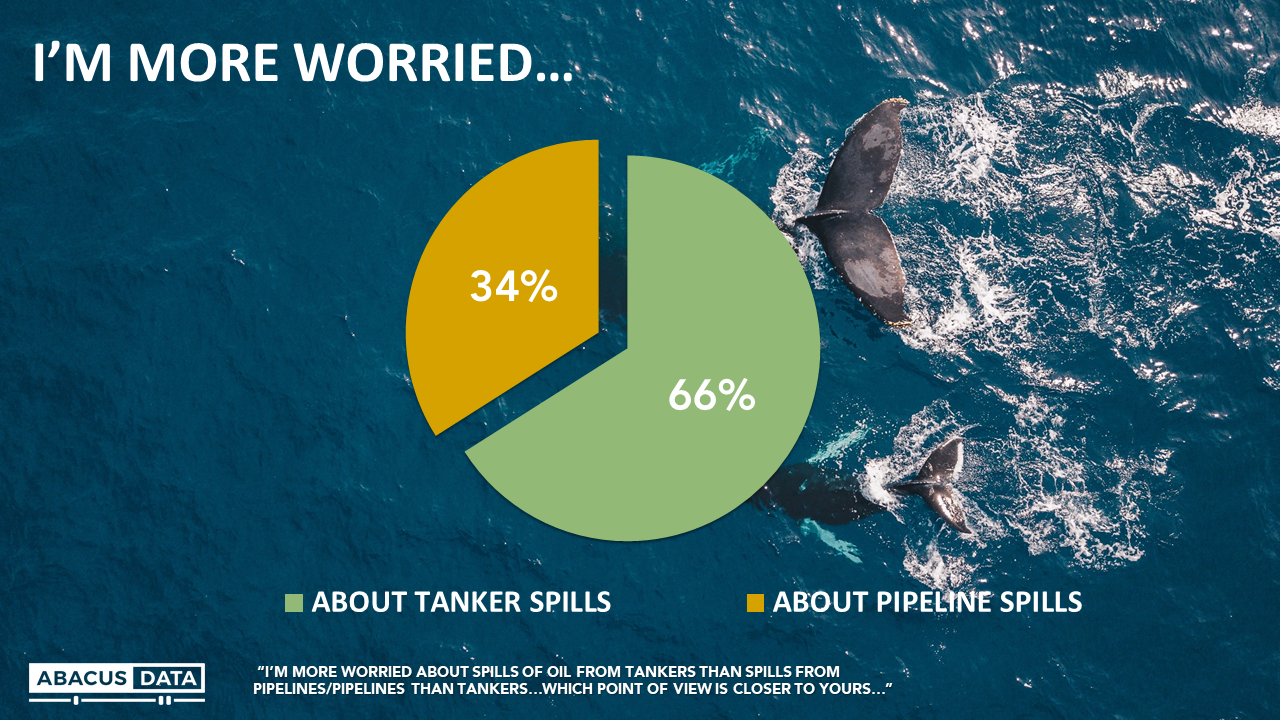
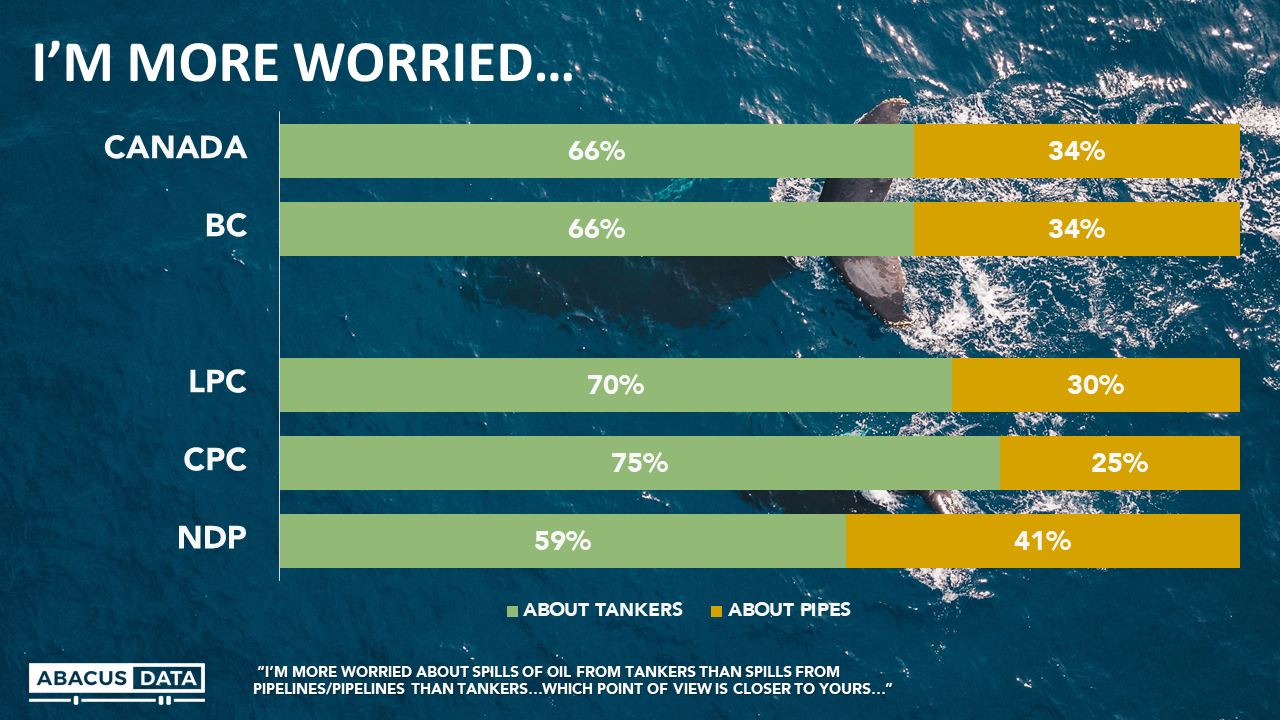
Two out of three (67%) Canadians think pipelines are generally pretty safe, and worries tend to be more about the risk of spills from tankers (66%) than from pipelines (34%)
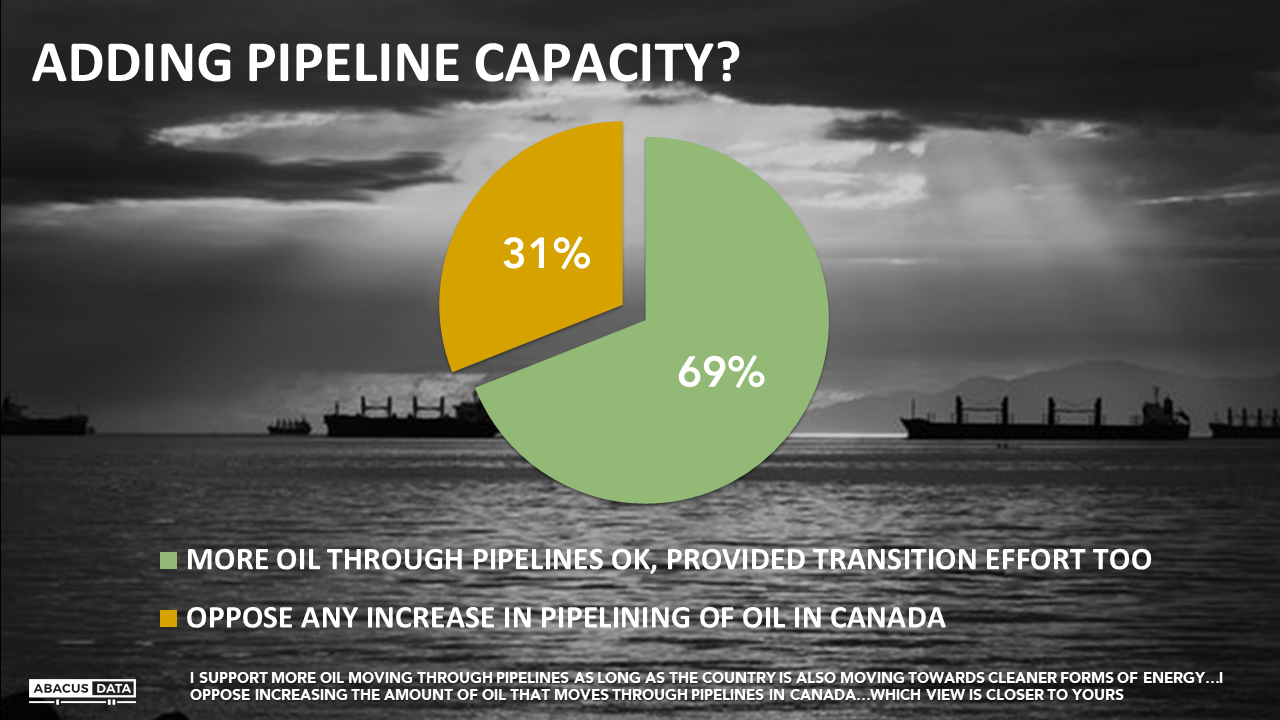
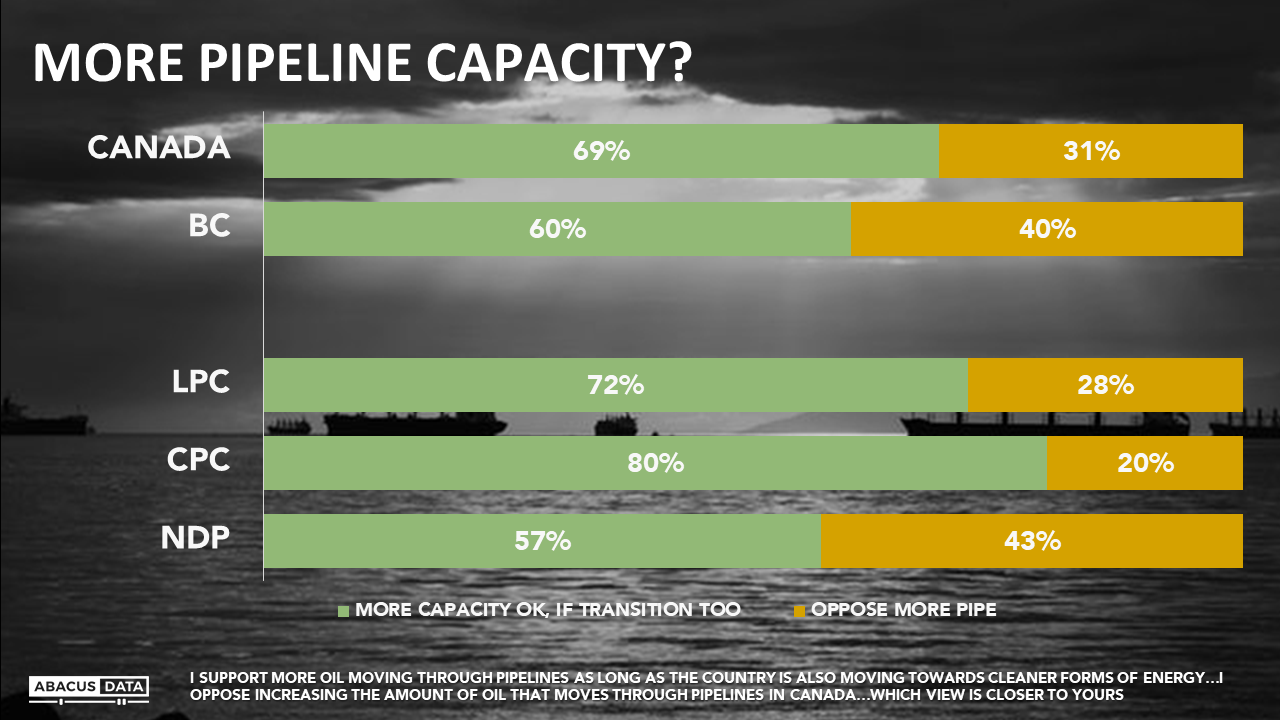
Most (69%) Canadians “support more oil moving through pipelines as long as the country is also moving towards cleaner forms of energy” while only 31% oppose increasing the amount of oil that moves through pipelines in Canada. Large majorities of Liberal (72%) and Conservative (80%) voters are aligned on this question, while NDP voters are split with 57% saying they support the transition idea and 43% opposed to any increase in pipelining of oil.
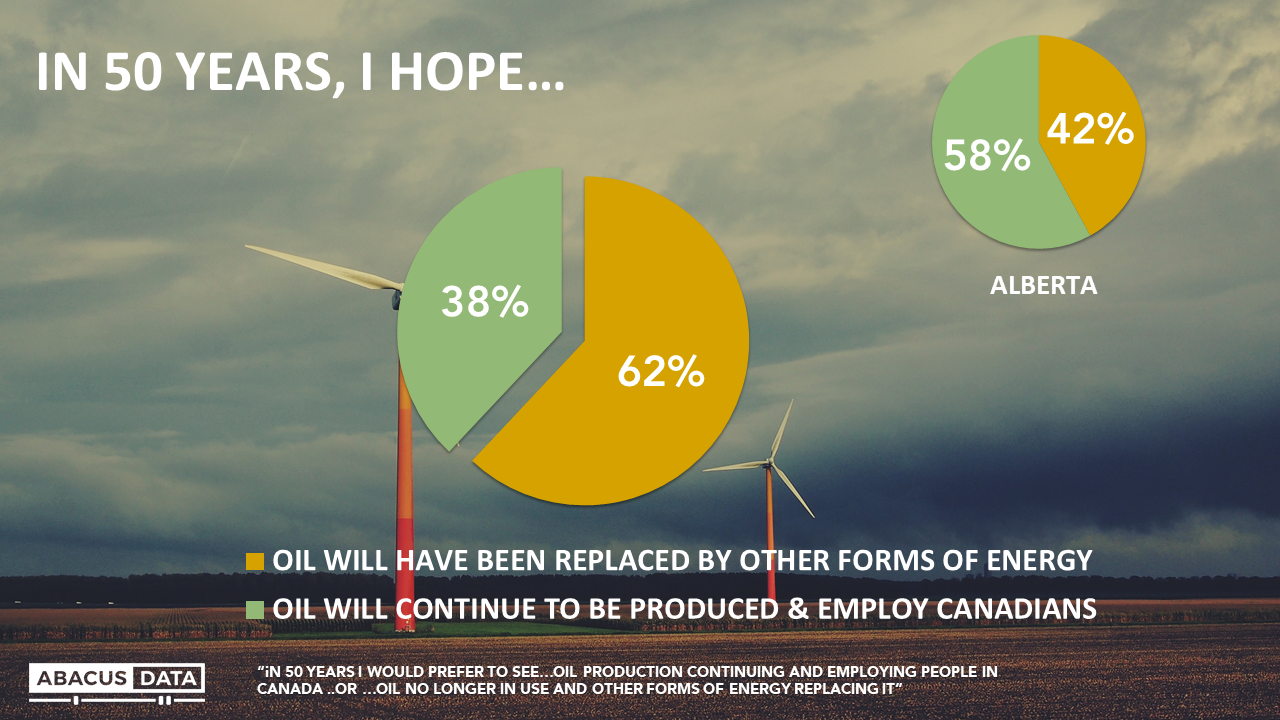
Looking into the future, when asked what they hope will be the case in 50 years time, 62% of Canadians (including 42% in Alberta, and 47% of Conservative voters) say they would prefer it if “oil was no longer in use and other forms of energy was replacing it”, while 38% would prefer to see “oil production continuing and employing Canadians.”
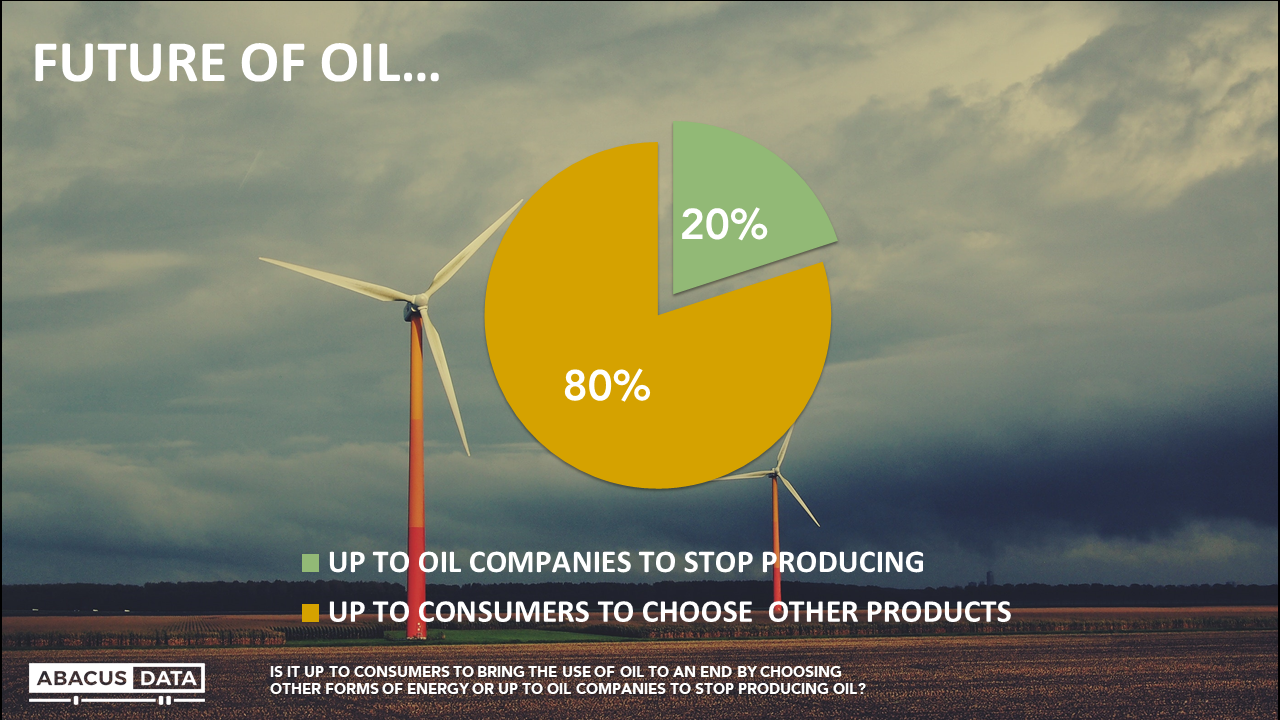
Finally, it is worth noting that by a very wide margin, Canadians believe it is up to consumers to choose different energy products rather than up to oil companies to stop producing oil if a transition is to occur.
CONCLUSIONS
For years, pro-oil advocates and anti-oil crusaders have tried to weaponize public opinion – with very little to show for these efforts. Canadians are relentlessly pragmatic – they see oil as a product with many practical uses, want to see it phased out over time, but see economic value in making sure Canada is a successful participant in the world market for oil, as long as efforts are made to shift energy use over time.
These numbers contain important signals for each of the main parties.
For the Liberals, the numbers reinforce that their supporters mostly see merit in a strategy of balance, even if some will be disappointed in the pace of change or discomfited by owning a pipeline.
For the Conservatives, the numbers warn that their base is neither homogeneously pro-oil, nor fixated on oil and pipelines.
But probably the most troublesome news is for the NDP – a party which attracts the strongest anti-oil voters but whose tent also includes many who believe in extracting economic benefits from Canadian energy and support pipeline construction. This simmering internal tension may well become even more challenging for NDP leader Jagmeet Singh over the coming year.”
Methodology
Our survey was conducted online with 2,000 Canadians aged 18 and over from September 14 to 19, 2018 2018. A random sample of panelists was invited to complete the survey from a set of partner panels based on the Lucid exchange platform. These partners are double opt-in survey panels, blended to manage out potential skews in the data from a single source.
The margin of error for a comparable probability-based random sample of the same size is +/- 2.2%, 19 times out of 20. The data were weighted according to census data to ensure that the sample matched Canada’s population according to age, gender, educational attainment, and region. Totals may not add up to 100 due to rounding.