Liberals ahead by 12 as election speculation heats up
We just completed a national survey of 2,000 Canadian adults (July 29 to Aug 2). As we head towards a likely election call in the next few weeks, here’s our latest look at the Canadian political environment.
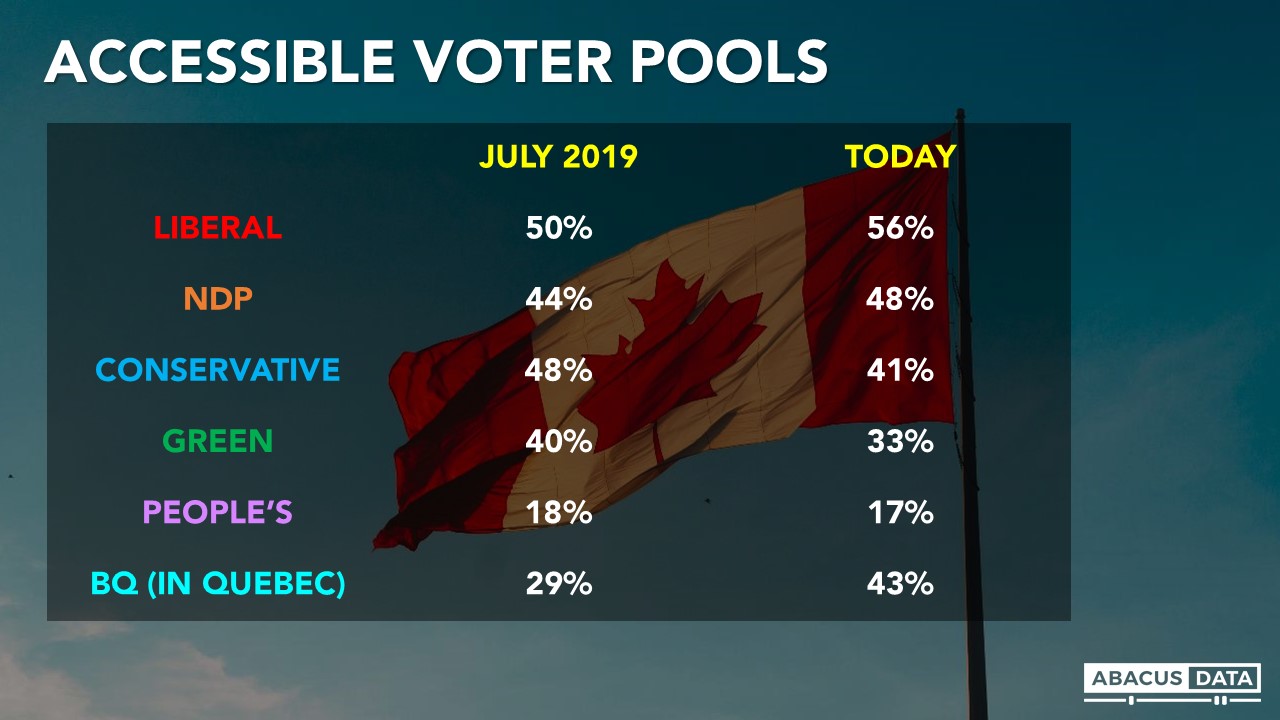
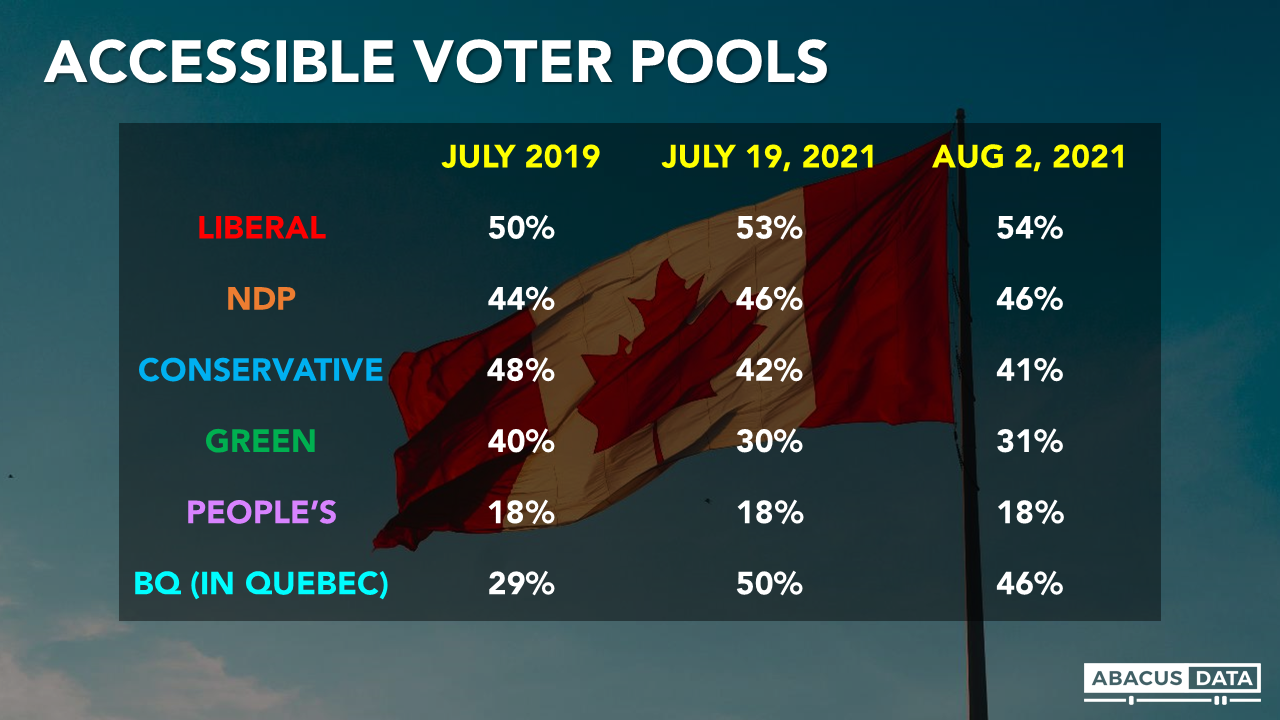
HOW BIG ARE THE PARTY VOTER POOLS?
The Liberals continue to have the largest potential voter pool with 54% saying they would consider voting Liberal. This is 8-points larger than the NDP (46%), 13-points larger than the Conservatives (41%), and 23-points larger than the Greens (31%).
Comparing today with July 2019, the Liberals have a slightly larger accessible voter pool (+4), the NDP’s is marginally larger (+2) while the Conservative pool is much smaller (-7).
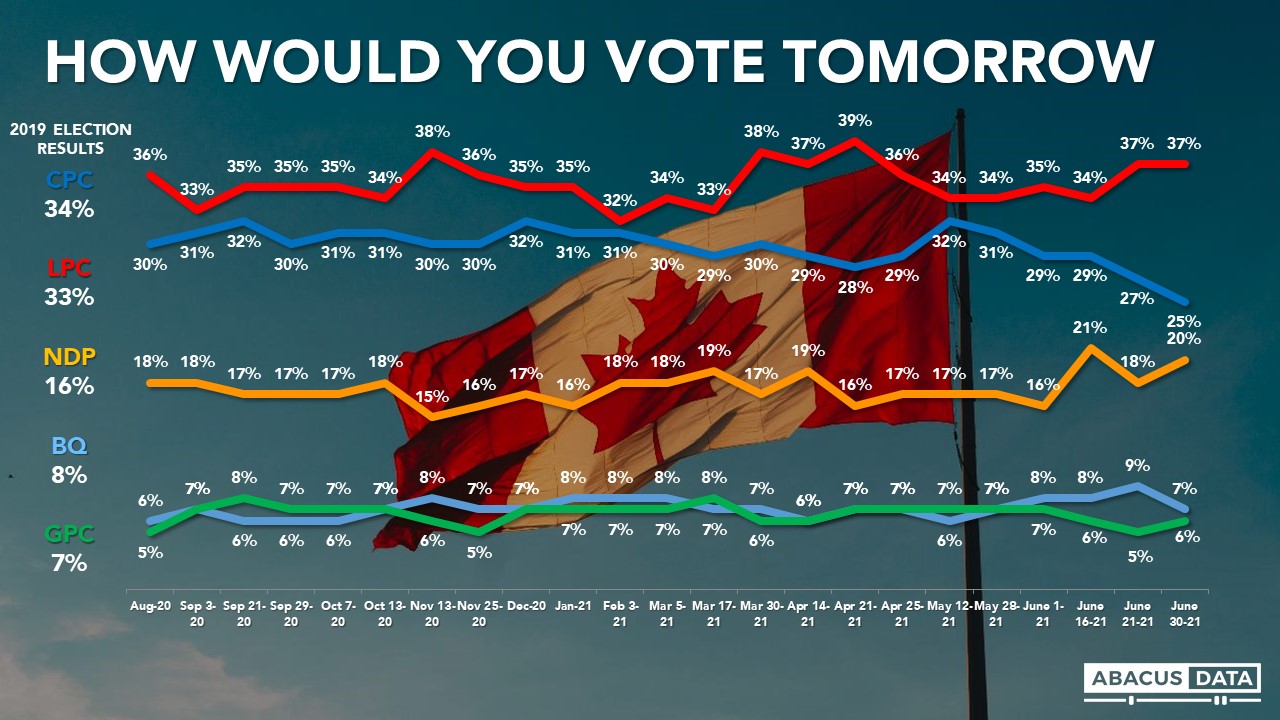
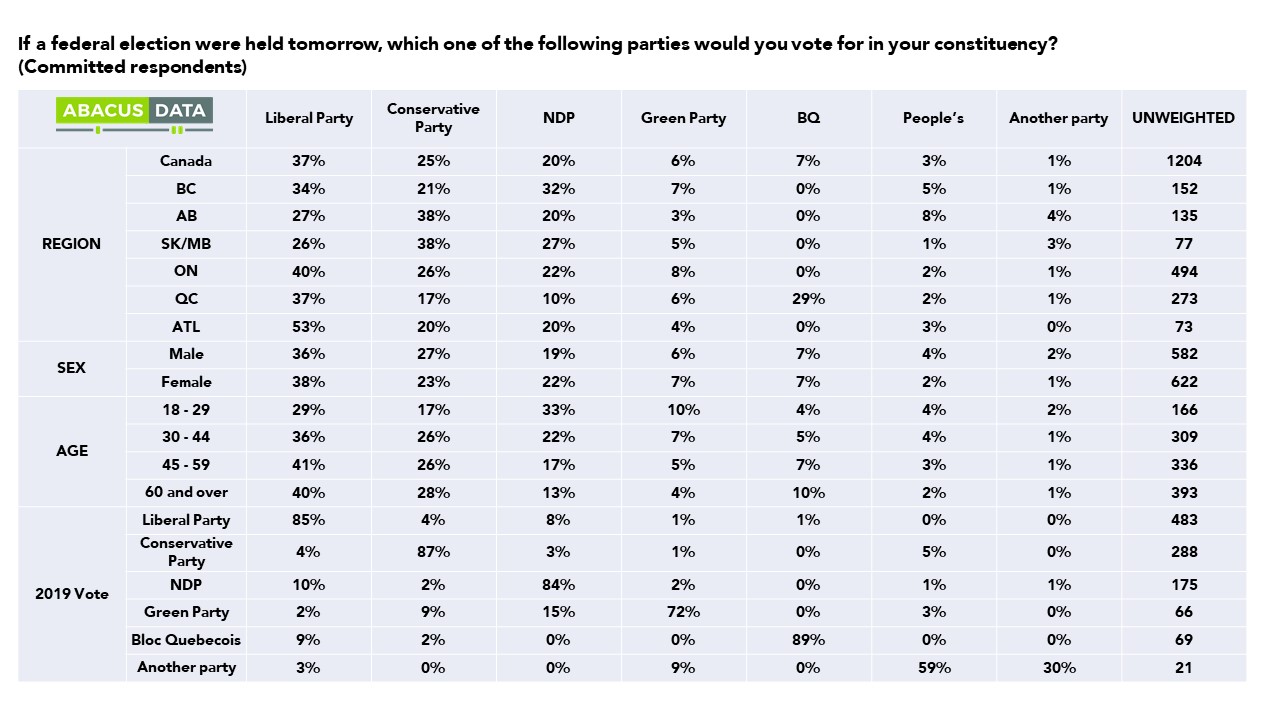
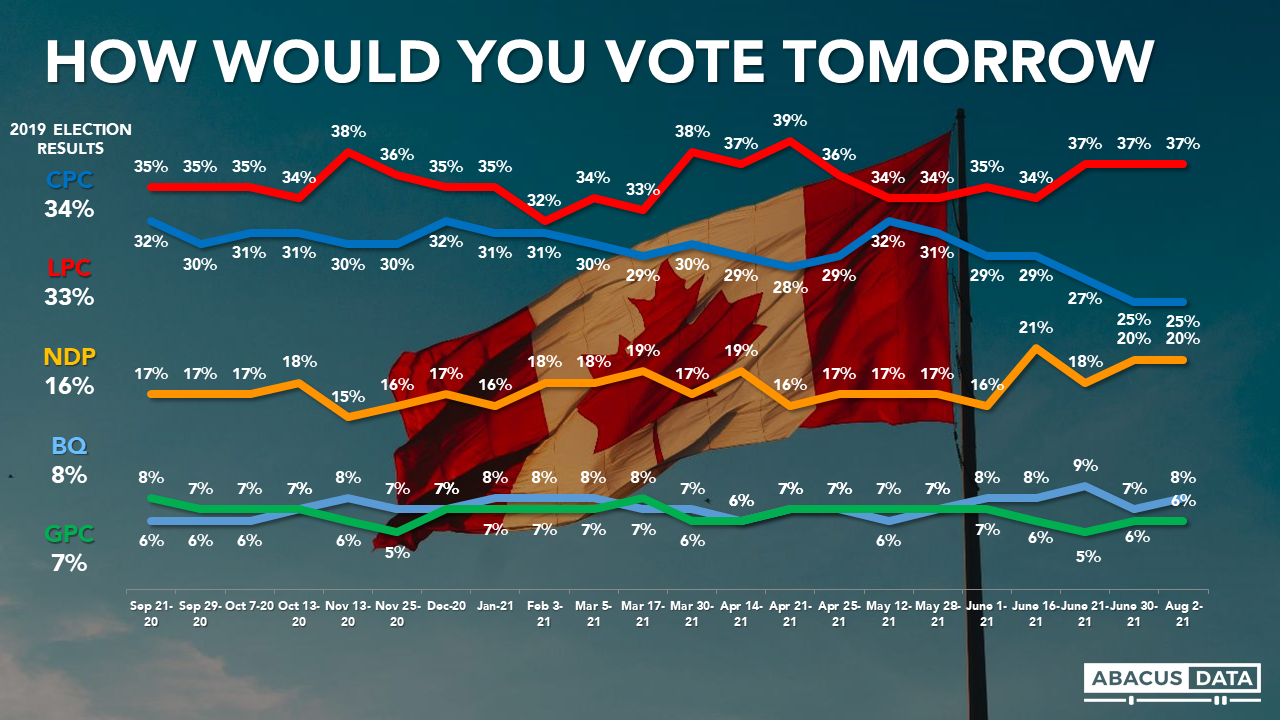
CURRENT VOTING INTENTION
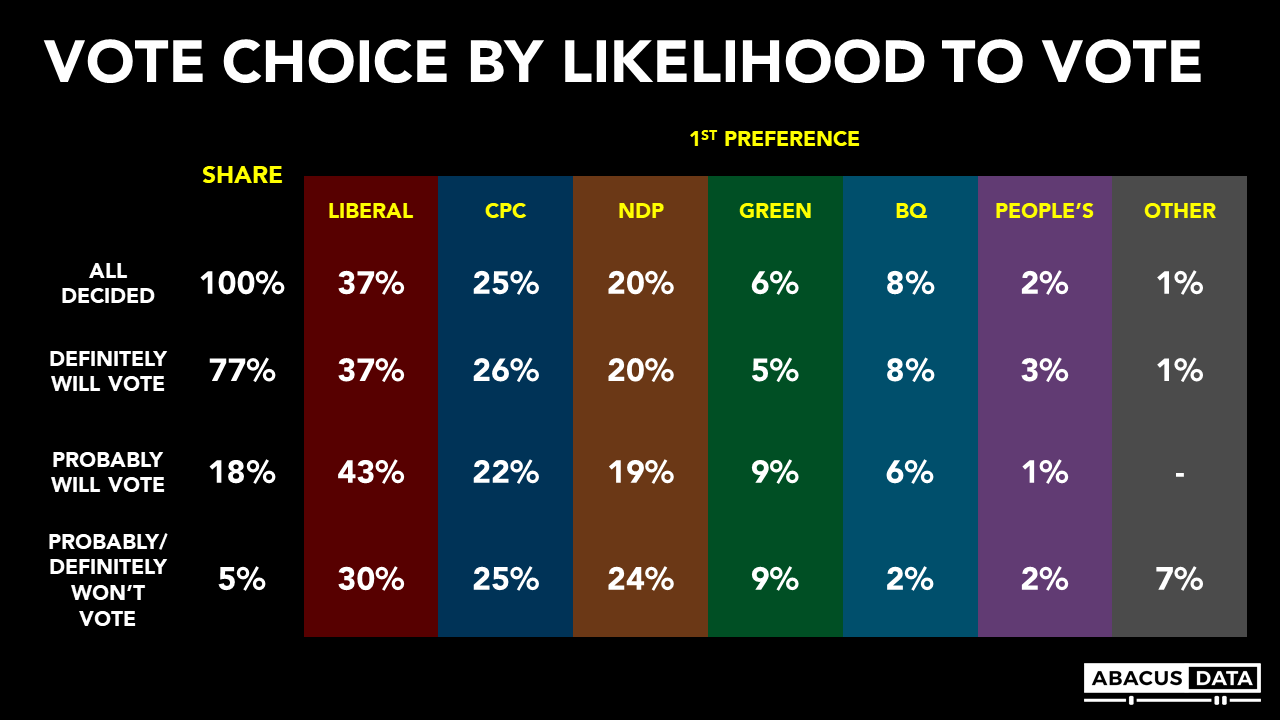
If an election were held now, the Liberals would win 37% of the vote, the Conservatives 25%, the NDP 20%, the Green Party 6% and the BQ 31% in Quebec (8 points behind the Liberals). This is pretty much the exact same vote split as we found at the end of June.
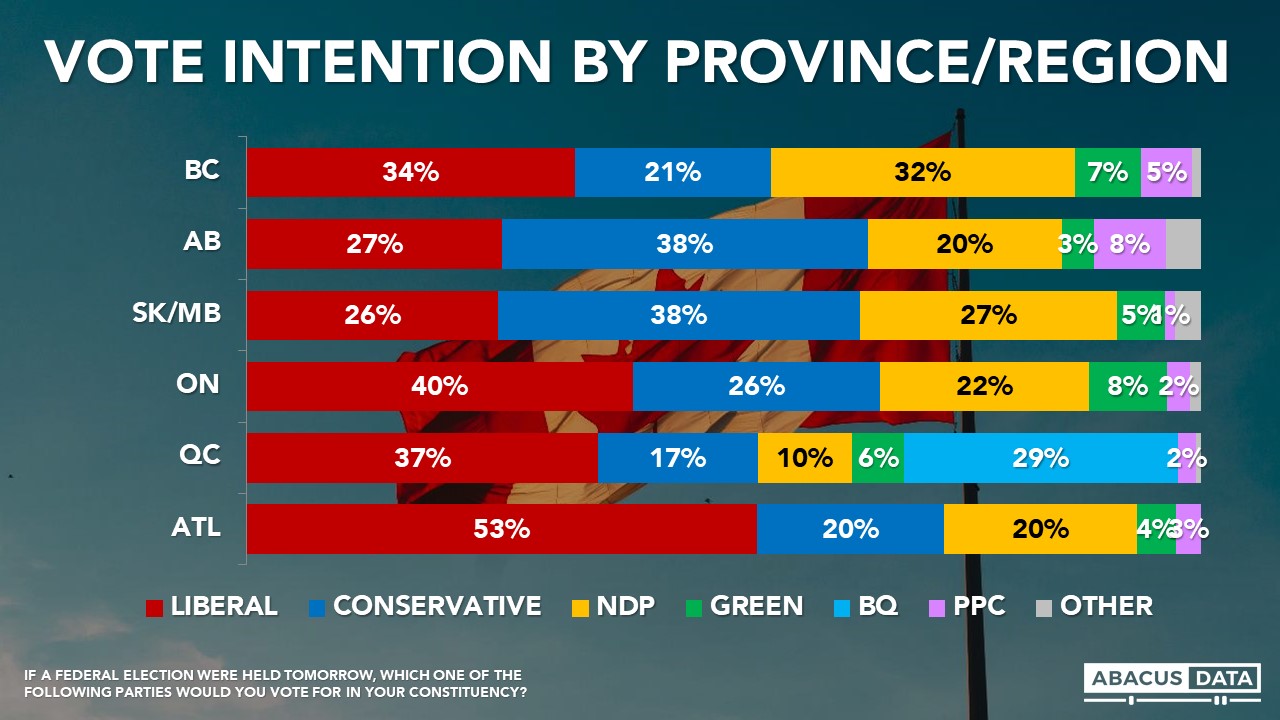
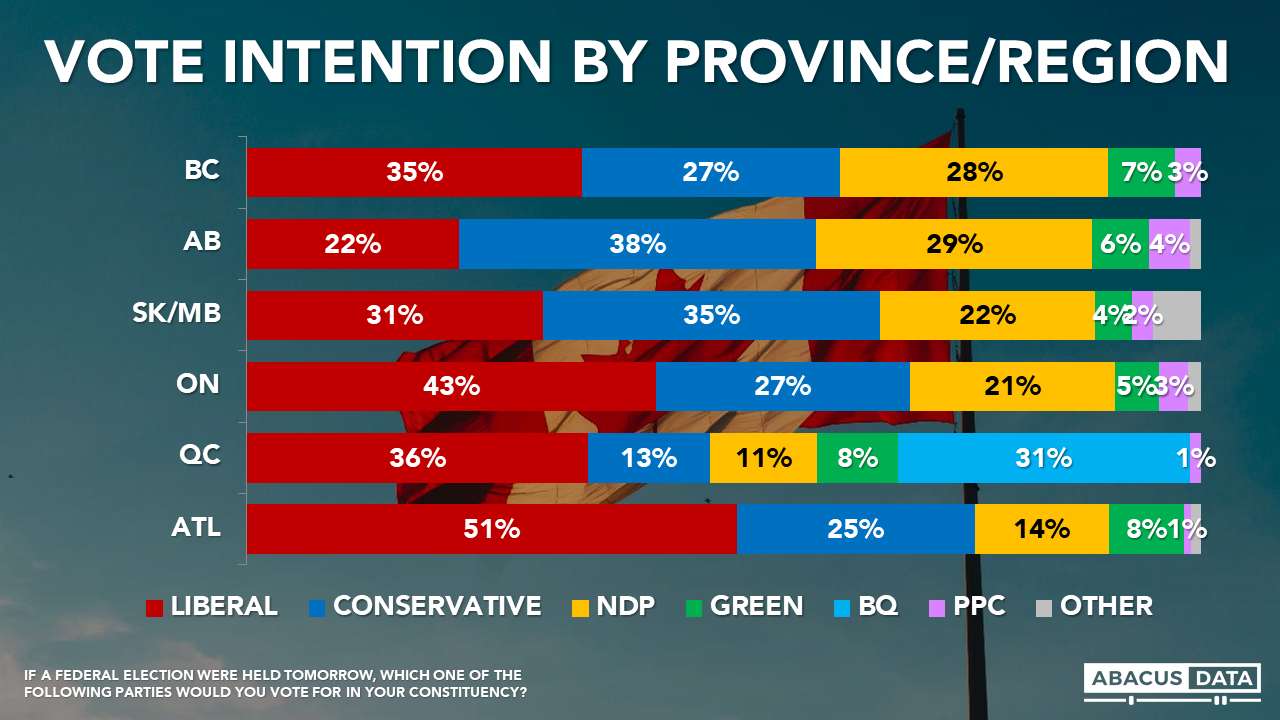
• In BC, we see the Liberals ahead of the NDP and Conservatives (35% to 28% to 27%).
• The typical wide Conservative leads in the Prairies are not there. In Alberta, 38% would vote Conservative compared with 29% for the NDP and 22% for the Liberals. In Manitoba and Saskatchewan, the Conservatives are only slightly ahead of the Liberals (35% to 31%).
• The Liberals (with 43%) have a 16-point lead over the Conservatives (27%) in Ontario, with the NDP at 21% and the Green Party at 5%.
• In Quebec, we see the Liberals with 36%, followed by the BQ (31%), the Conservatives (13%) the NDP at 11%.
• In the Atlantic provinces, the Liberals (51%) are well ahead of the Conservatives (25%) and the NDP (14%).
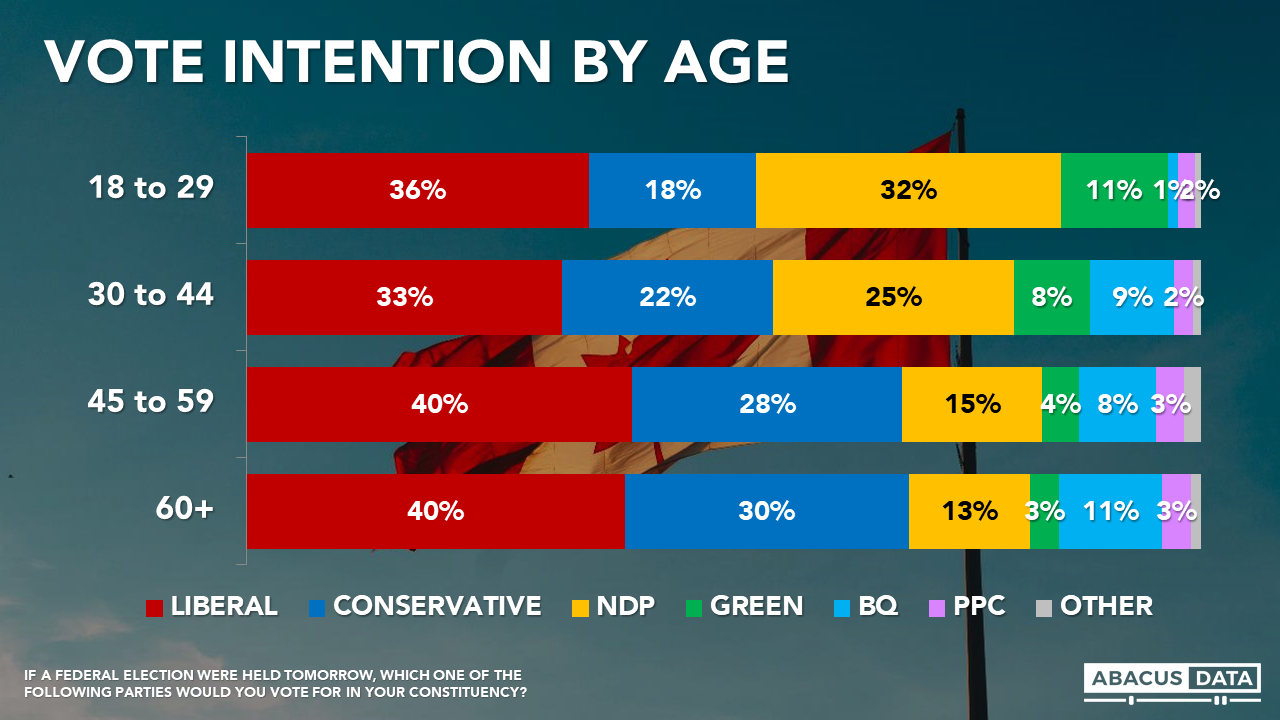
• The Liberals also lead across all age groups, although the NDP is competitive with those under 30.
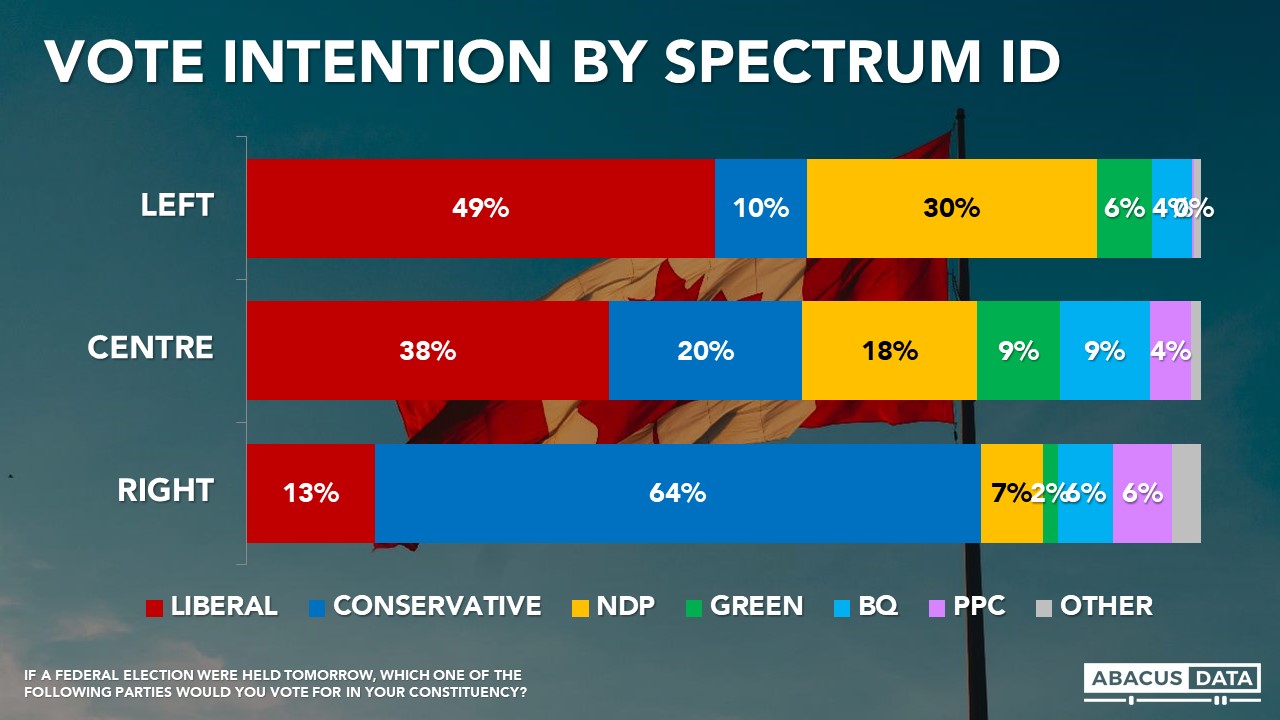
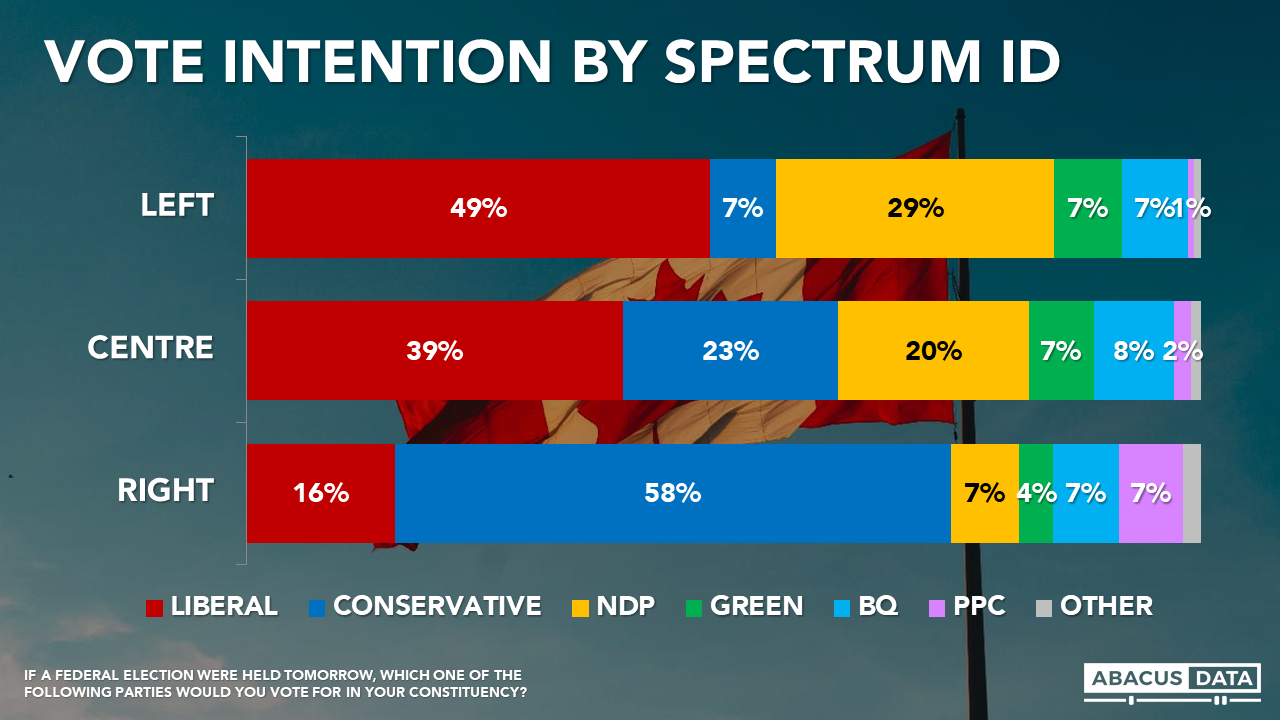
• Among self-described “left of centre” voters, the Liberals (49%) lead the NDP (29%) and the Conservatives have 7% support.
• Among self-described right of centre voters, the Conservatives have 58% support, followed by the Liberals (16%) the NDP (7%) the Peoples Party (7%) the BQ (7%) and Green Party (4%).
• Among those who say they are on the centre of the spectrum, the Liberals lead with 39% compared to 23% for the Conservatives, 20% for the NDP, and 7% for the Greens.
We are also resuming testing levels of motivation, by asking people how likely they are to turn out and cast a ballot on election day. Among the 77% of respondents who said they would definitely be voting, the Liberals lead by 11: Liberal, 26% Conservative, 20% NDP, 8% BQ and 5% Green. 3% would vote for the People’s Party.
SECOND CHOICE PREFERENCES
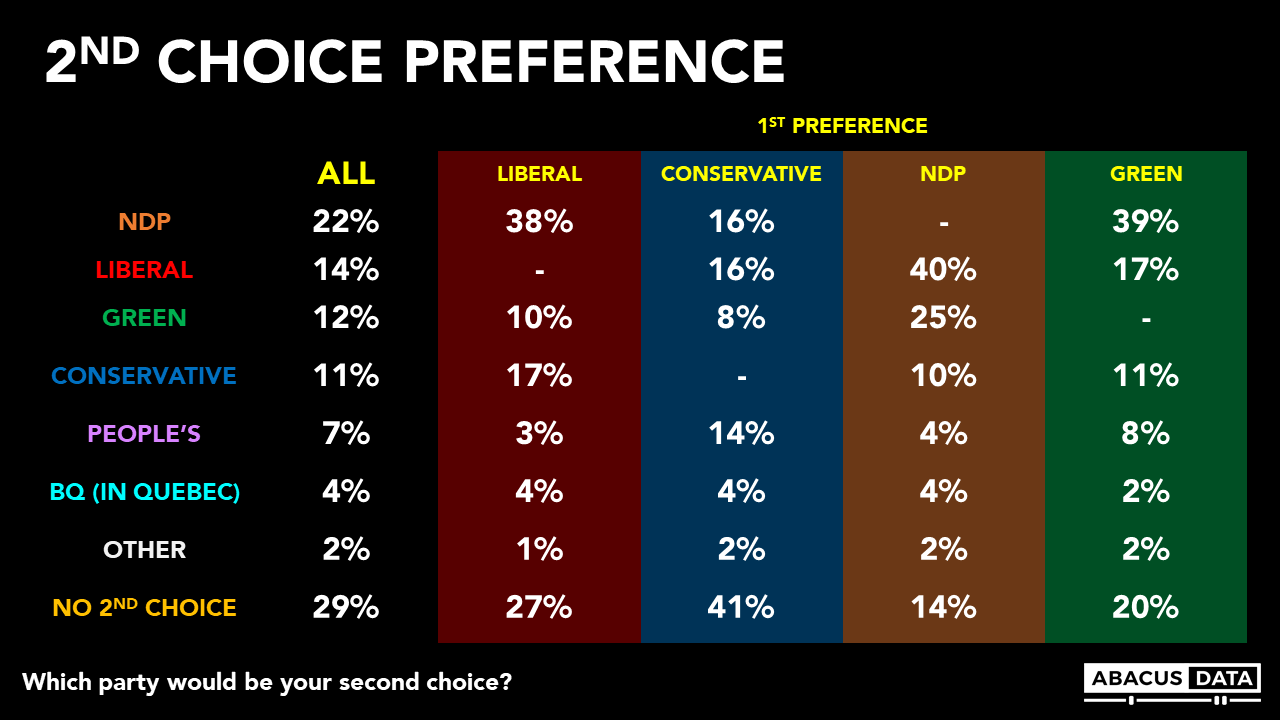
We asked decided respondents which party was their second choice. Overall, 29% of respondents said they do not have a second choice ranging from a high of 41% among Conservative supporters to a low of 14% among NDP supporters.
The NDP has the most room to grow with 22% of respondents saying their second choice was the NDP – 38% among Liberal supporters, 39% among Green supporters, and 16% among Conservative supporters.
14% selected the Liberals as their second choice – 40% among NDP supporters, 17% among Green supporters, and 16% among Conservative supporters.
The Conservative Party has the 4th largest pool of second-choice support at 11%, behind the Greens. 17% of Liberal supporters say the Conservatives are their second choice as do 10% of NDP supporters and 11% of Green supporters.
We also asked to what extent decided respondents are likely to switch their support. Overall, we don’t find a lot of potential switching. Only 4% said they are very likely to switch while another 23% are somewhat likely.
The size of persuadable pools is fairly consistent across the three largest parties – 28% of Liberal, 25% of Conservative, and 31% of NDP supporters say they are very or somewhat likely to switch their vote preference. Only 12% of BQ supporters say they are likely to switch while 41% of Green supporters are open to doing so – the highest of any party.
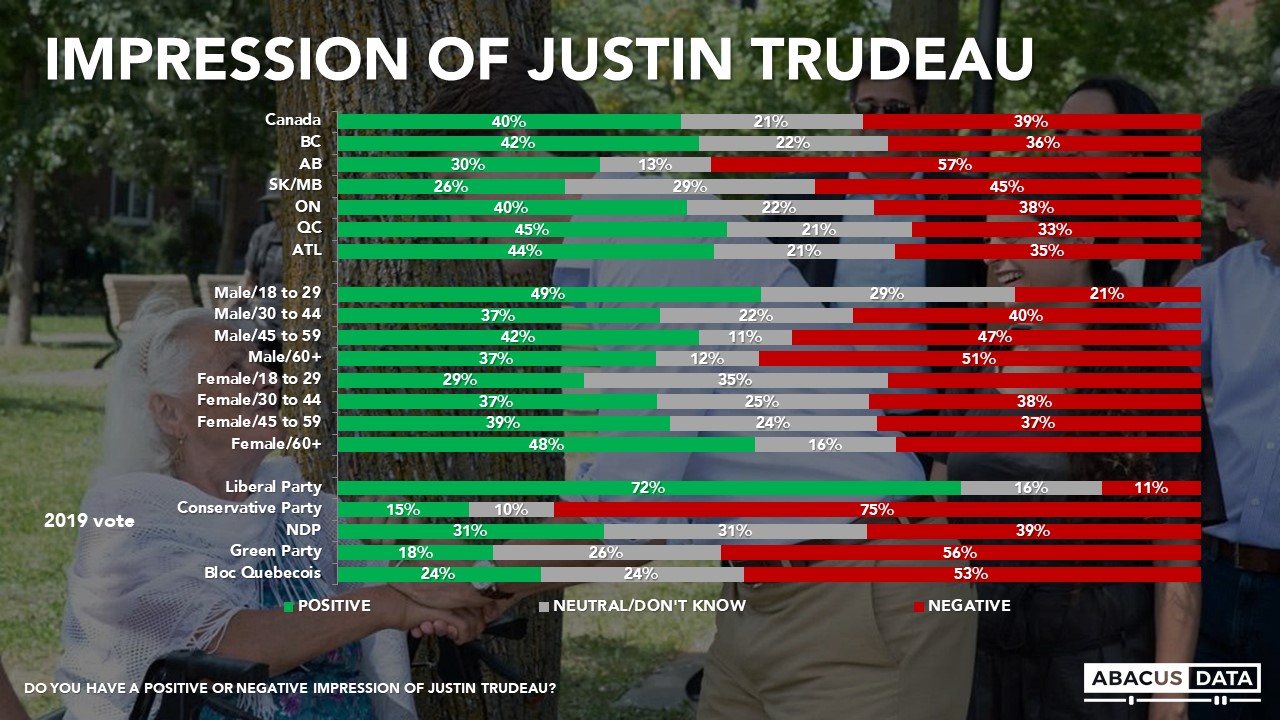
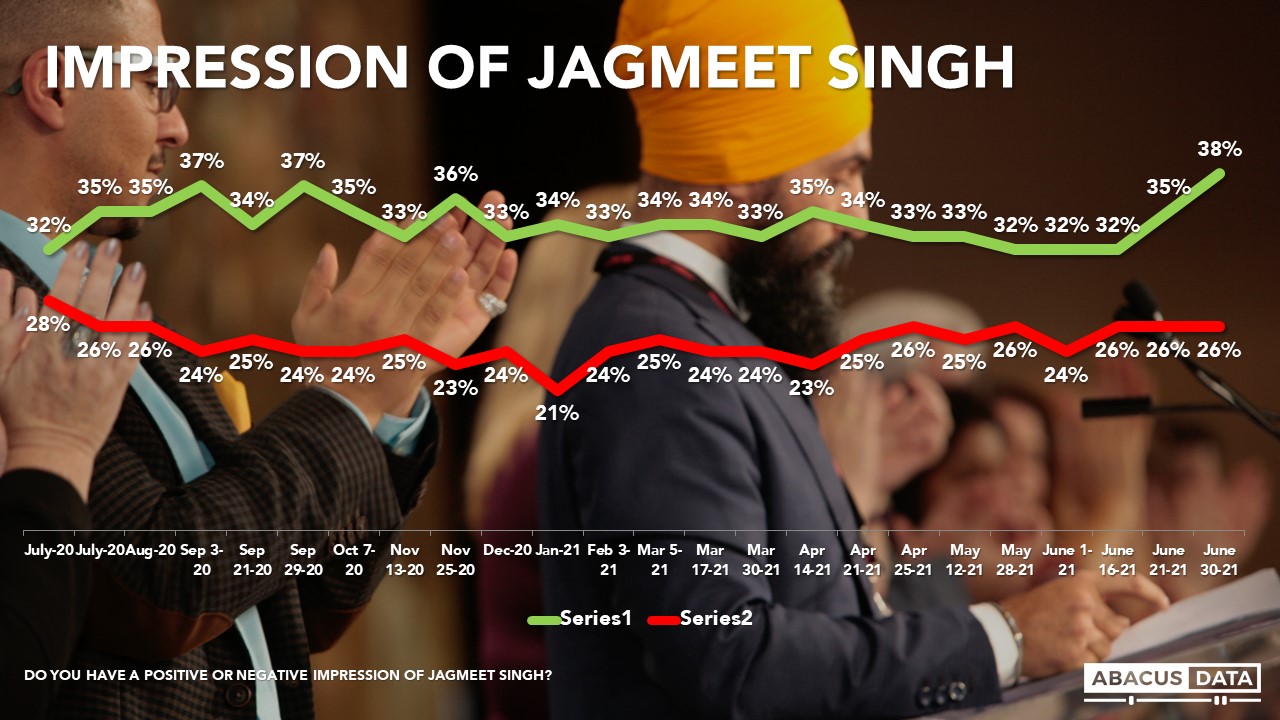
LEADER IMPRESSIONS
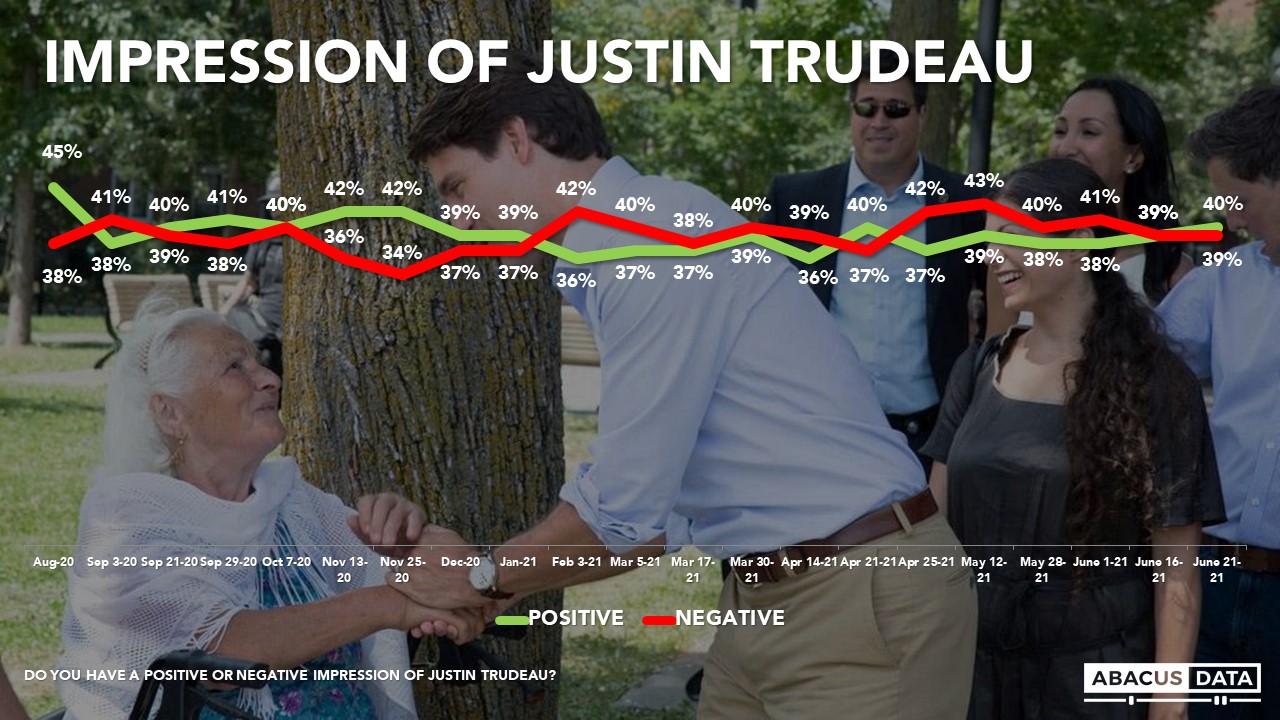
Justin Trudeau enjoys a positive impression among 40% and finds negative impressions among 41%, for a net score of -1. Views of Mr. Trudeau have been stable for most of 2021. Back in August 2019, 33% had a positive impression of Mr. Trudeau compared with 45% who had a negative view for a net score of -12.

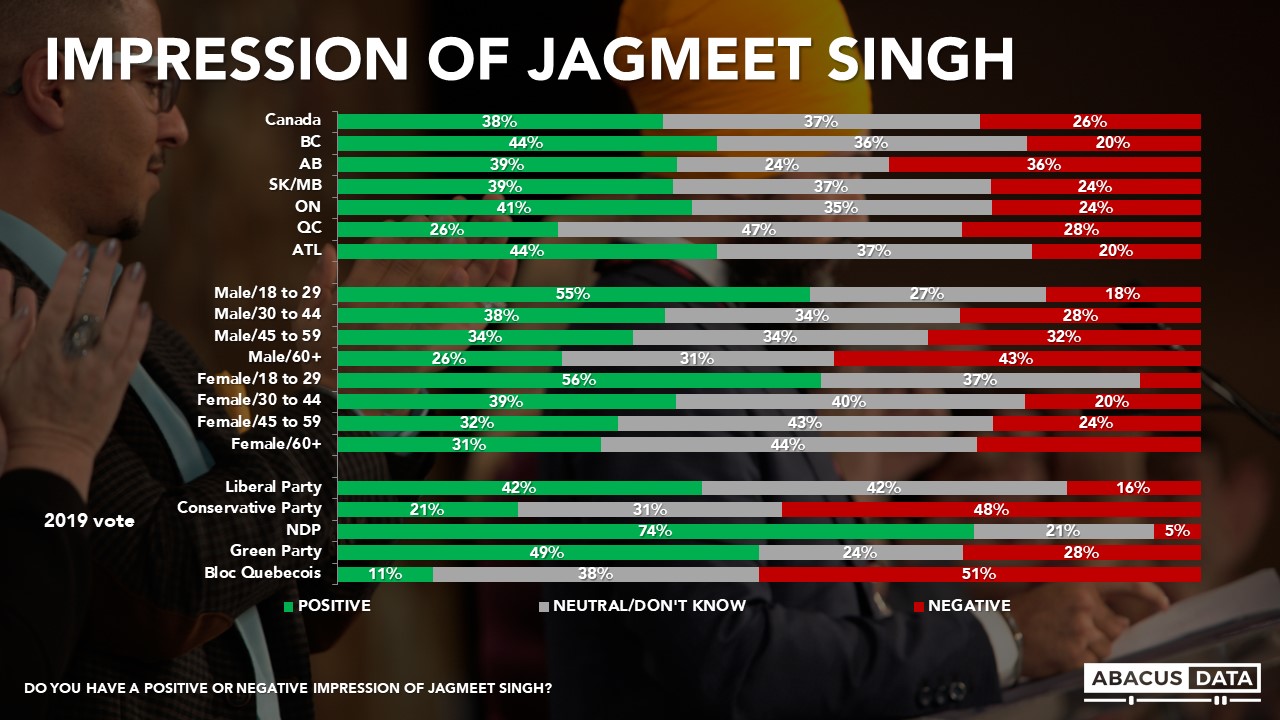
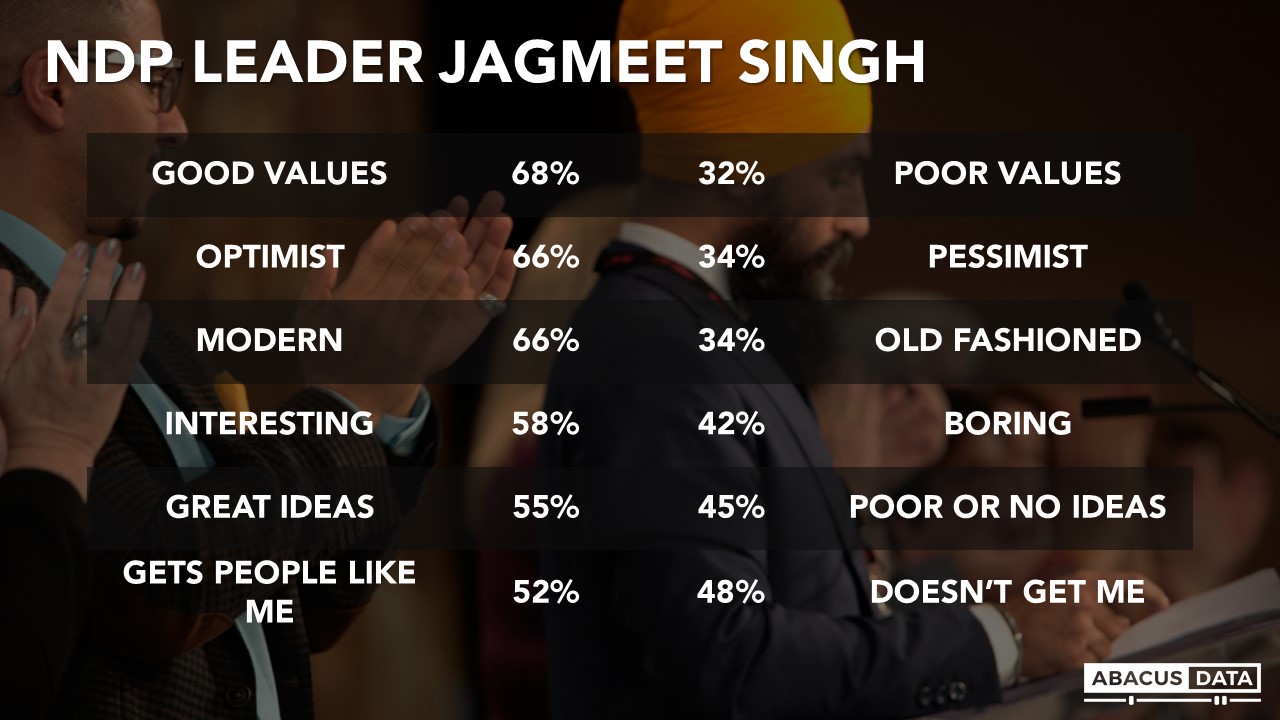
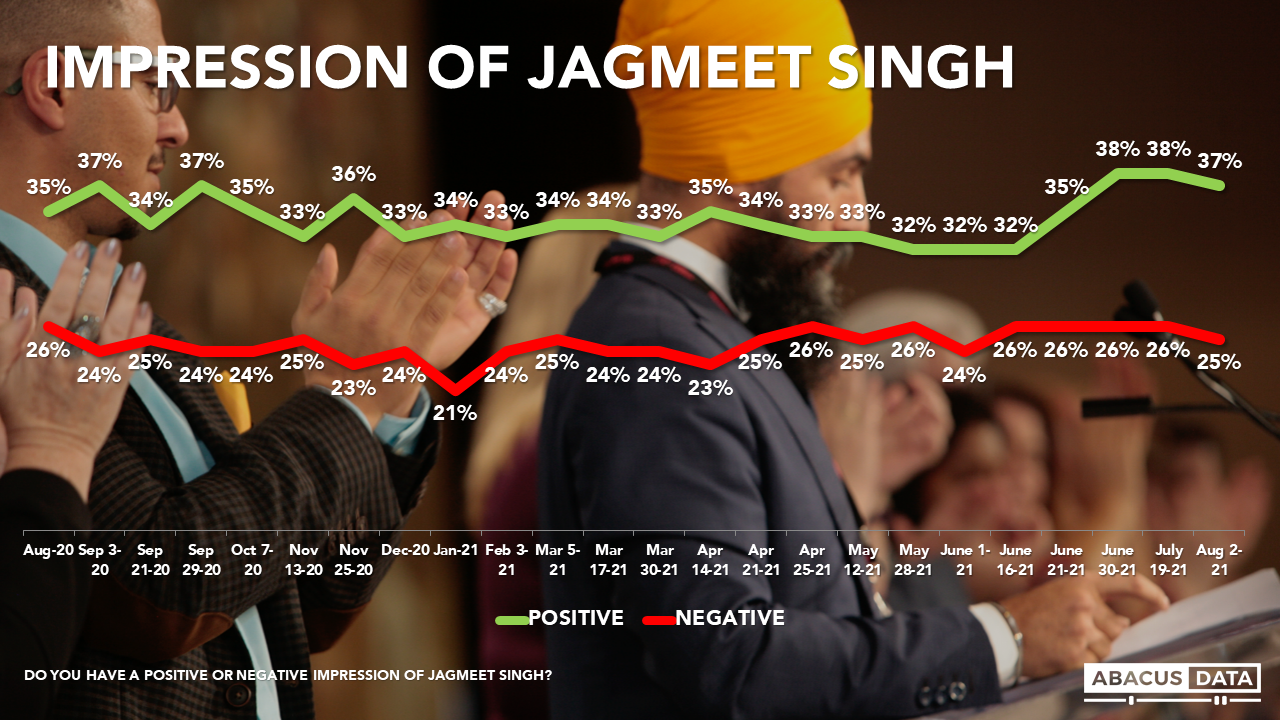
Jagmeet Singh enjoys a positive impression among 37% and finds negative impressions among 25% for a net +12. Mr. Singh has had a net positive impression for the entire period since the previous election. In August 2019, Mr. Singh’s positives were 25% and negatives were 28% for a net score of -3.
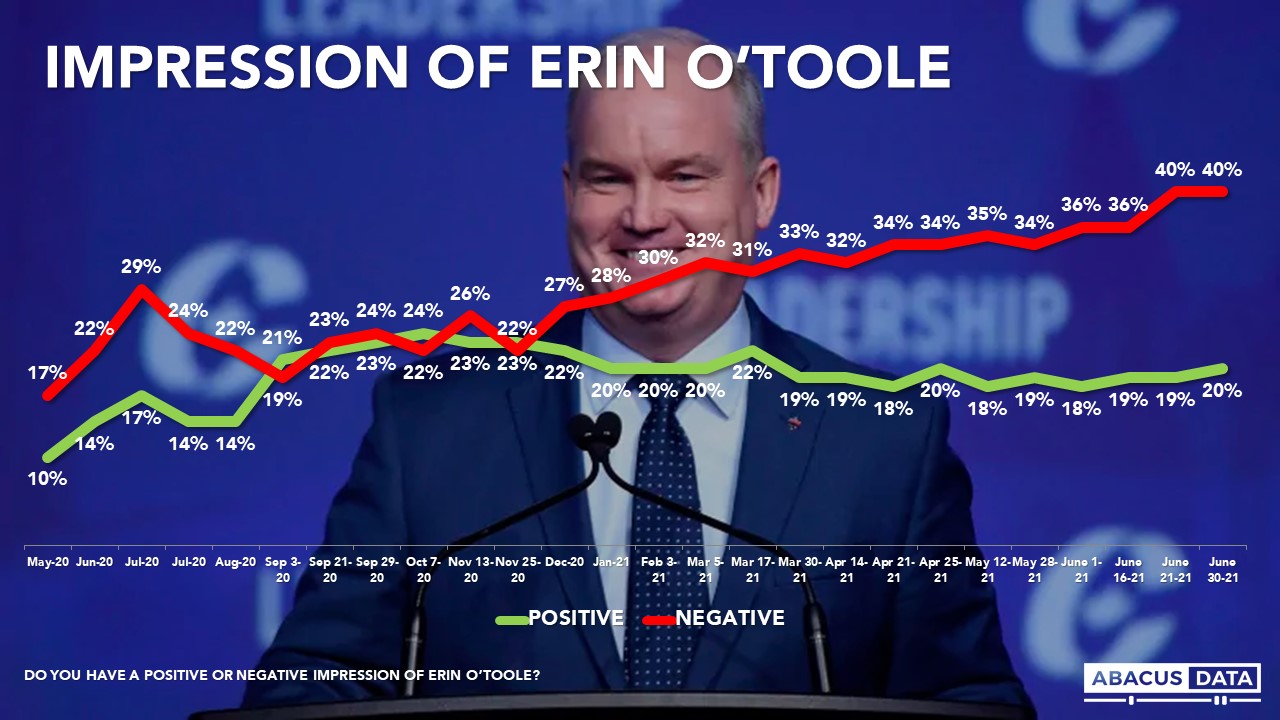
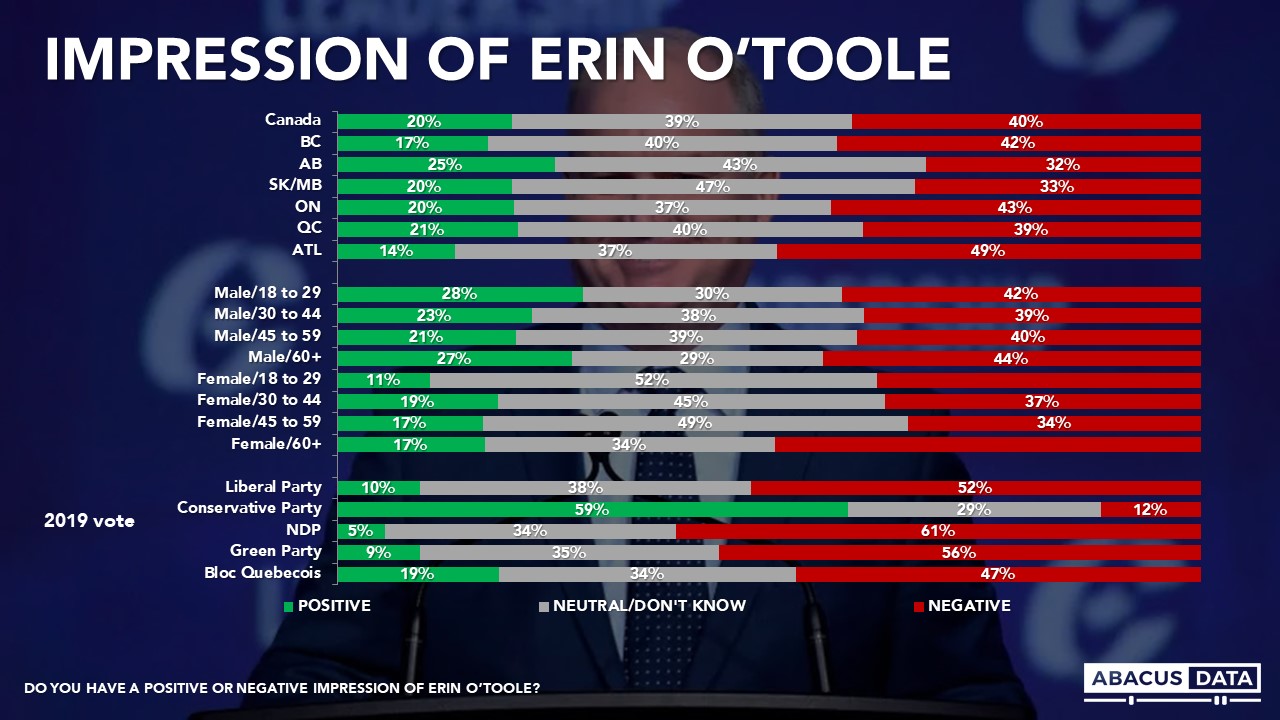
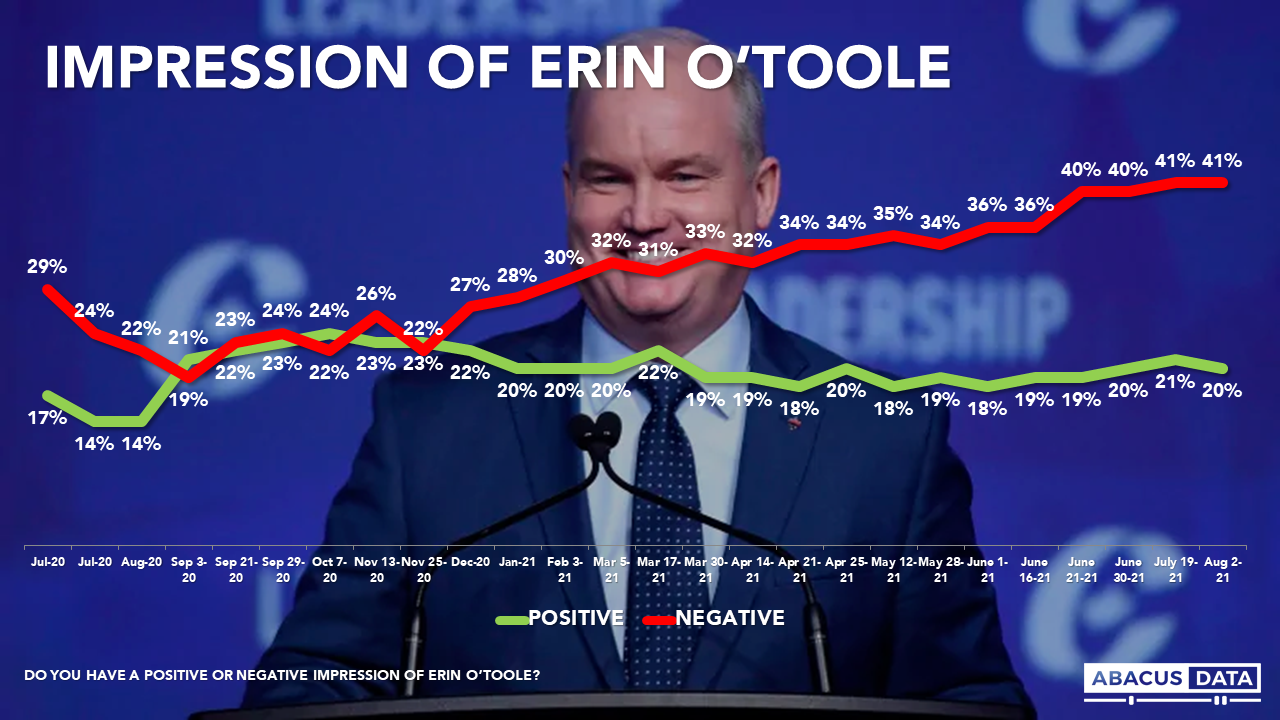
Erin O’Toole enjoys a positive impression among 20% and finds negative impressions among 41%, for a net score of -21. Back in August 2019, Mr. O’Toole’s predecessor Andrew Scheer had positives at 33% and negatives at 36% for a net score of -3.
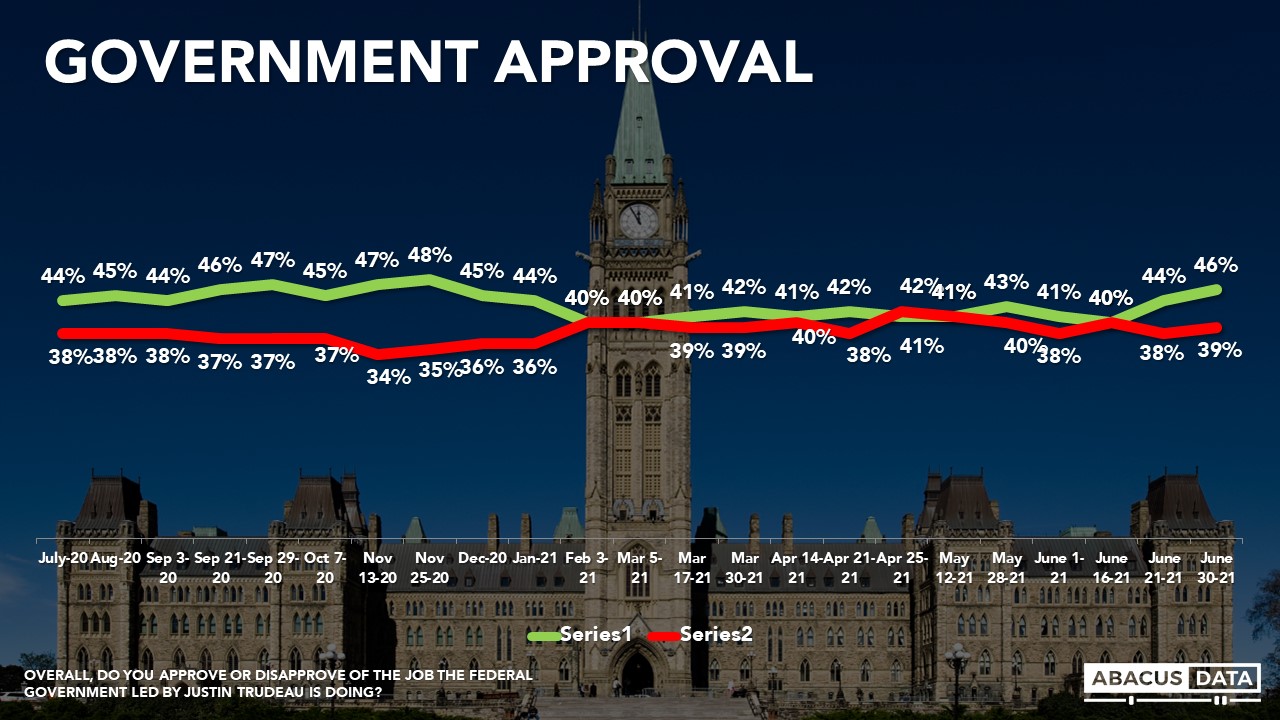
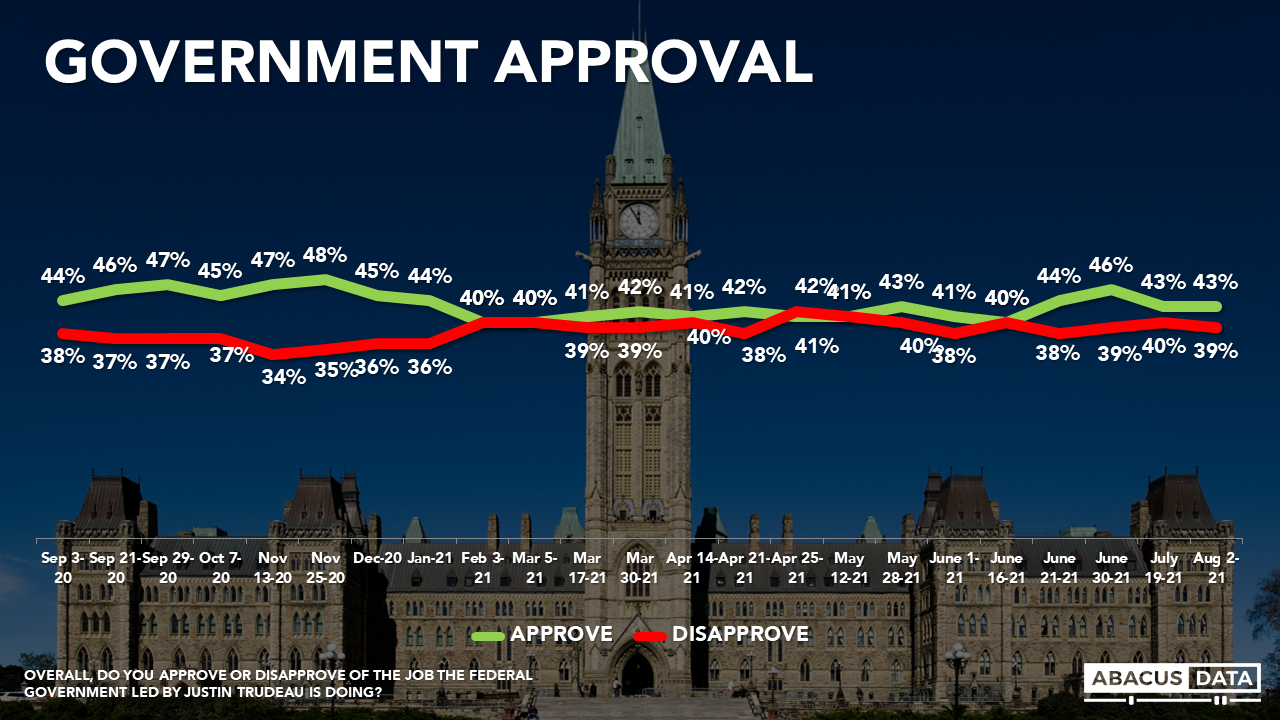
GOVERNMENT APPROVAL
Today 43% approve of the job being done by the Trudeau government, while 39% disapprove. This +4 net score nationally breaks down to a +4 in BC, -16 in Alberta, -13 in Man/Sask, +9 in Ontario, +1 in Quebec, +31 in Atlantic Canada.
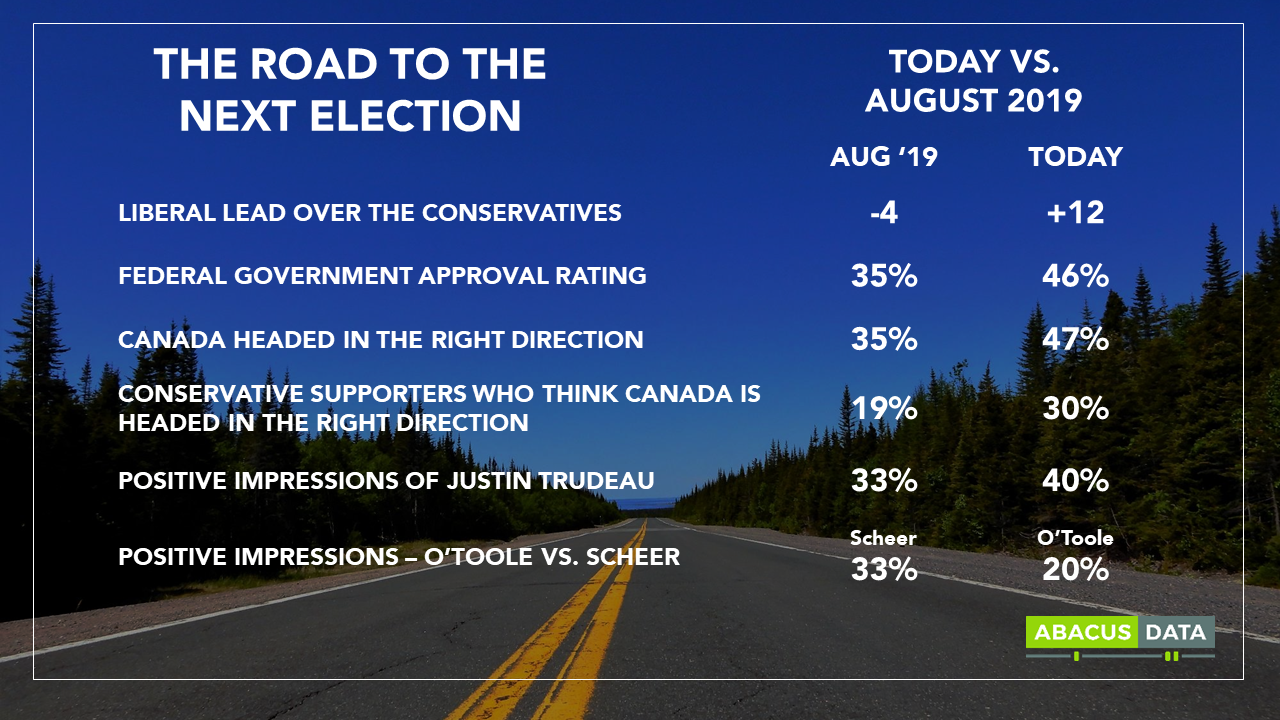
2019 vs. 2021
Going back to data from our August 2019 survey (just before the start of the 2019 campaign), we find a decidedly different political environment. The Liberals have a large lead, the government’s approval rating is 11-points higher, and Canadians are 12-points more likely to feel like the country is headed in the right direction.
As well, more people have a positive impression of Mr. Trudeau today than back in August 2019 and think far less positively of Mr. O’Toole than they did of Mr. Scheer.
UPSHOT
According to Bruce Anderson: “There are three factors to watch right now. First, the Conservatives are facing competition on the right, a lack of voter interest on the centre and weak motivation, given that a third of their voters feel the country is heading in a good direction right now.
Second, the NDP has built appeal around a popular leader and a progressive agenda, but it remains to be seen whether they can draw more votes on the centre of the spectrum, or whether the Liberals policy announcements over the summer have filled-in some of the gaps that progressive voters were looking at and that had been making the Liberals somewhat vulnerable.
Finally, how much and in what ways the pandemic will drive voting – will this election hinge on anxiety about a potential fourth wave and what kind of political leadership people are looking for – or will it feel like an exercise that was poorly timed and unnecessary.”
According to David Coletto: “Not much has changed in our tracking over the past month. The Liberals continue to hold a sizeable national lead built on solid leads in Ontario, BC, and Atlantic Canada. They are strong in Quebec and are increasingly competitive in the Prairies – especially in Manitoba.
If an election were to be called this weekend, the Liberals would start that campaign in a much stronger position than in 2019. More people feel the country is headed in the right direction, the Prime Minister’s personal image is more positive, and the Liberals have a healthy lead – a big difference from the deficit they faced when the campaign started in 2019.
Evidence from our survey suggests the Conservative base is less motivated than in 2019. 30% of Conservative supporters think the country is headed in the right direction and Erin O’Toole’s image is decidedly more negative than Mr. Scheer at this point in the election cycle.
The biggest wildcard remains the NDP. With a weakened Green Party, the most popular leader, and the largest pool of 2nd choice voters, the NDP has a lot of room to grow if dissatisfaction with the Liberals grows.
We don’t necessarily see a volatile electorate – only 4% say they are very likely to switch their vote choice now – but if the other 23% who say they could switch engage and find a better option than their current choice – we could see some shifts over the election campaign.”
METHODOLOGY
The survey was conducted with 2,000 Canadian adults from July 29 to August 2, 2021. A random sample of panelists were invited to complete the survey from a set of partner panels based on the Lucid exchange platform. These partners are typically double opt-in survey panels, blended to manage out potential skews in the data from a single source.
The margin of error for a comparable probability-based random sample of the same size is +/- 2.2%, 19 times out of 20.
The data were weighted according to census data to ensure that the sample matched Canada’s population according to age, gender, educational attainment, and region. Totals may not add up to 100 due to rounding.
[sc name=”signup”]
ABOUT ABACUS DATA
We are the only research and strategy firm that helps organizations respond to the disruptive risks and opportunities in a world where demographics and technology are changing more quickly than ever.
Find out more about what we are doing to help clients respond to the COVID-19 pandemic.
We are an innovative, fast-growing public opinion and marketing research consultancy. We use the latest technology, sound science, and deep experience to generate top-flight research-based advice to our clients. We offer global research capacity with a strong focus on customer service, attention to detail and exceptional value.
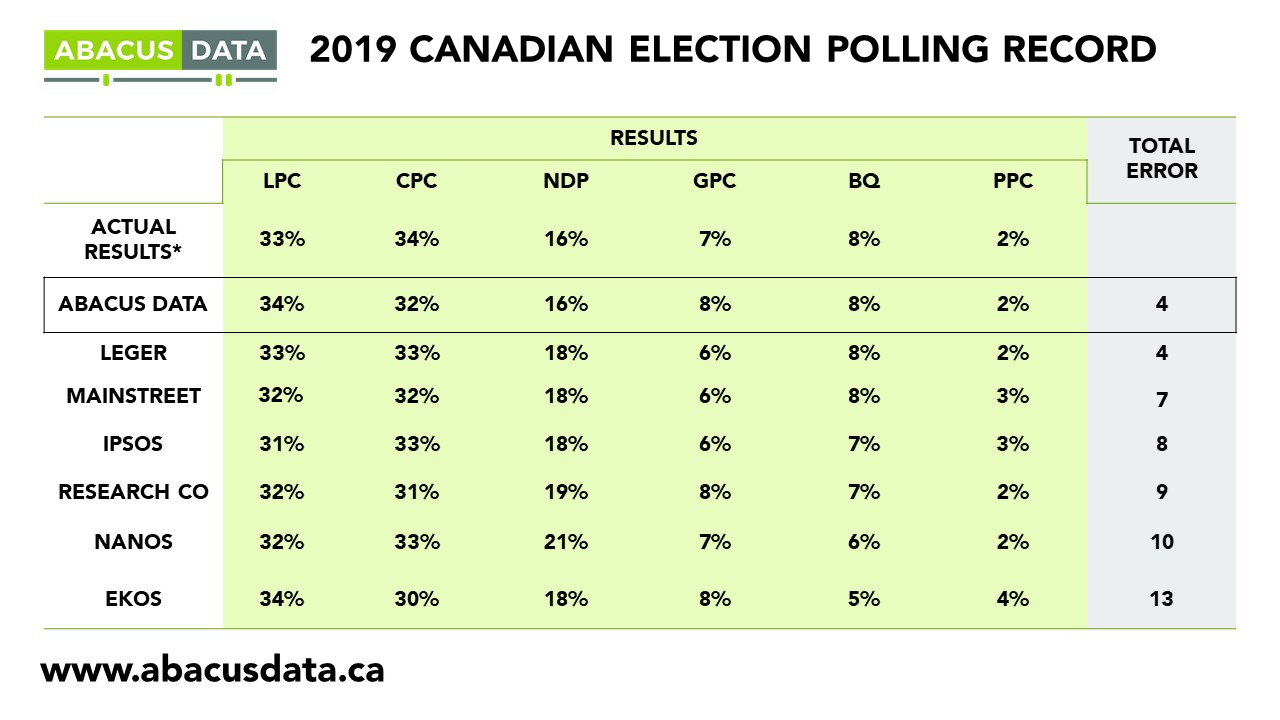
We were one of the most accurate pollsters conducting research during the 2019 Canadian Election.
Contact us with any questions.
Find out more about how we can help your organization by downloading our corporate profile and service offering.
[sc name=”signup”]