One week to go: Conservatives and Liberals still locked in a tie but Liberals open up clear leads in Ontario and Quebec
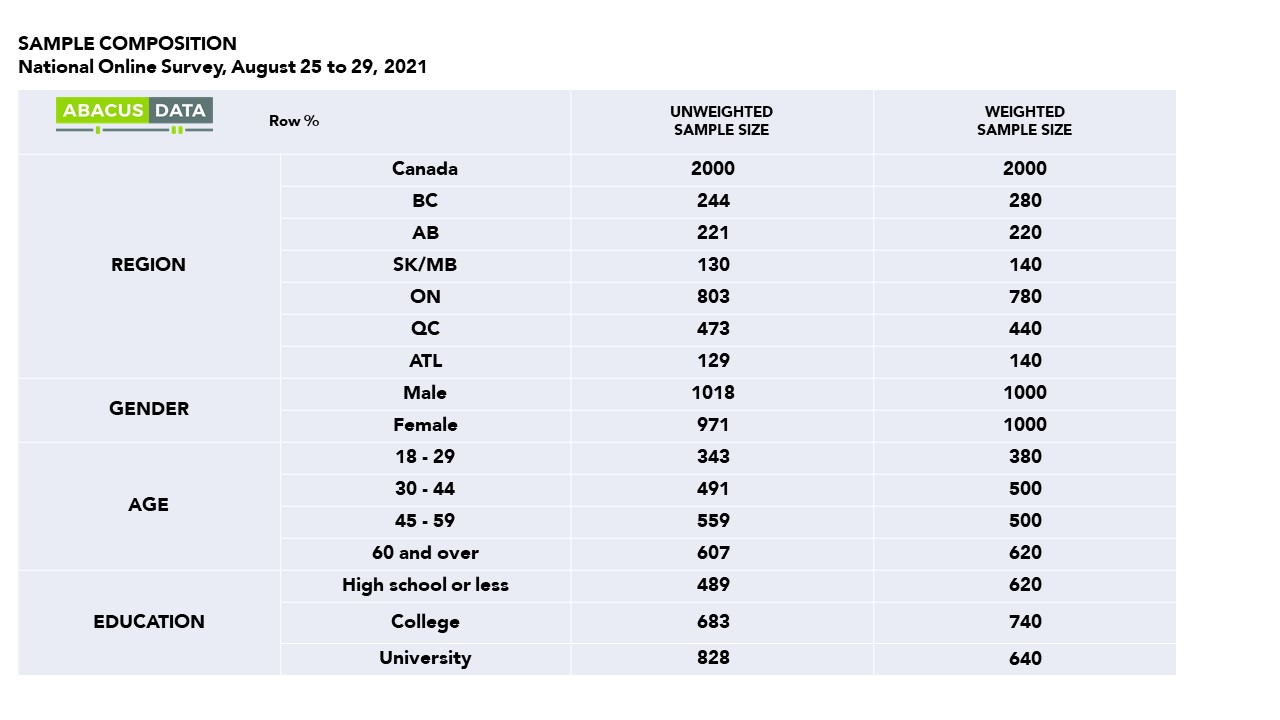
We just completed a national survey of 2,000 Canadians eligible to vote in the current federal election completed entirely after the French and English leaders’ debates last week.
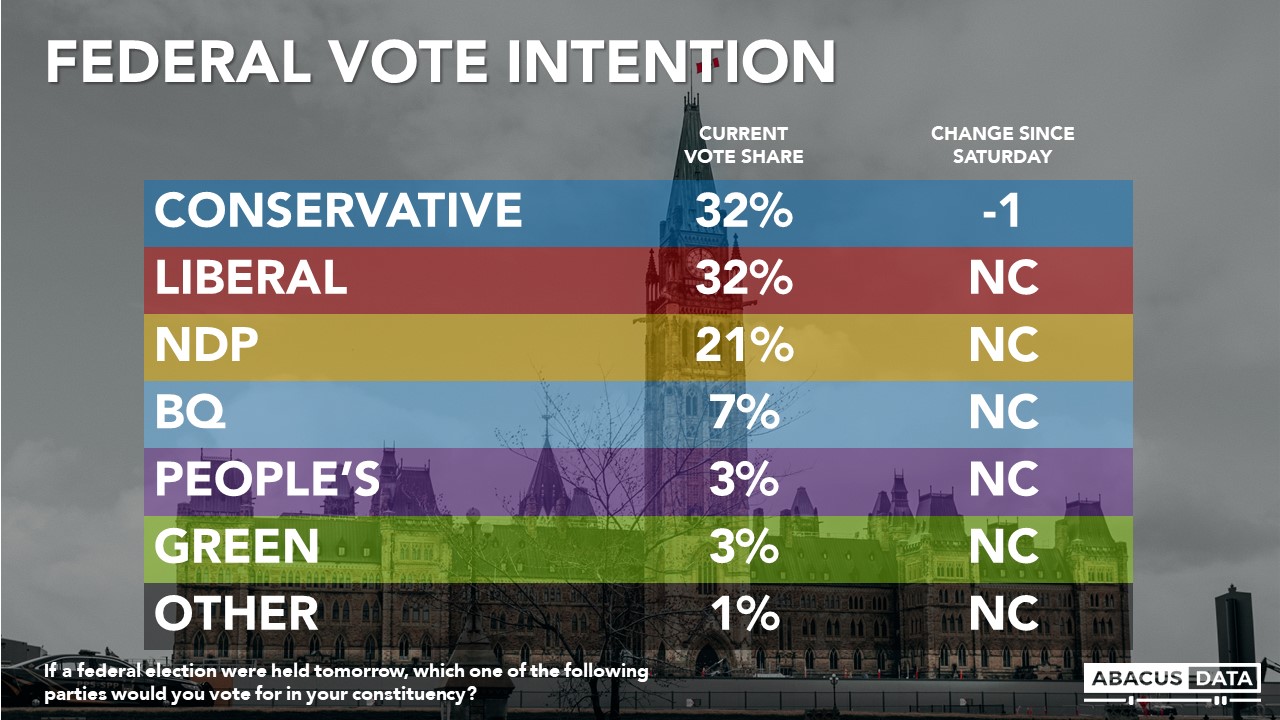
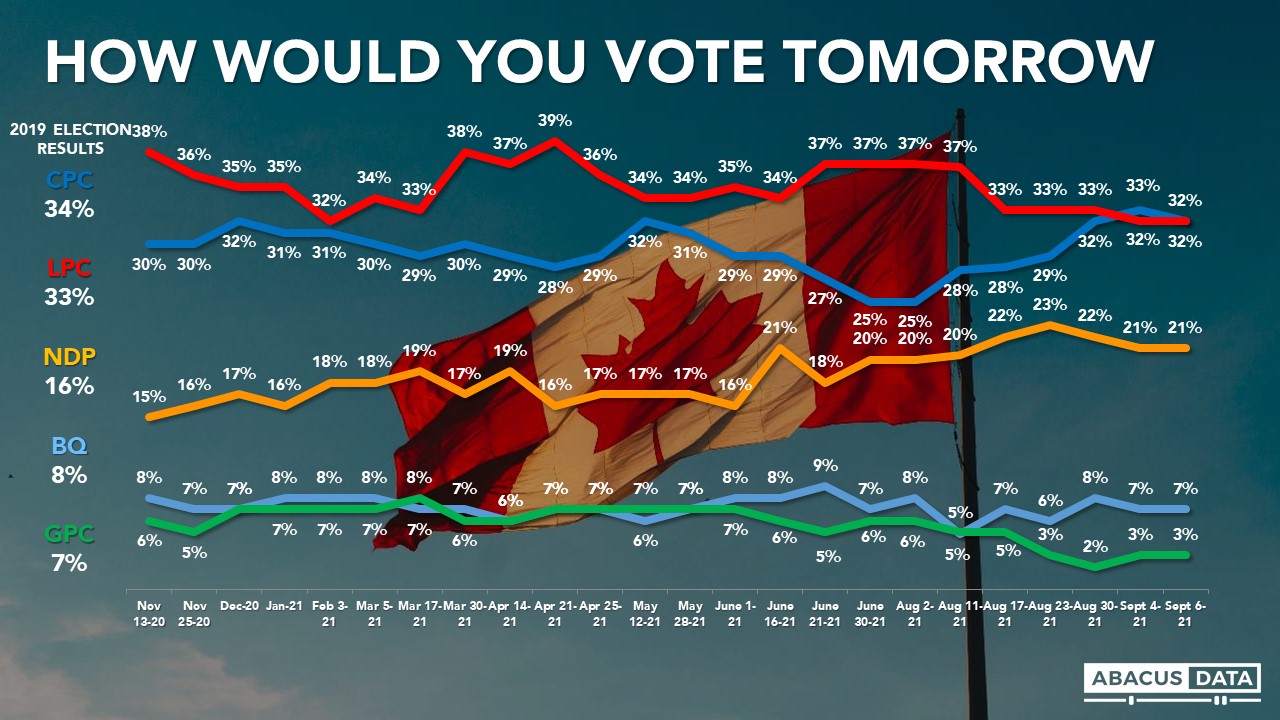
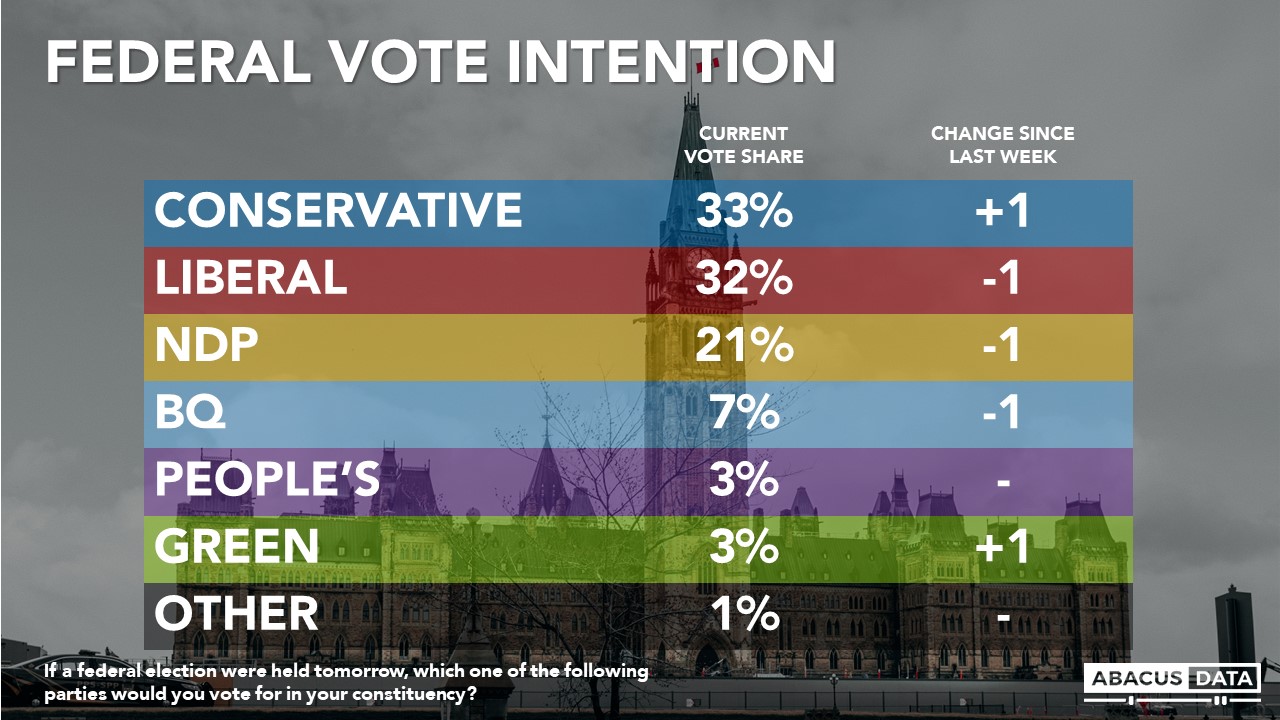
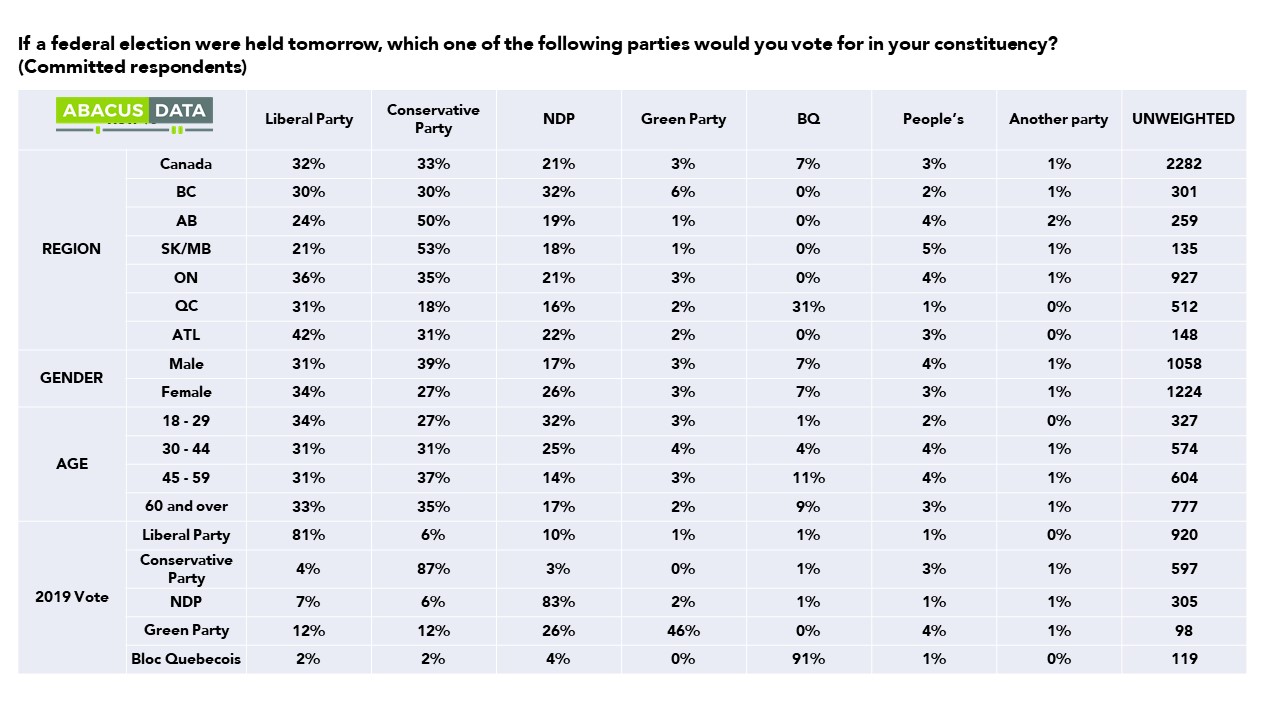
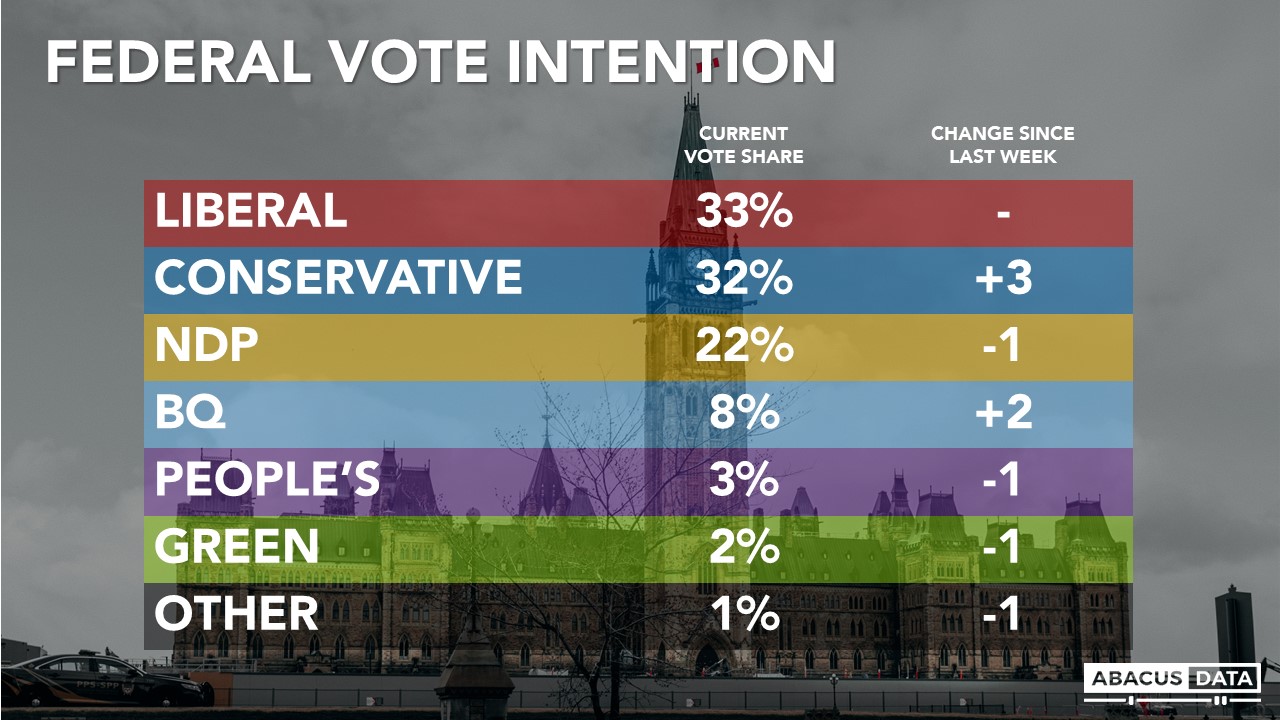
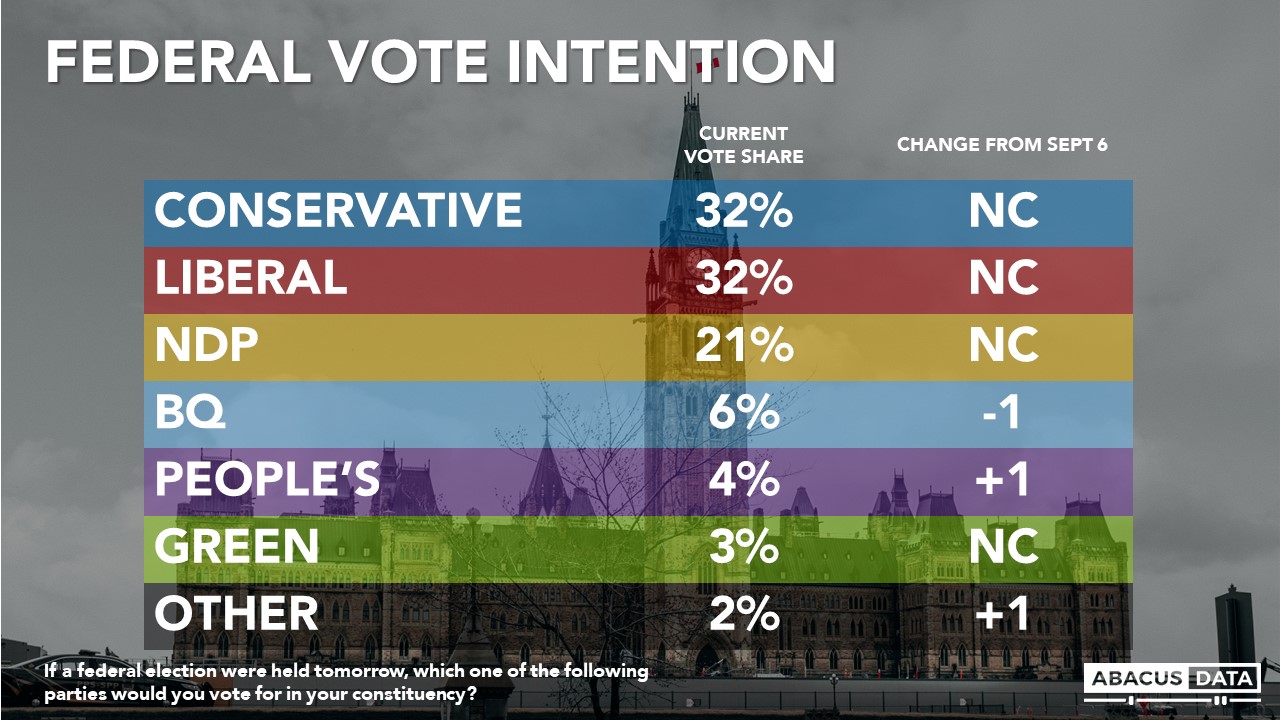
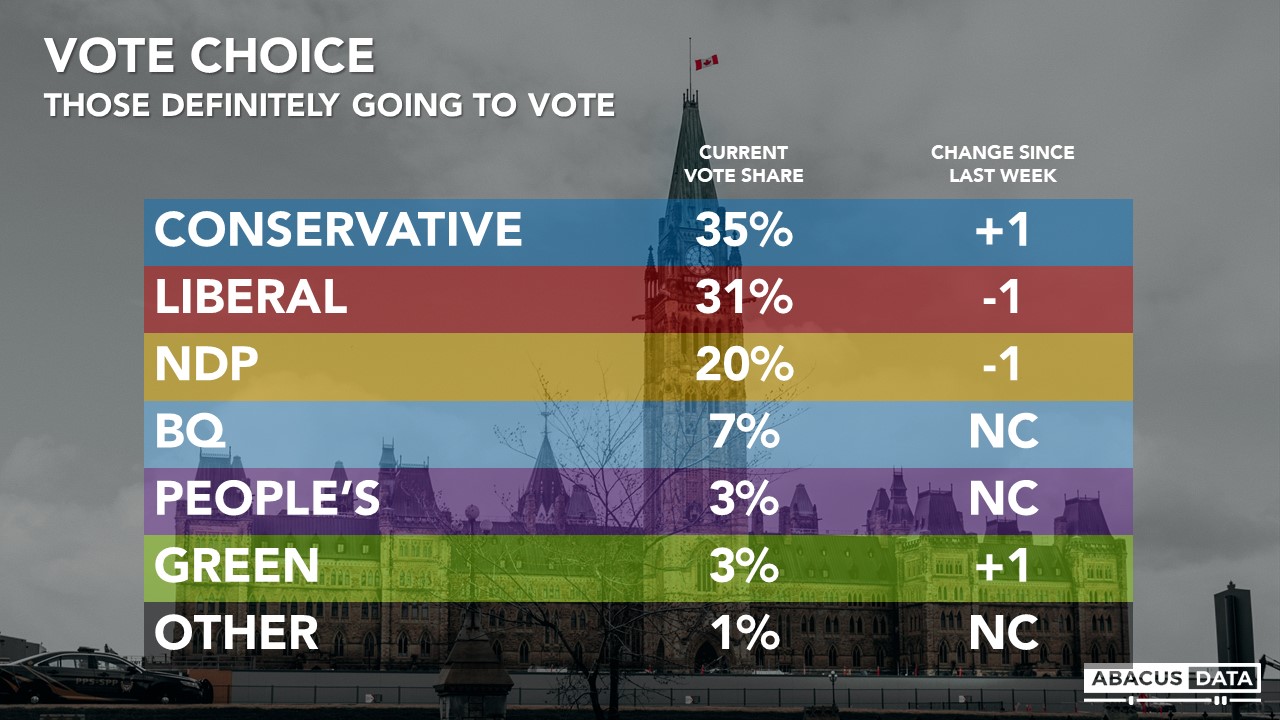
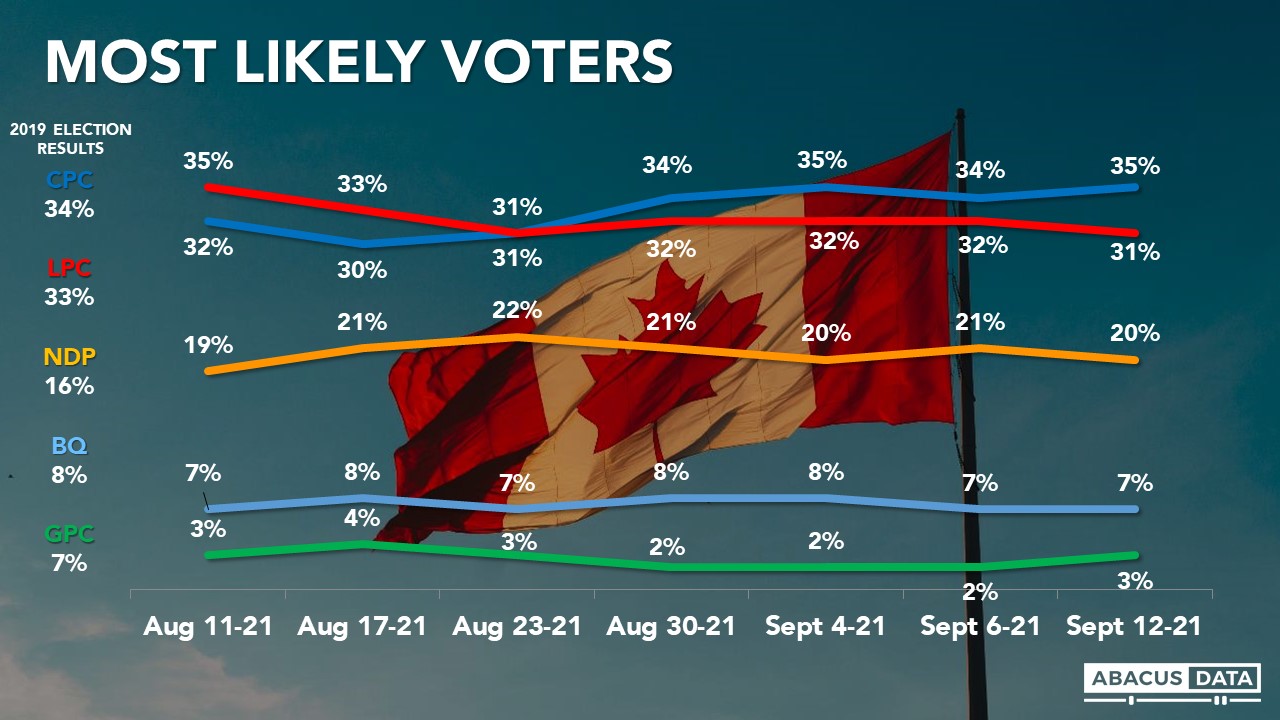
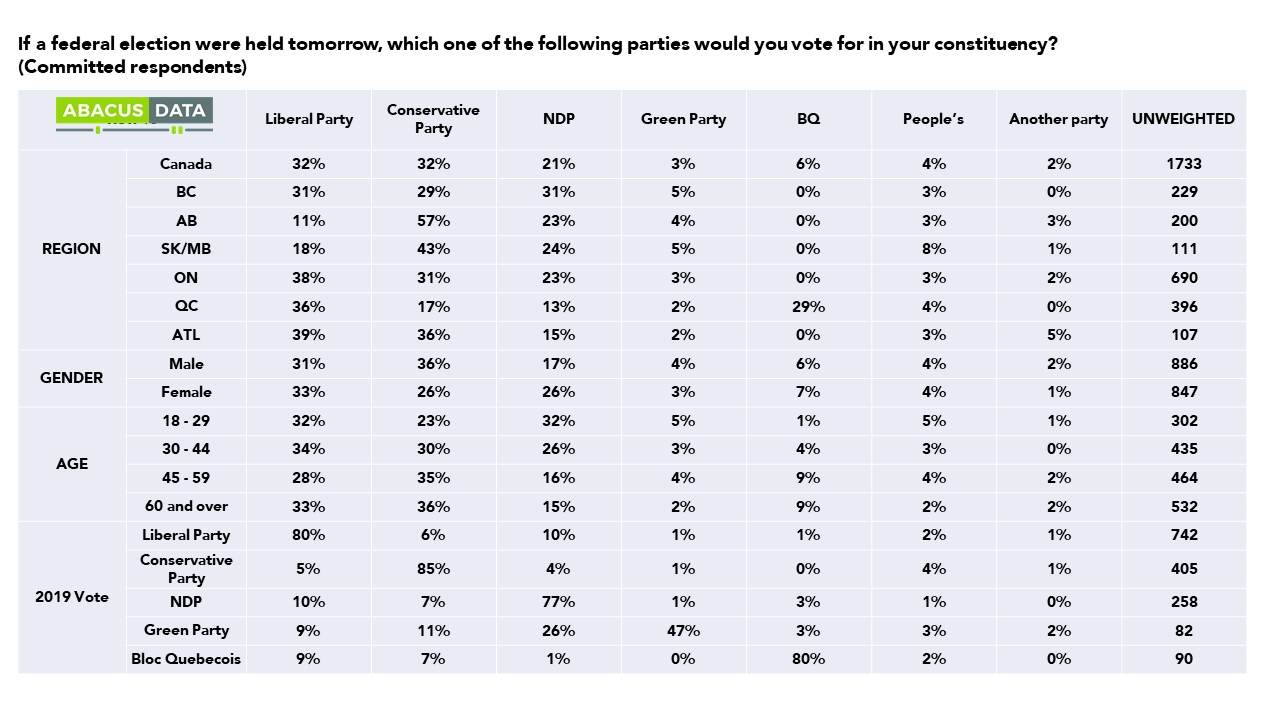
If an election were held now, the Conservatives would win 32% of the vote (unchanged), the Liberals 32% (unchanged), the NDP 21% (unchanged), the Green Party 3% (unchanged) and the BQ at 29% in Quebec (down 2). The People’s Party is at 4% nationally.

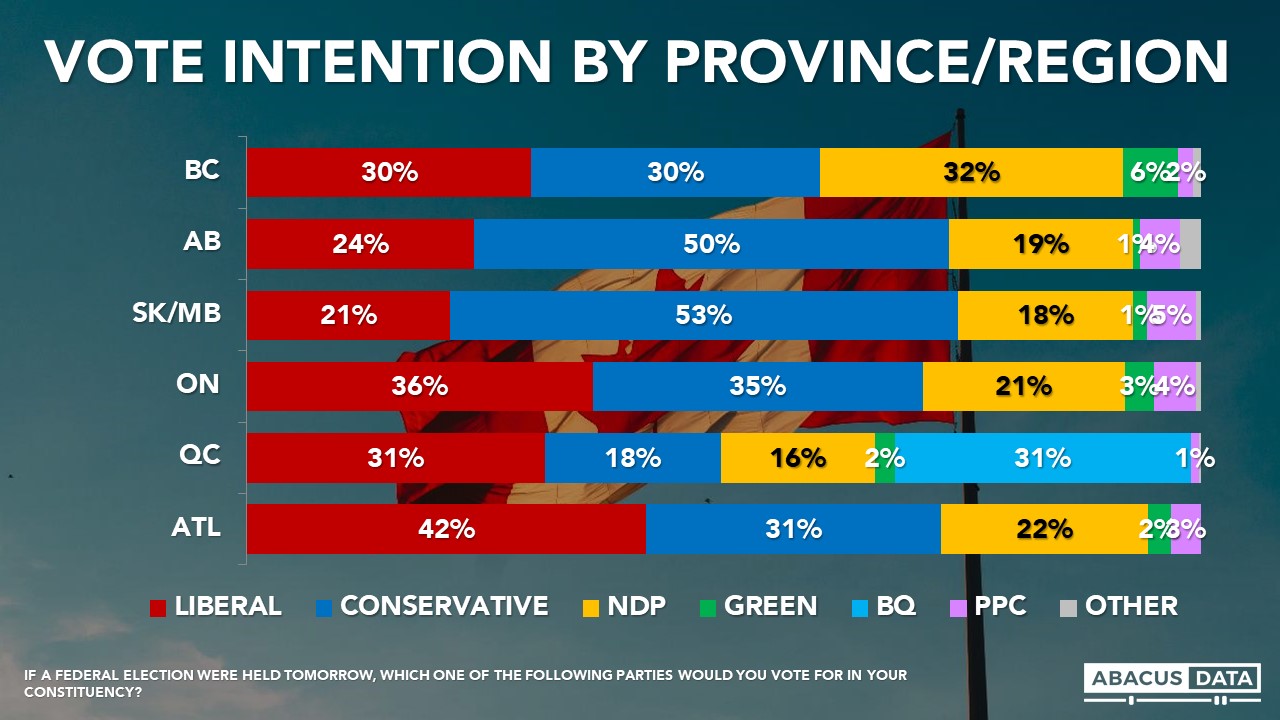
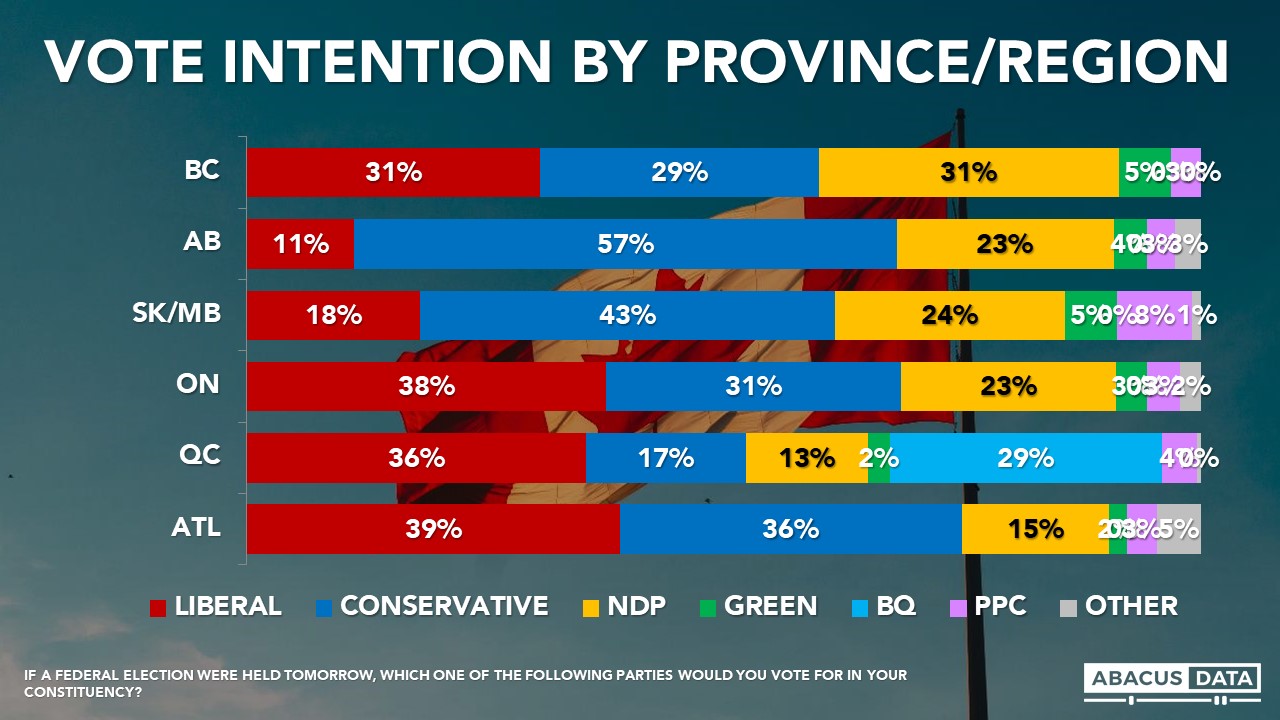
• In BC, we see a very tight three-way race with the NDP at 31%, the Liberals at 31%, and the Conservatives at 29%.
• In Alberta, 57% would vote Conservative compared with 23% for the NDP, 11% for the Liberals, 3% for the People’s Party and 1% for the Maverick Party.
• In Manitoba and Saskatchewan, the Conservatives lead with 43% followed by the NDP at 24% and the Liberals at 18%.
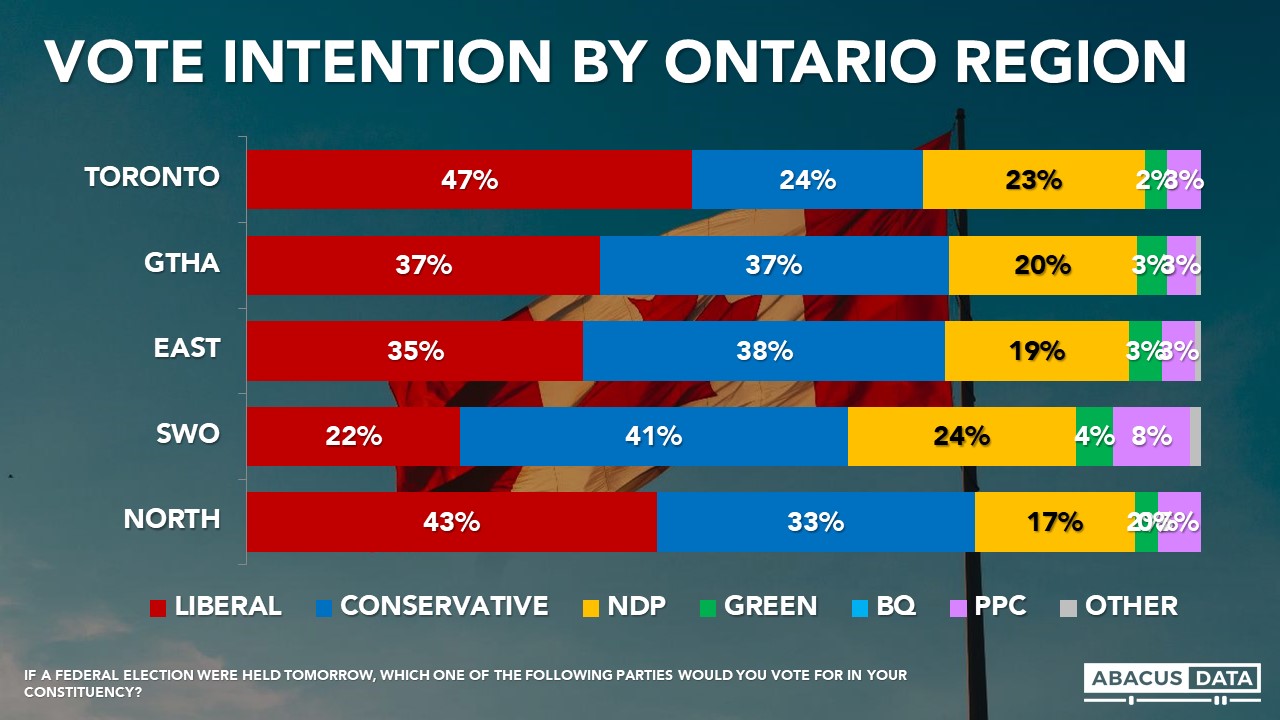
• In Ontario, the Liberals have opened up a 7-point lead over the Conservatives (38% to 31%) with the NDP at 23%.
• Within Ontario, the Liberals have a 21-point lead over the Conservatives in Toronto and a 14-point lead in the surrounding region. The Liberals and Conservatives are tied in eastern Ontario while the Conservatives lead by 12 in the southwest.
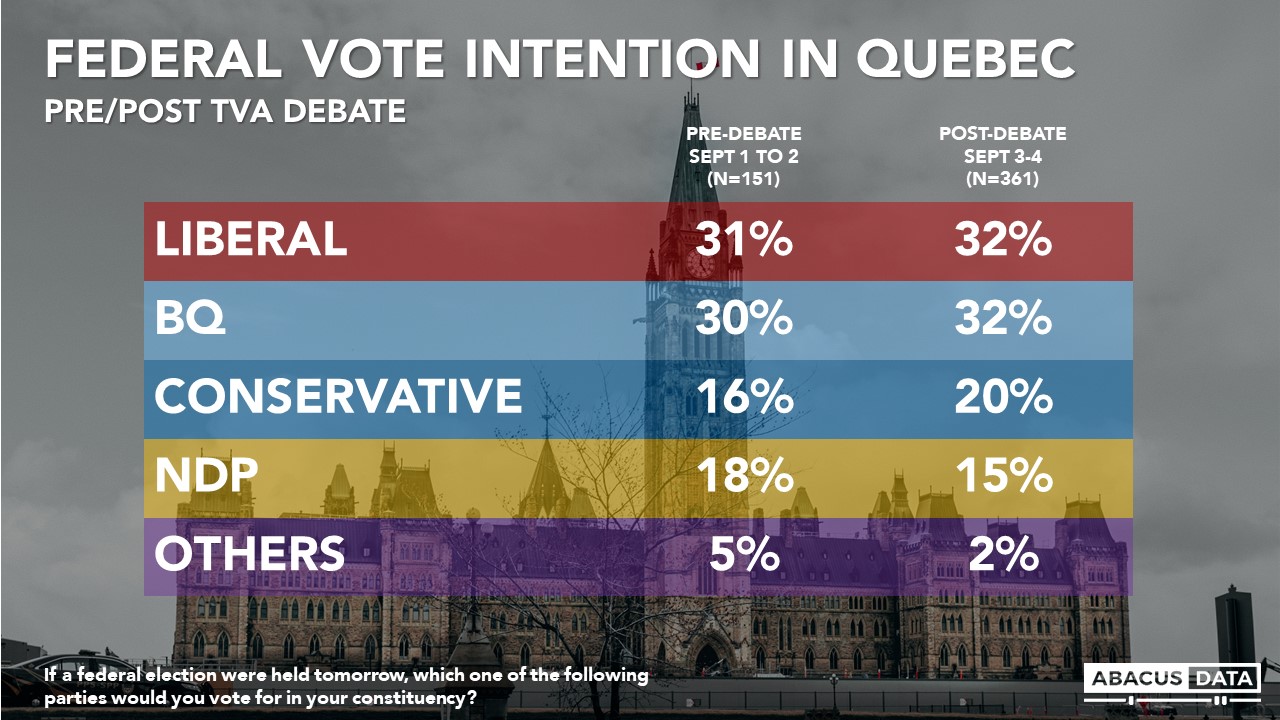
• In Quebec, we see the Liberals ahead of the BQ by 7-points with the Conservatives at 17% and the NDP at 13%. This is a rise for the Liberals of 4-points and a drop for the BQ of 2-points.
• In the Atlantic provinces, the liberals are ahead by 3 over the Conservatives (39% to 36%) with the NDP at 15%.
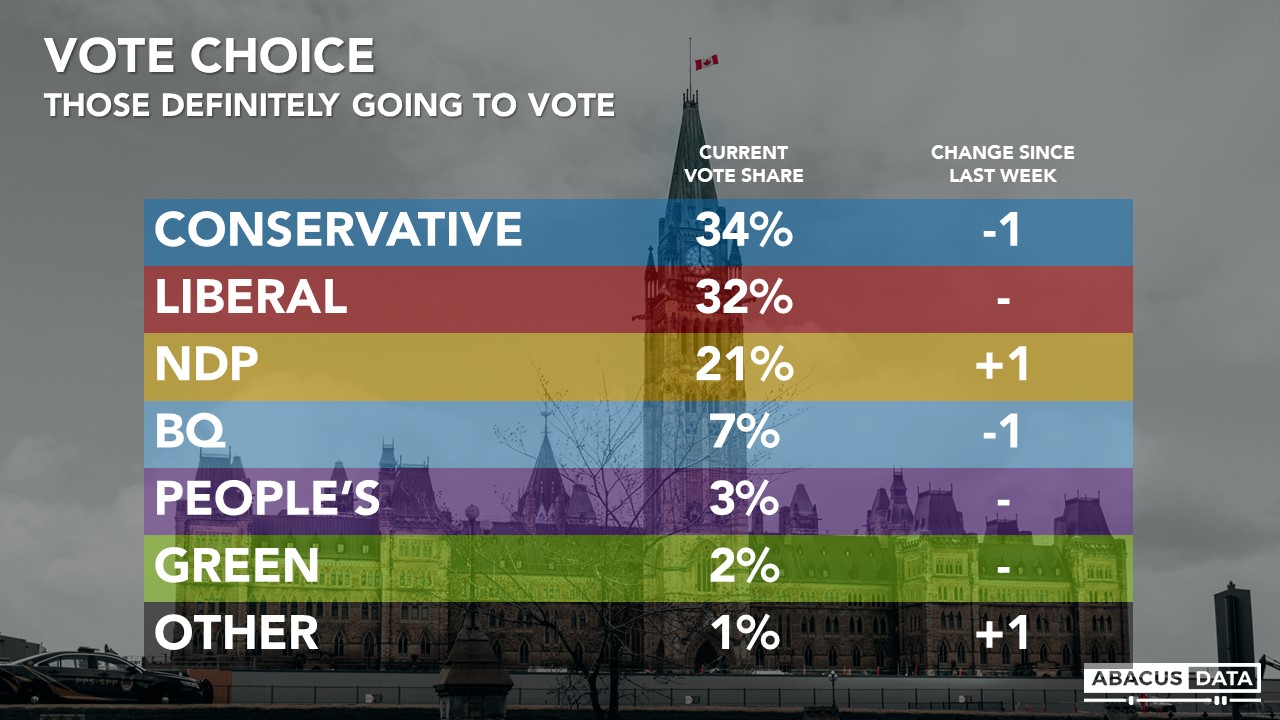
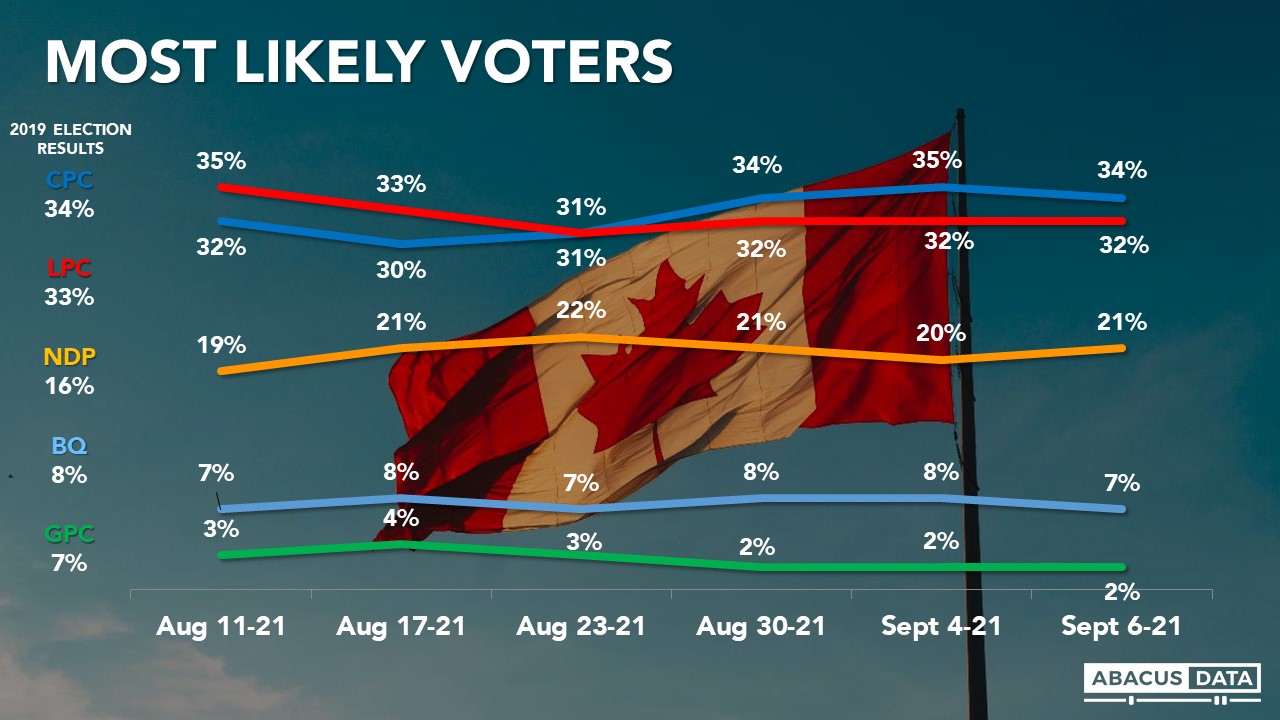
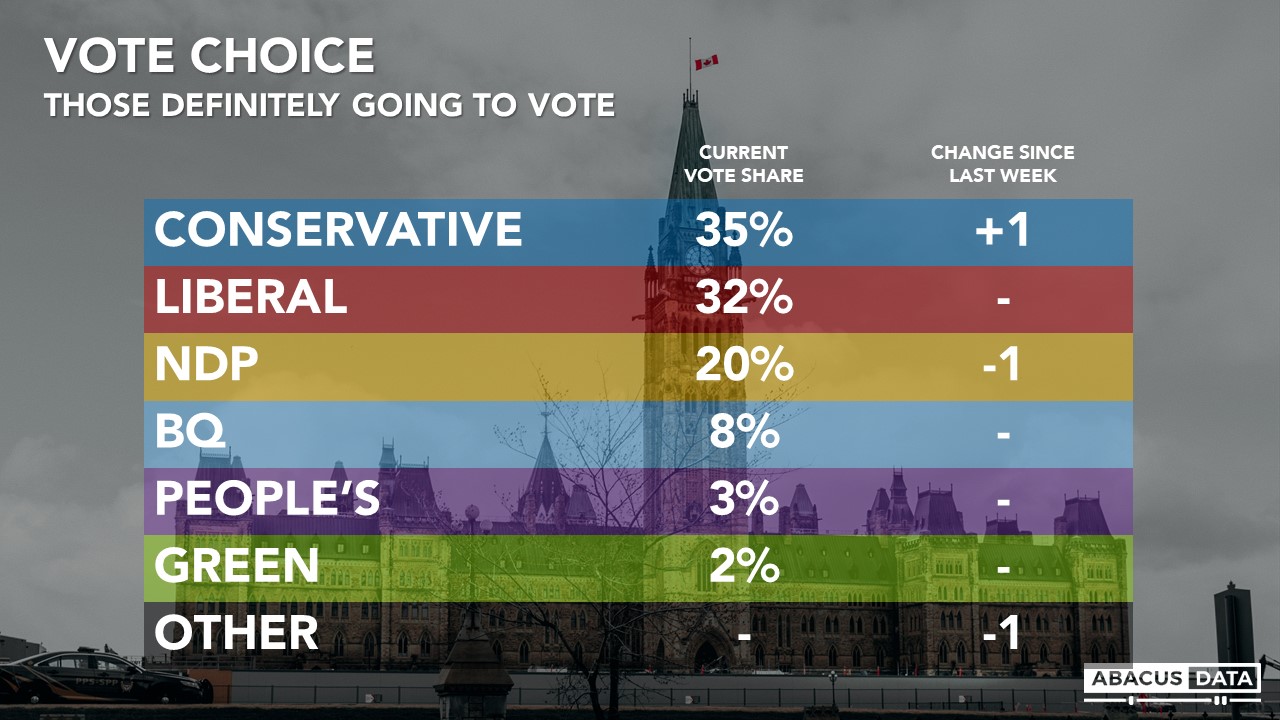
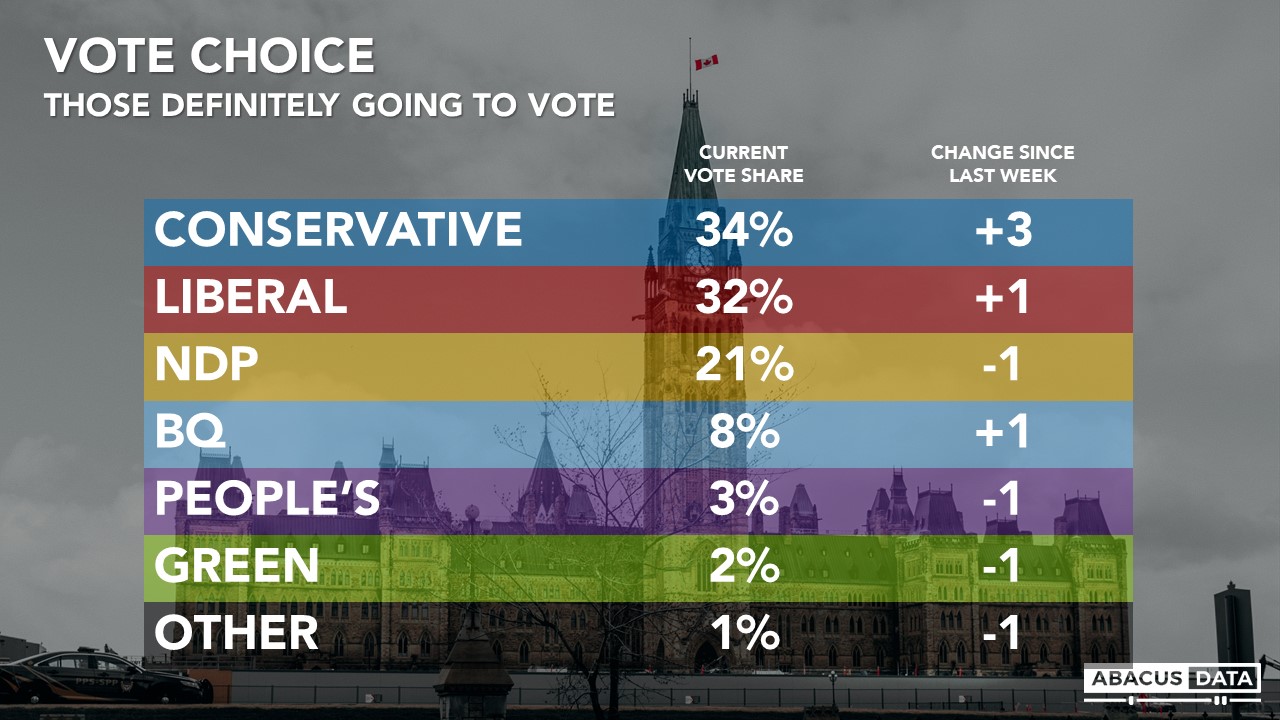
The Conservatives lead among those who say they will definitely vote by 4-points (35% to 31%) This is largely unchanged from our last poll.
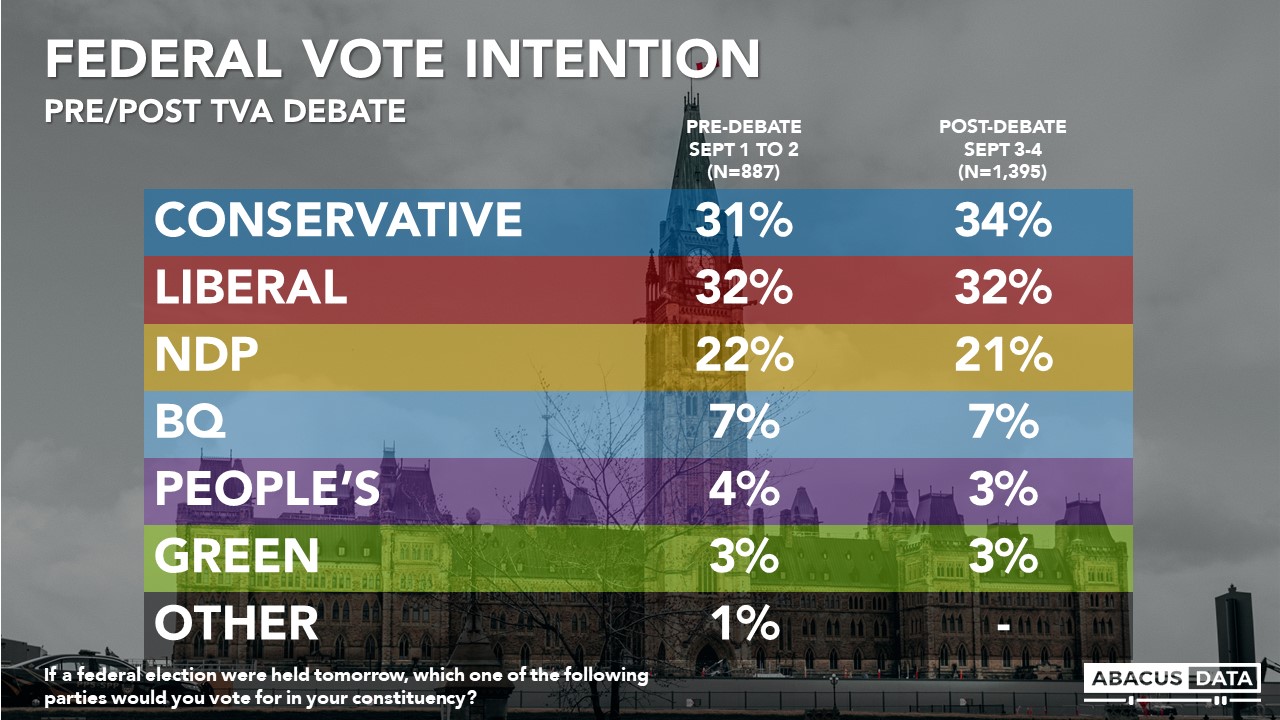
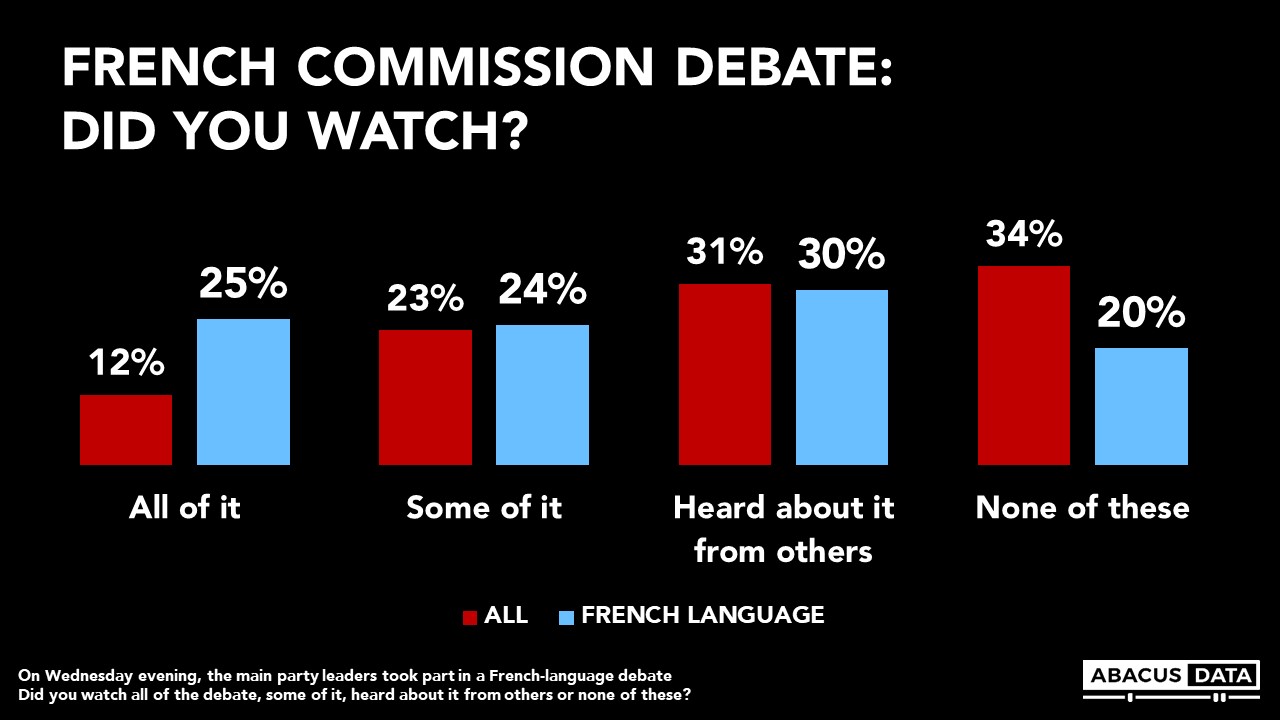
LEADERS’ DEBATES
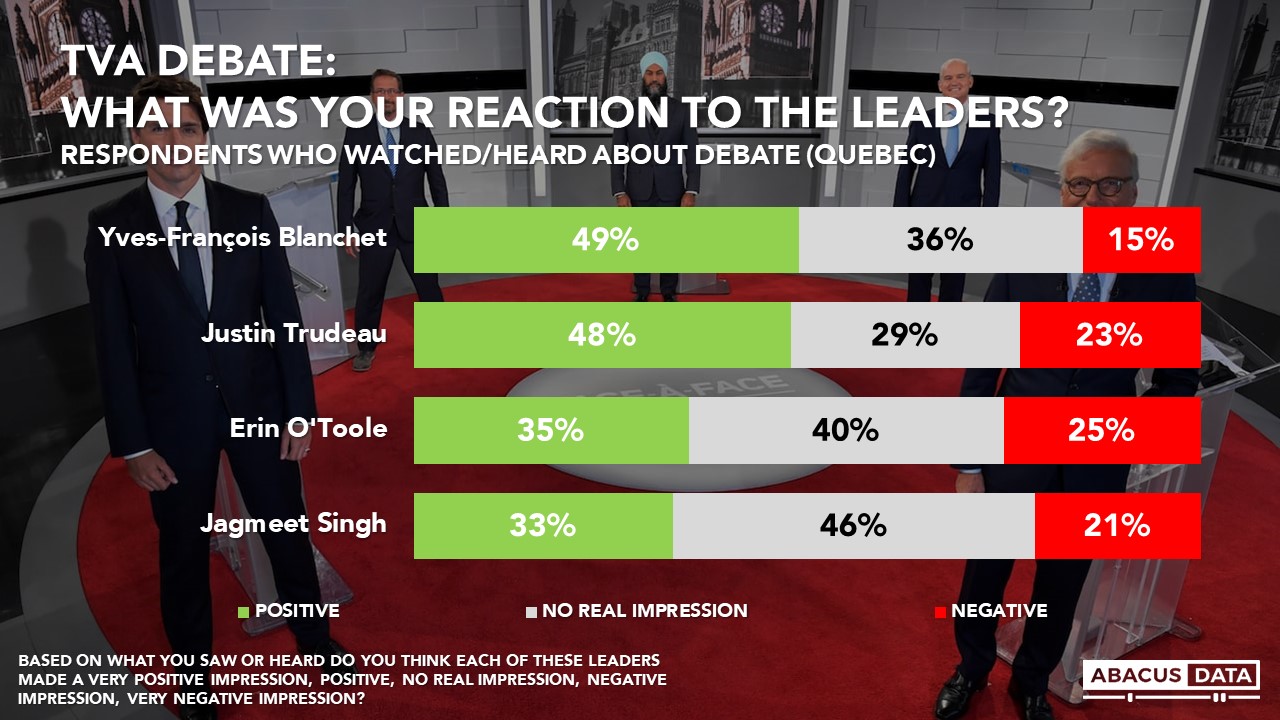
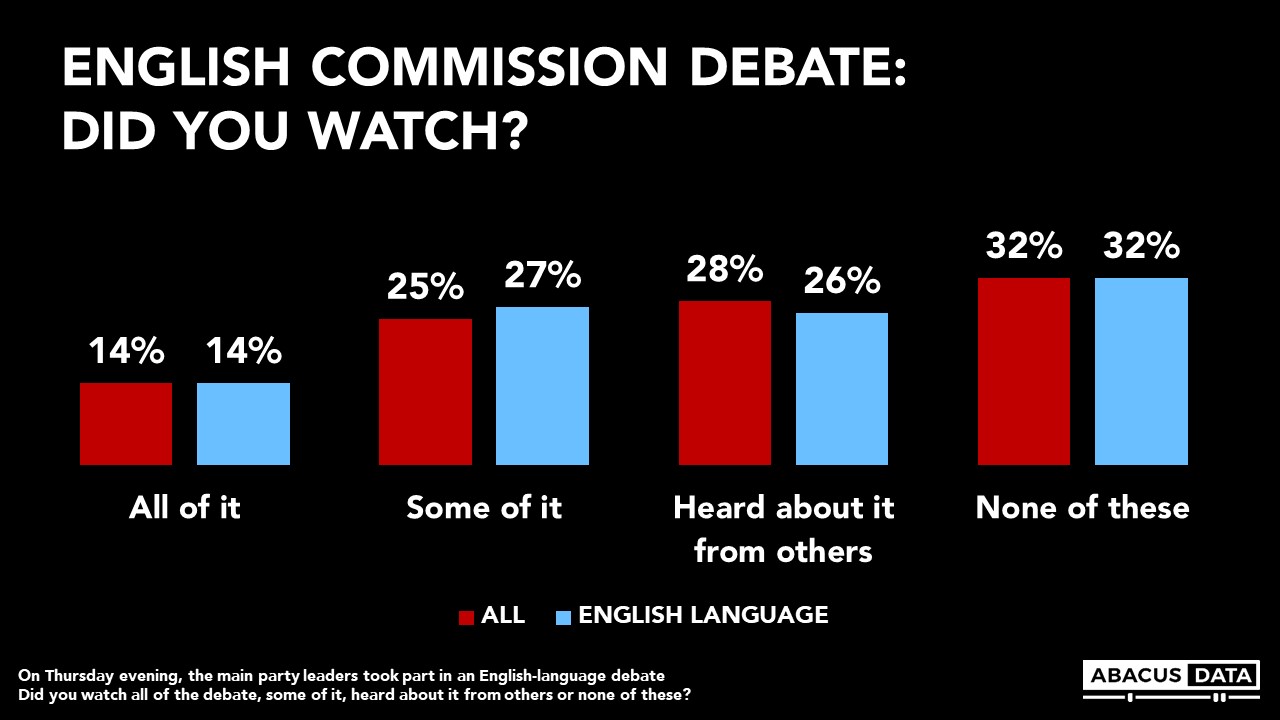
About half of francophones (49%) said they watched all of some of the French language Commission debate. The audience among anglophones for the English language debate was smaller, with only 41% indicating they had watched some or all of it.
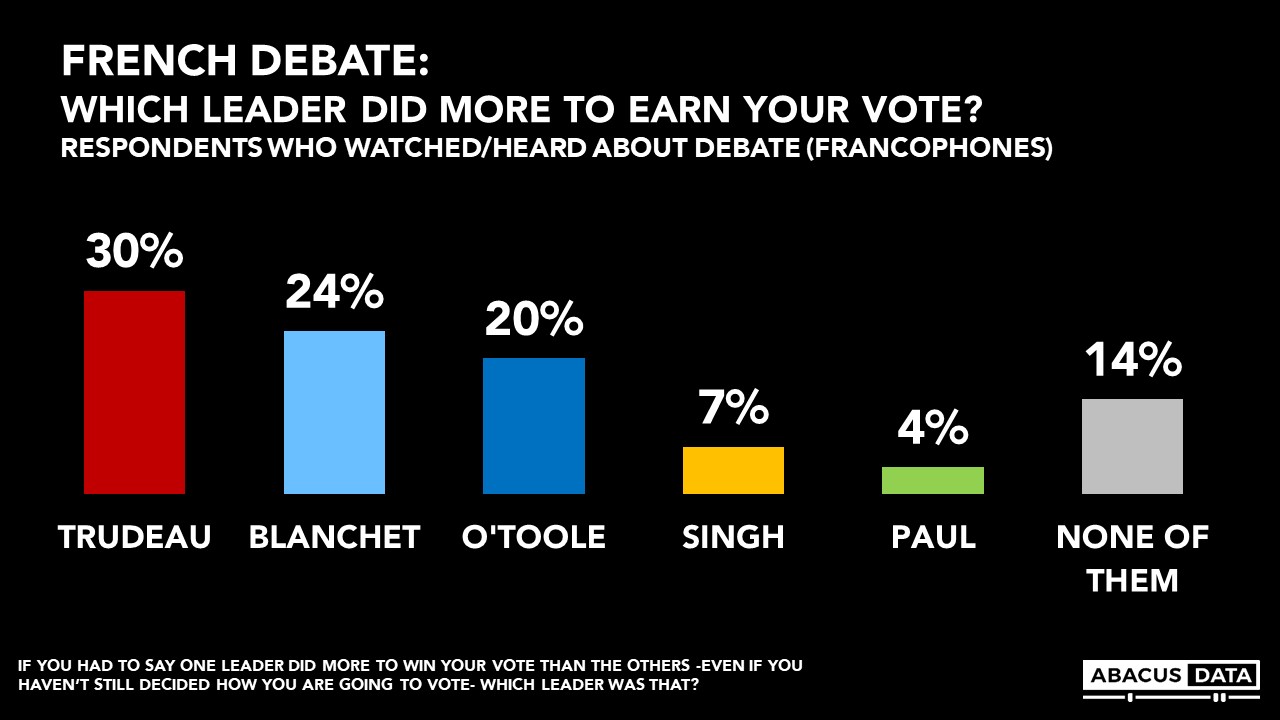
For the French debate, four of the five leaders left more positive than negative impressions, with Mr. Blanchet (+25), Mr. Trudeau (+14), Mr. Singh (+8), and Mr. O’Toole (+7). More said Ms. Paul’s performance left a negative view than a positive one (-13).

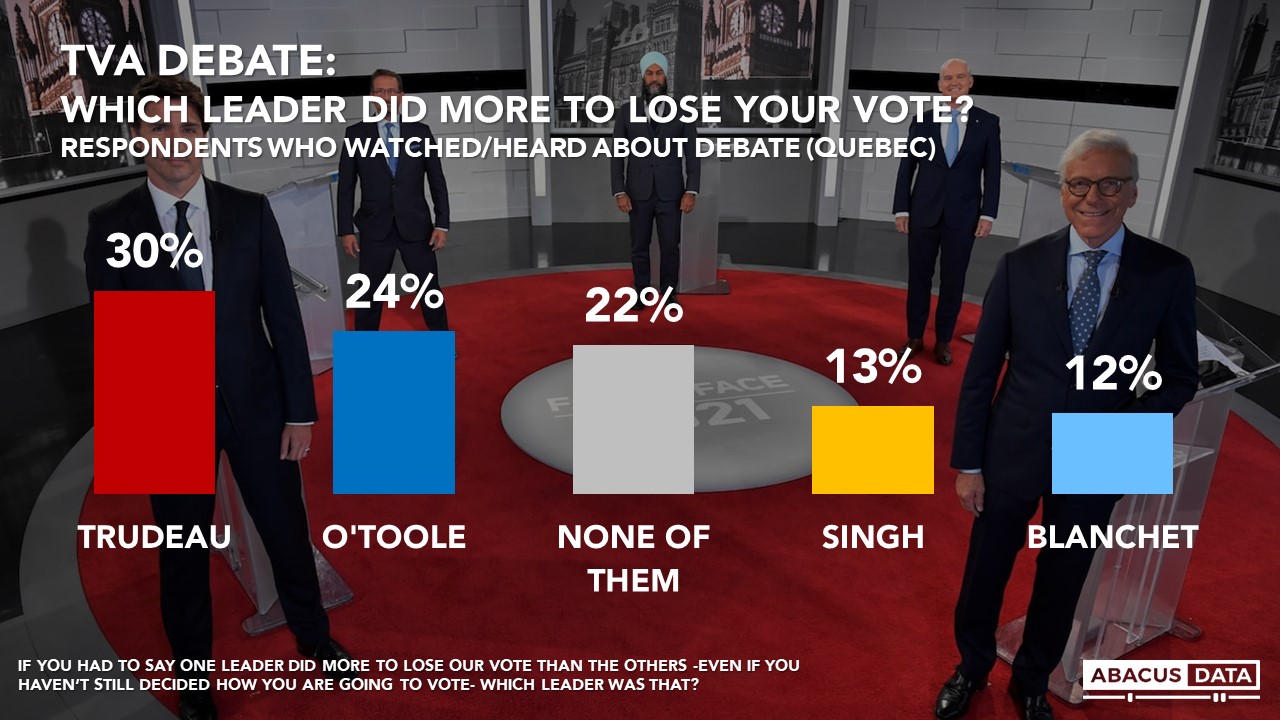
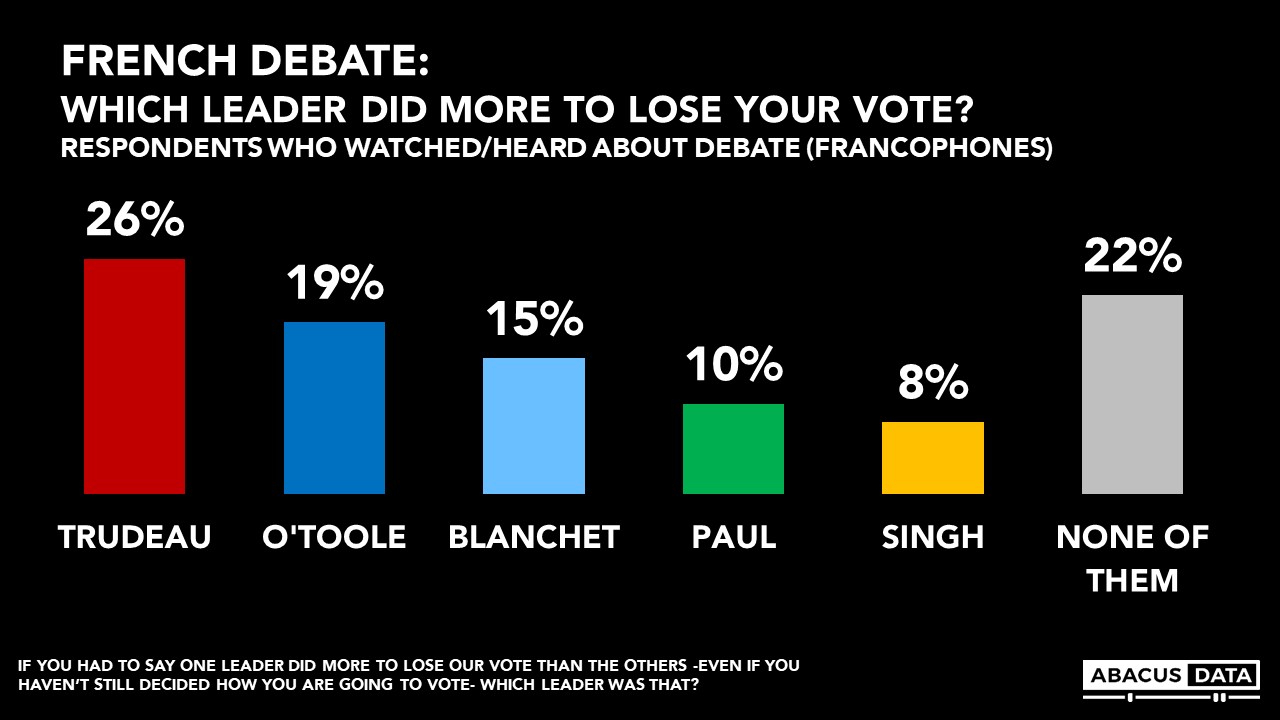
When asked which leader did the most to earn their vote, Justin Trudeau was the choice of 30% ahead of Mr. Blanchet 24% and Mr. O’Toole at 20%. When asked which leader did the more to lose their vote, Mr. Trudeau also came out on top with 26% selecting the Liberal leader followed by Mr. O’Toole at 19%, and Mr. Blanchet at 15%.
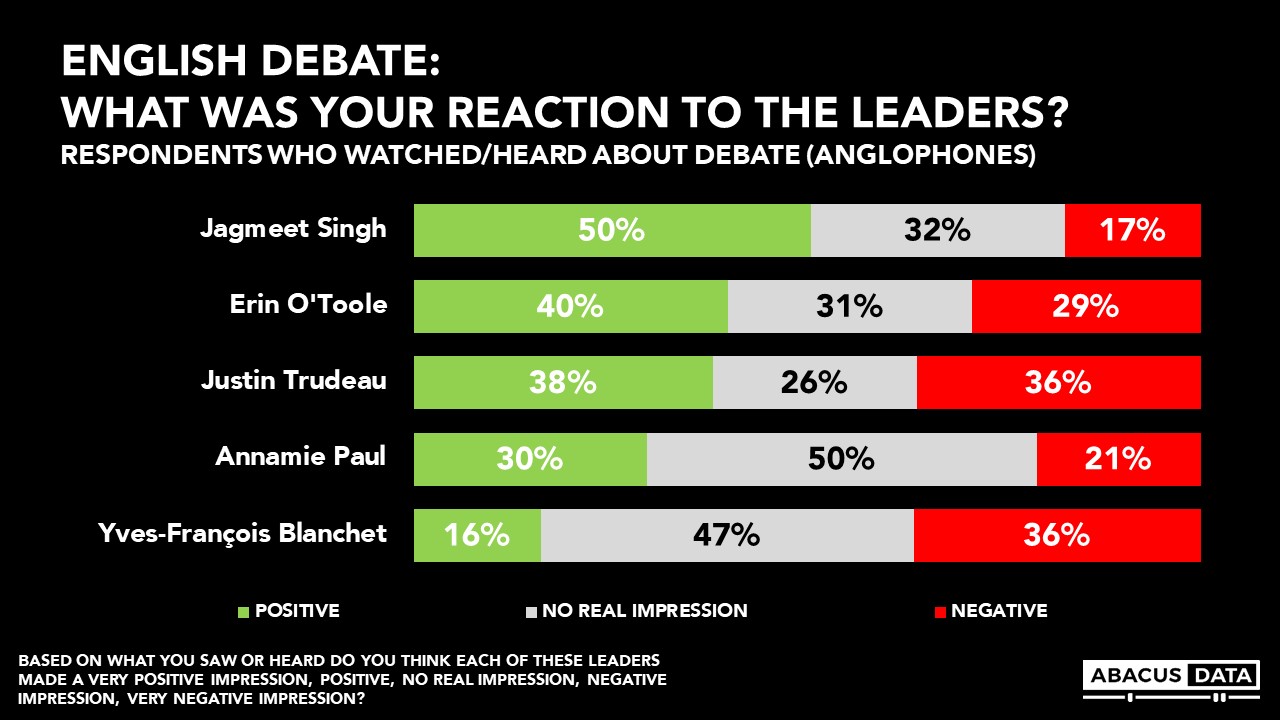
For the English debate, four of the five leaders left more positive than negative impressions, led by Mr. Singh (33), Mr. O’Toole ( +11), Mr. Trudeau (+2), Ms Paul (+9). Mr. Blanchet was the only leader who had a net negative reaction (-20).
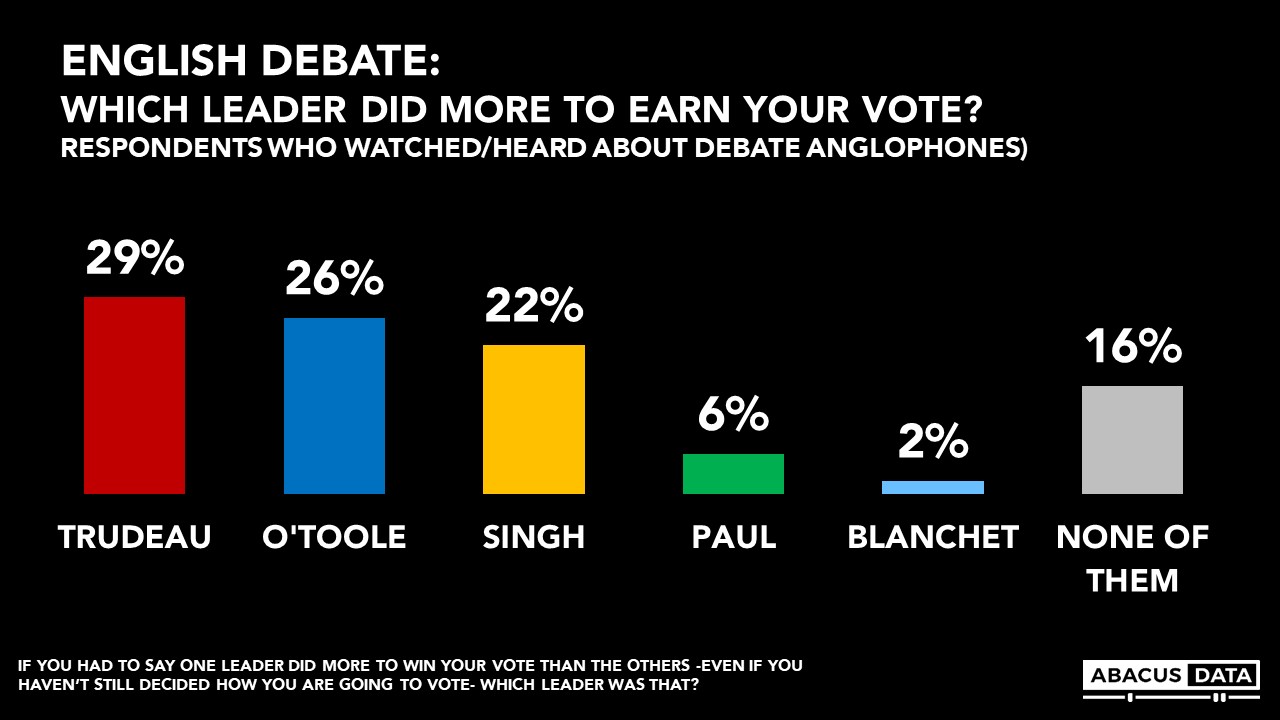
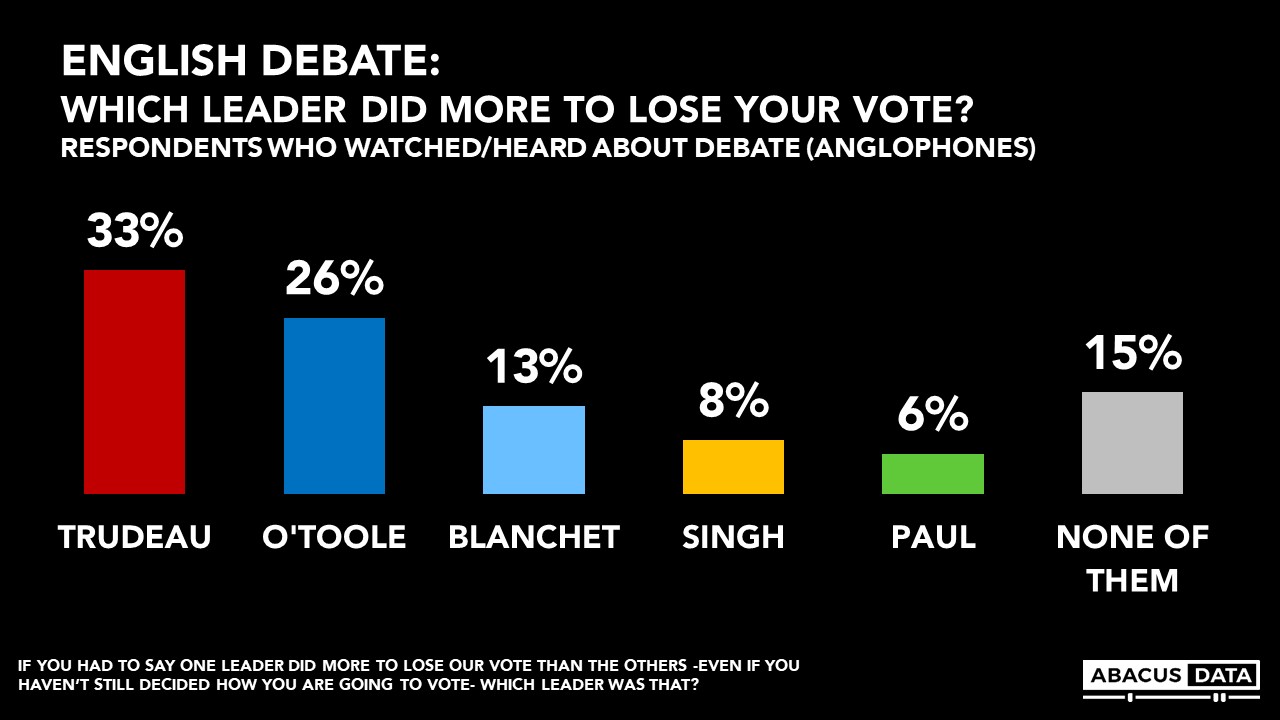
When asked which leader did the most to earn their vote, Justin Trudeau was the choice of 29% slightly ahead of Mr. O’Toole at 26% and Mr. Singh at 22%. When asked which leader did the more to lose their vote, Mr. Trudeau also came out on top with 33% selecting the Liberal leader followed by Mr. O’Toole at 26%, and Mr. Singh at 8%.
Overall, reaction to the debate was largely aligned with one’s vote inclination.
• 69% of LPC supporters felt Mr. Trudeau did the most to earn their vote.
• 76% of CPC supporters felt Mr. O’Toole did the most to earn their vote
• 69% of NDP supporters thought Mr. Singh did the best.
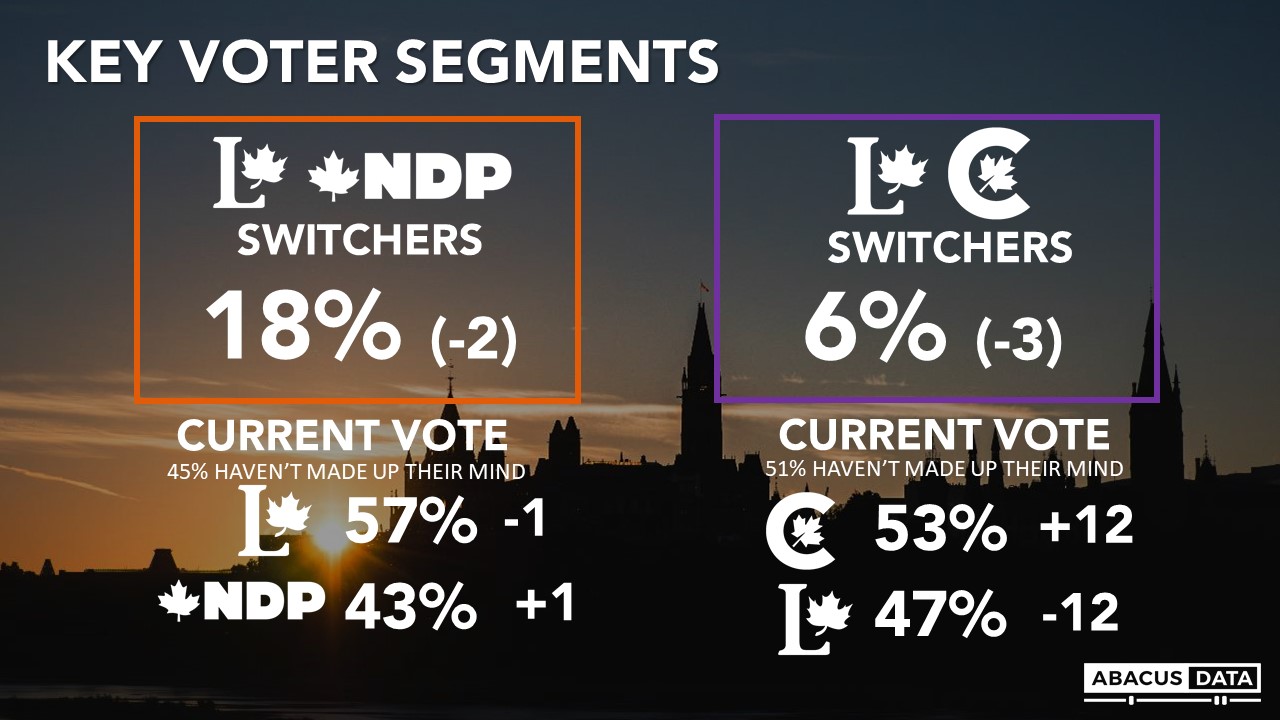
Among LPC/NDP switchers, 46% thought Mr. Trudeau did the best, 34% picked Mr. Singh.
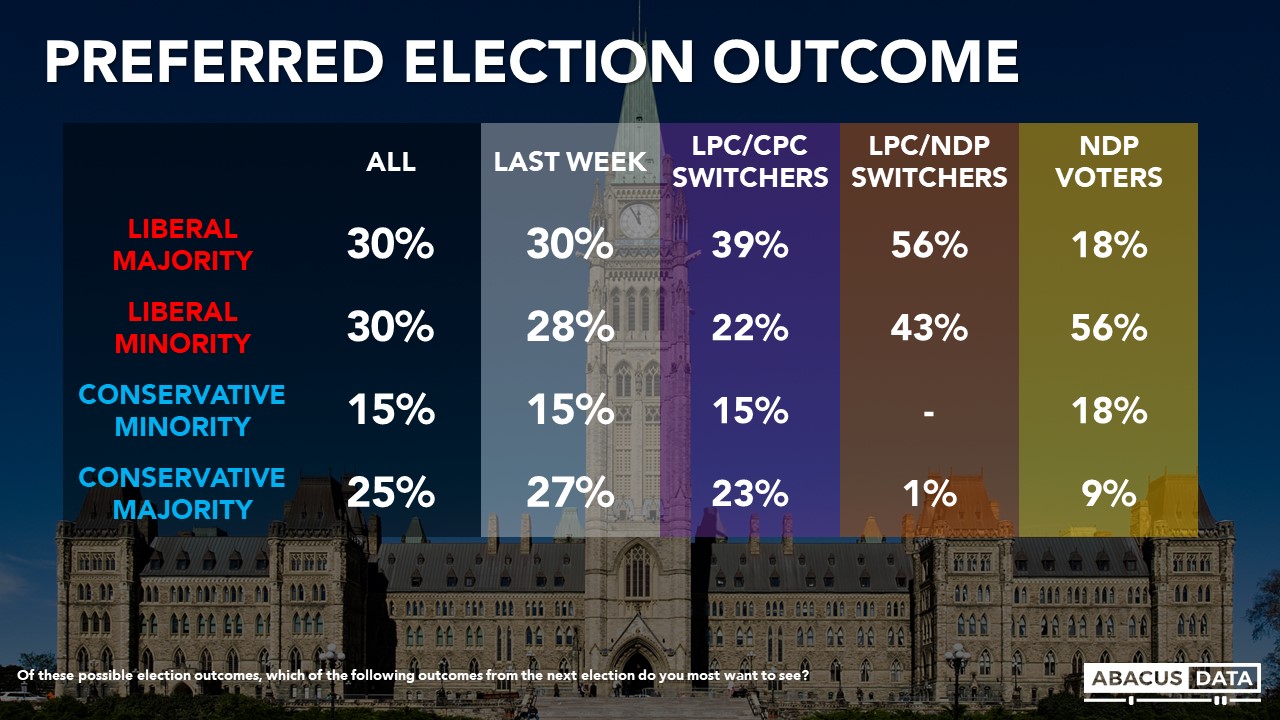
PREFERRED ELECTION OUTCOME
Asked which of four (most likely based on today’s numbers) outcomes they would prefer, 60% would prefer a Liberal victory (30% majority, 30% minority) while 40% would prefer a Conservative win (15% minority, 25% majority). This is mostly unchanged from our last survey.
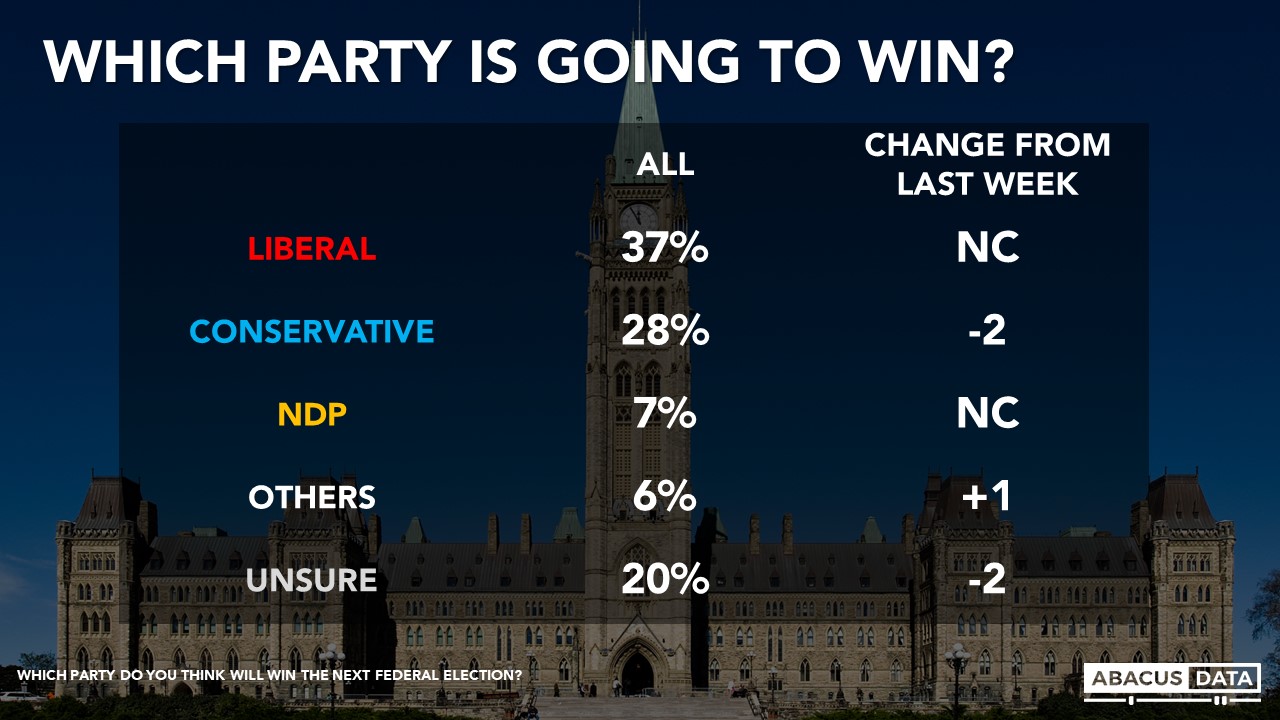
EXPECTED ELECTION OUTCOME
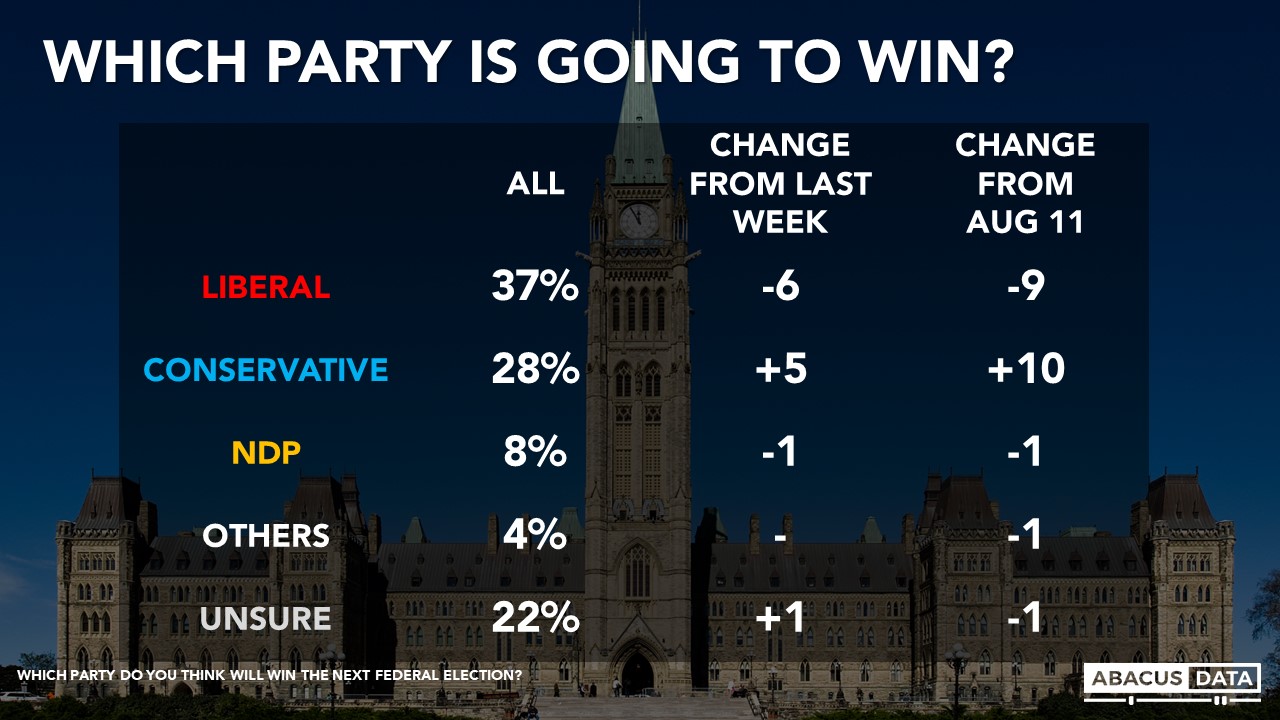
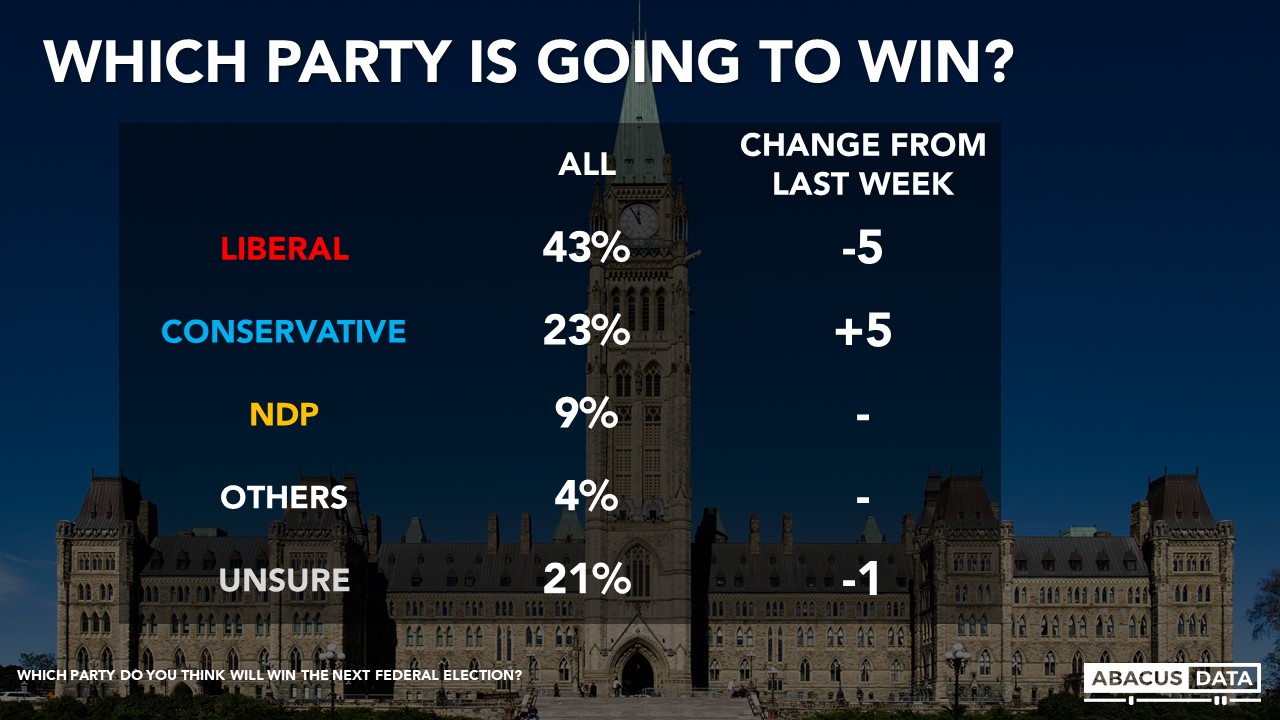
As of today, 37% expect the Liberals to win (unchanged from our last poll), followed by 28% who expect the Conservatives to win (down 2 since the last wave and +10 since the start of the campaign), and 7% who expect the NDP to come out on top.
When asked whether the election will be close or will one party win by a lot, 75% think it will be close (up 4 points) while 13% think one party will win by a lot. 12% are not sure. Among LPC/NDP switchers 82% think it will be close.
Those who would prefer the LPC to win but think the Conservatives are going to win makes up 5% of the electorate – holding steady from last week.
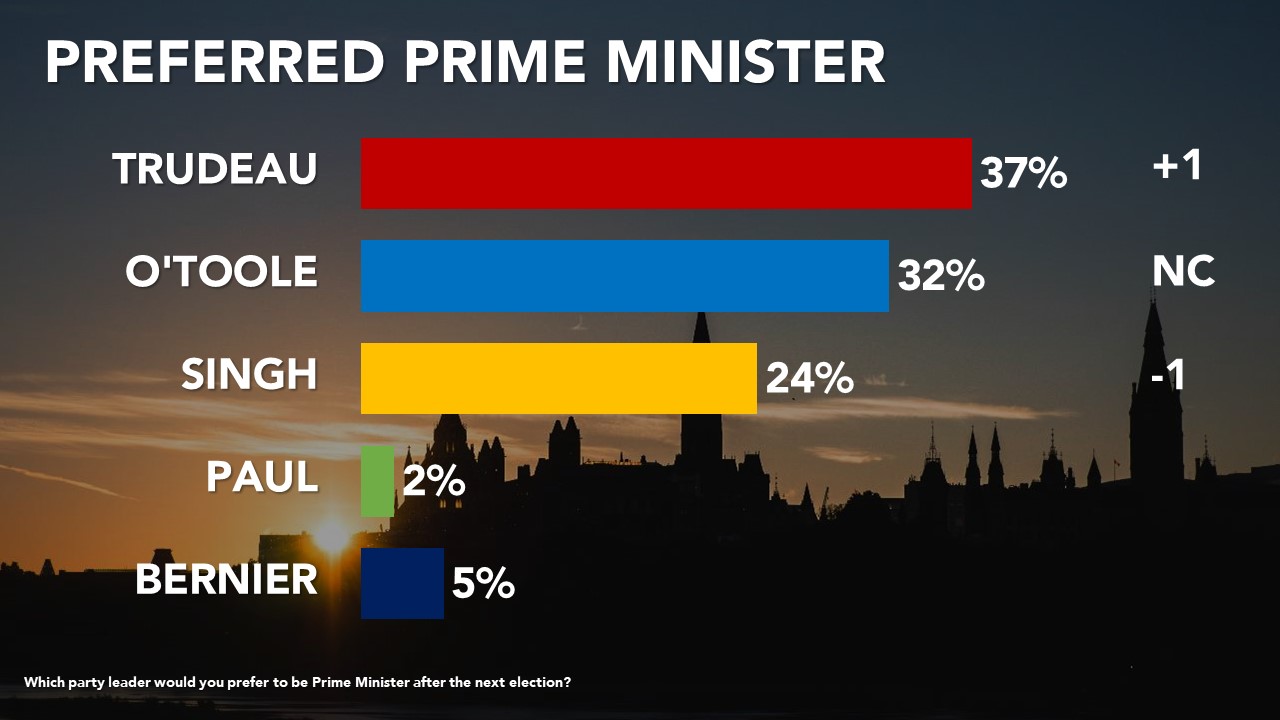
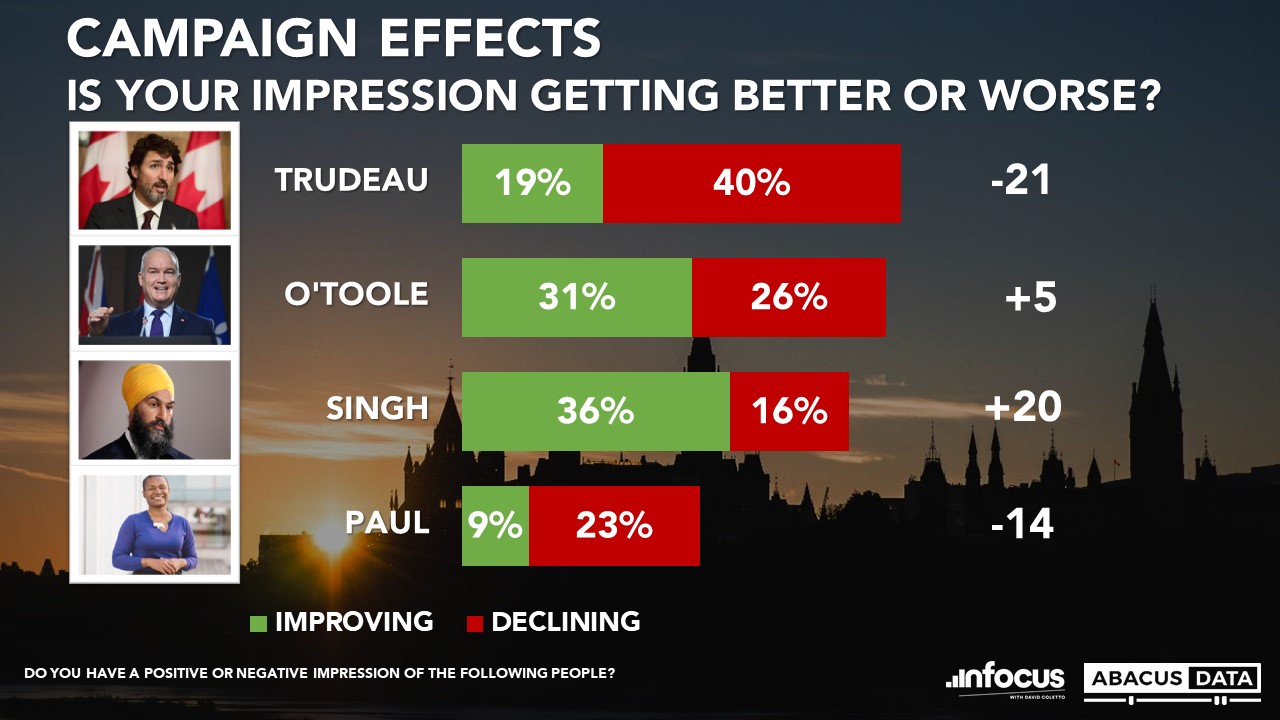
LEADER IMPRESSIONS
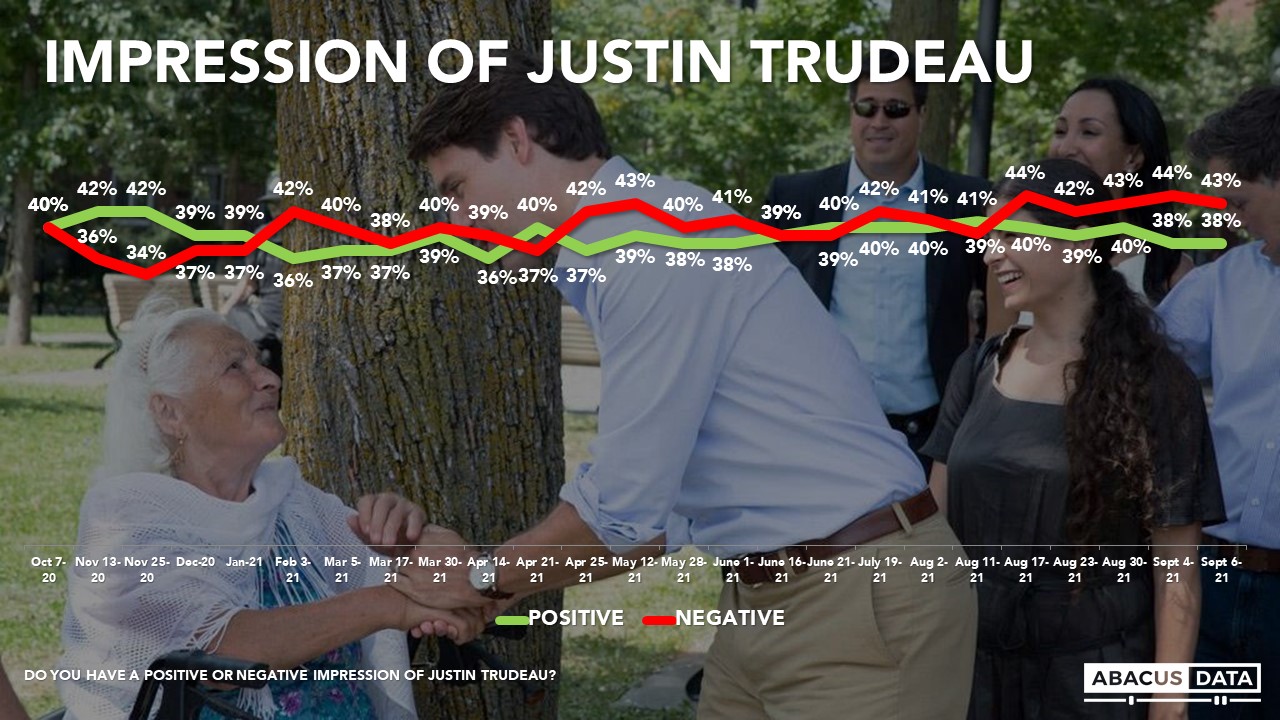
Justin Trudeau enjoys a positive impression among 40% and negative impressions among 43%, for a net score of -3. This is a slight increase in positives for Mr. Trudeau. Regionally, Mr. Trudeau’s net favourables are -2 in BC, -39 in Alberta, -18 in SK/MB, +2 in Ontario, +2 in Quebec, and +30 in Atlantic Canada. Among Liberal/NDP switchers Trudeau is +65. Among Liberal/Conservative switchers he is +53.

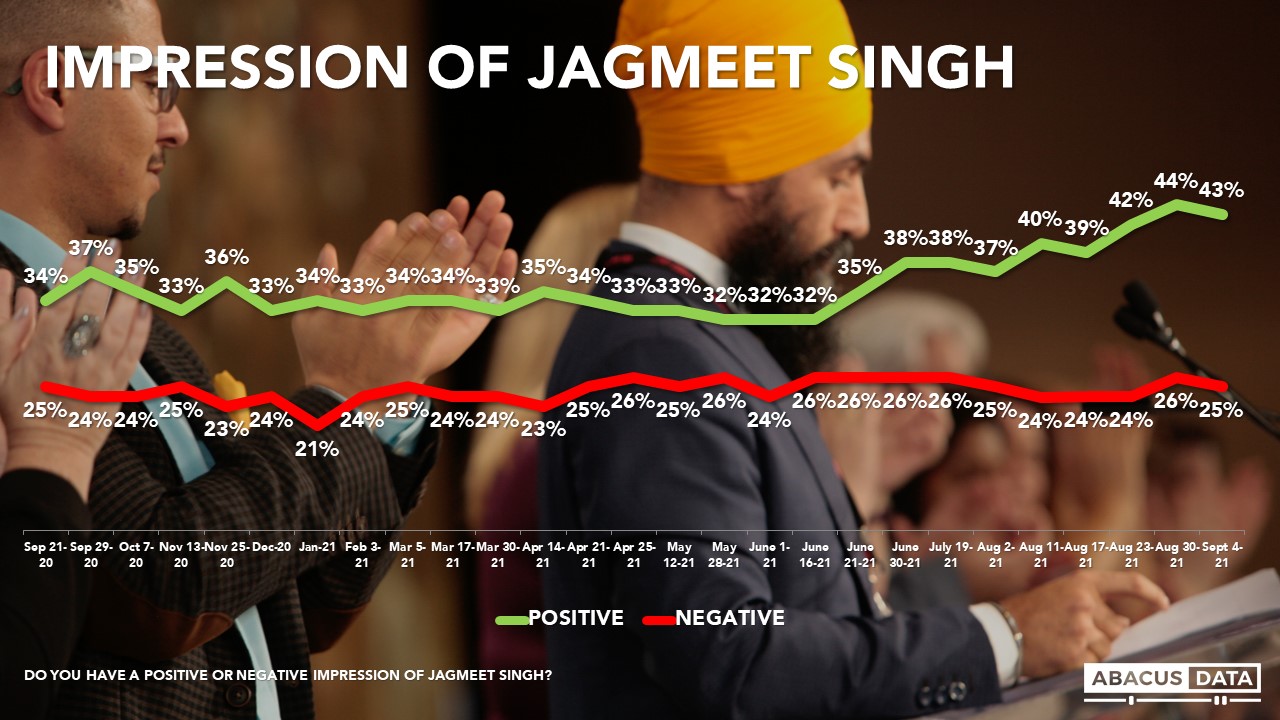
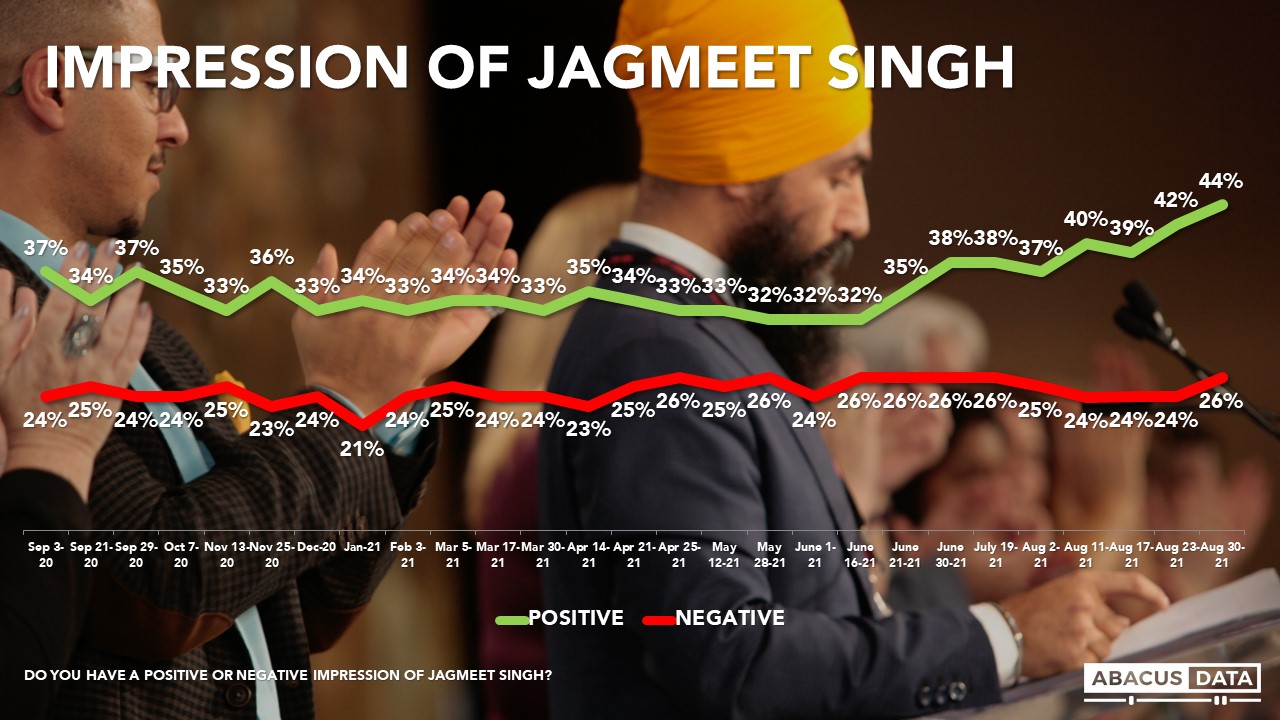
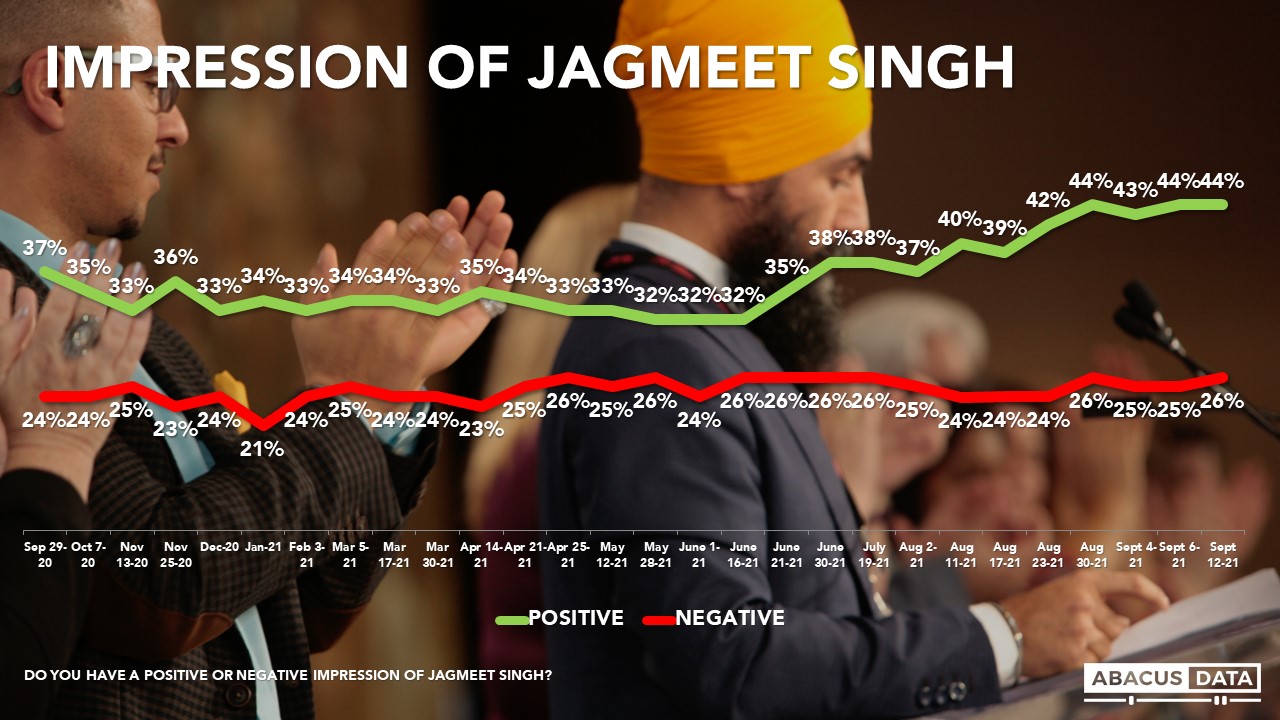
Jagmeet Singh enjoys a positive impression among 44% and finds negative impressions among 26% for a net score of +18.
Regionally, Mr. Singh’s net favourables are +29 in BC, +15 in AB, +17 in SK/MB, +26 in Ontario, -2 in Quebec, and +28 in Atlantic Canada. Among Liberal/NDP switchers Singh is +75.
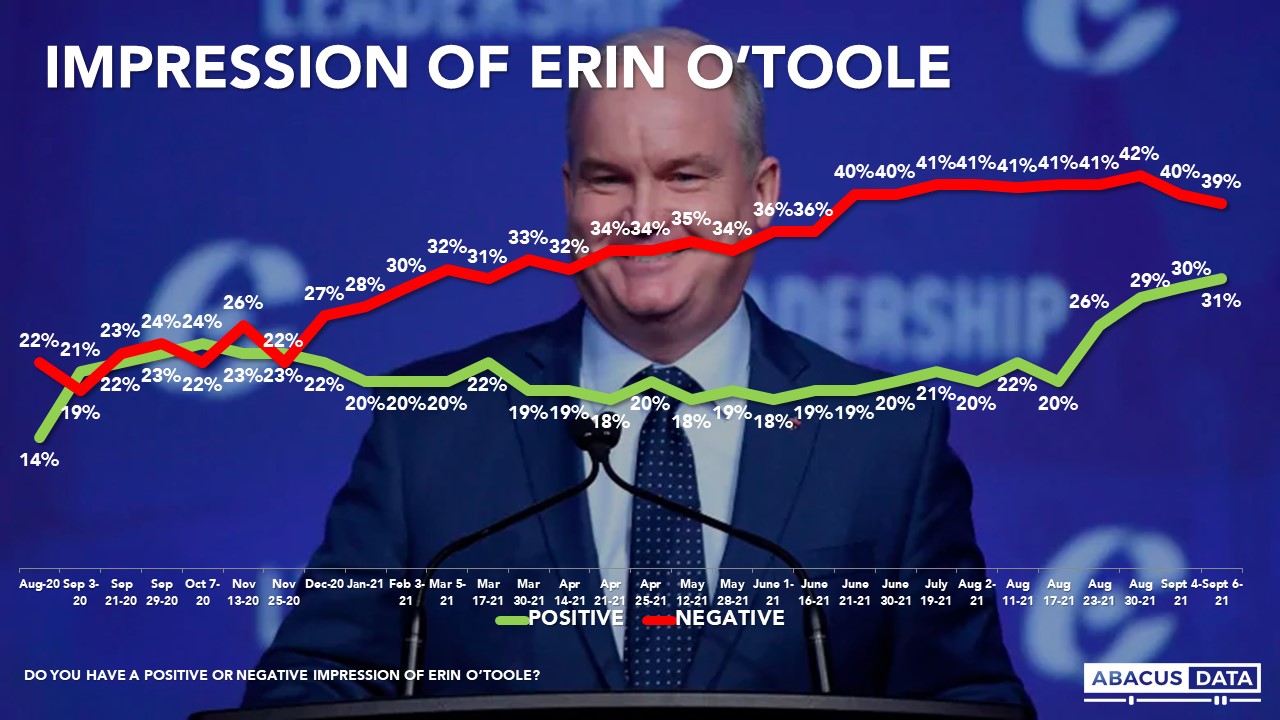
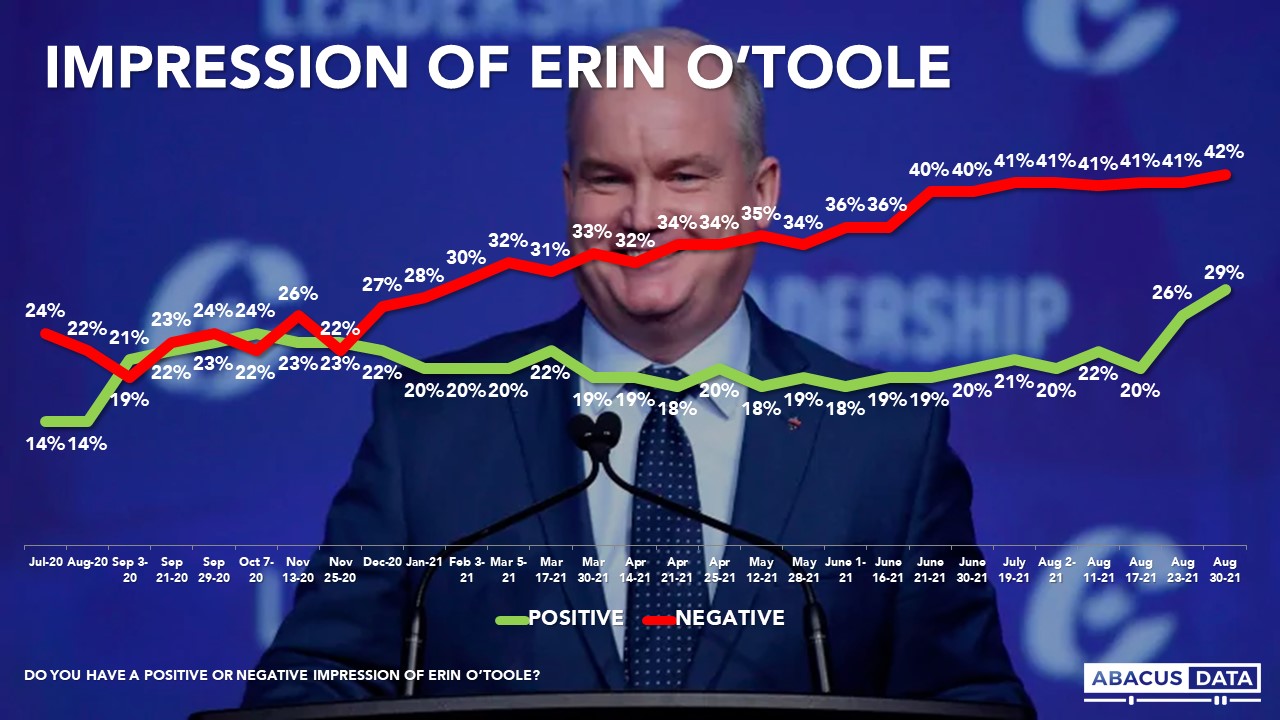
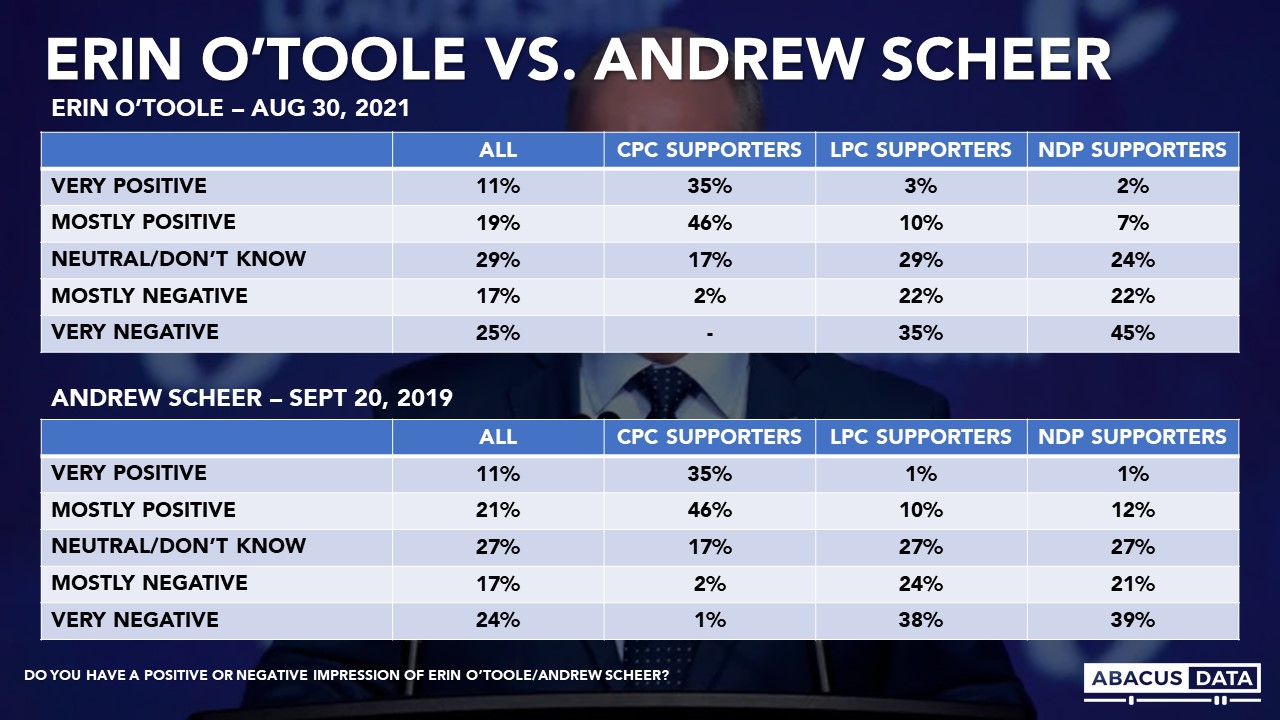
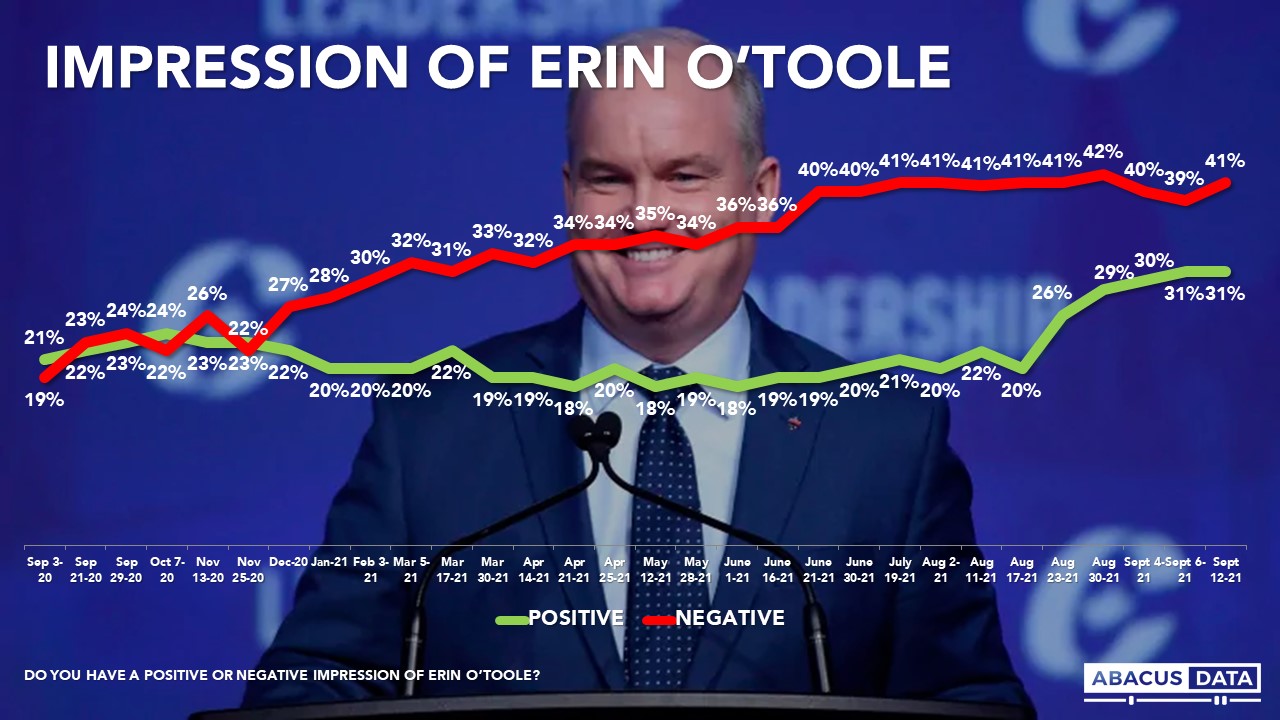
Today 31% have a positive impression of the Conservative leader Erin O’Toole unchanged) while his negatives are at 41% (+2) for a net score of -10.
Regionally, Mr. O’Toole’s net favourables are -13 in BC, +10 in AB, -5 in SK/MB, -6 in Ontario, -21 in Quebec, and -23 in Atlantic Canada. Among Liberal/Conservative switchers O’Toole is +49.
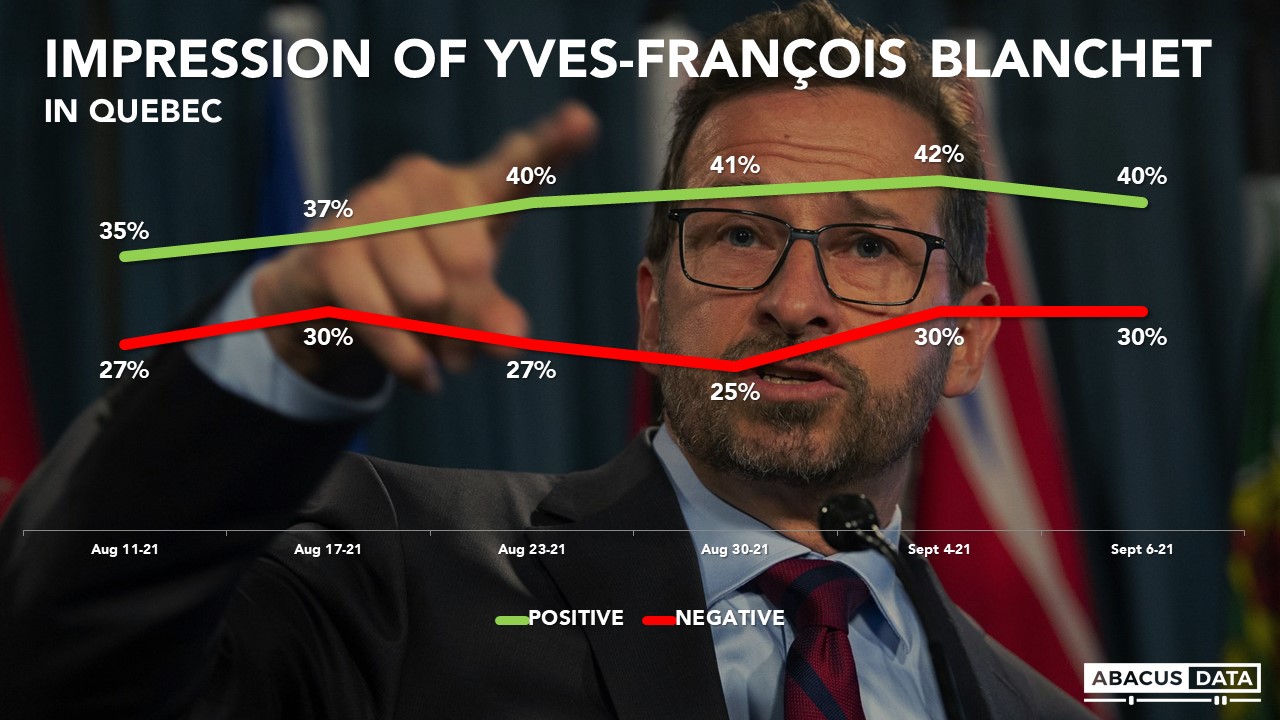
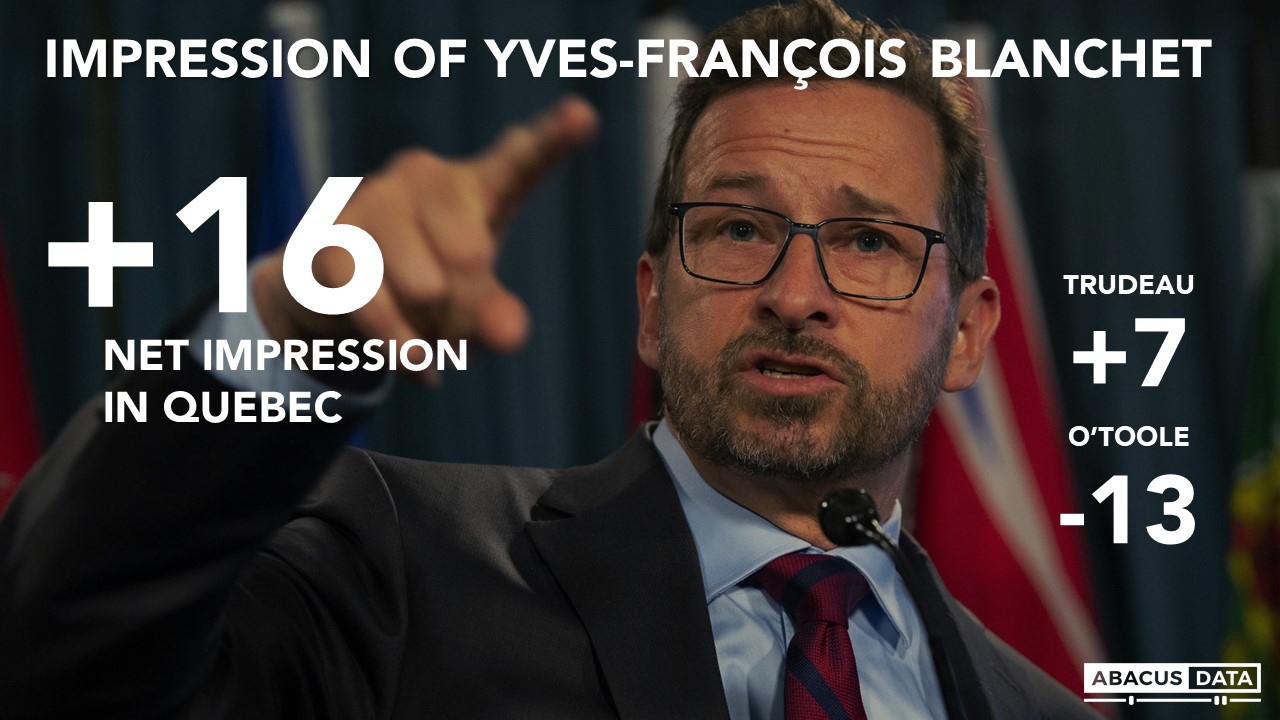
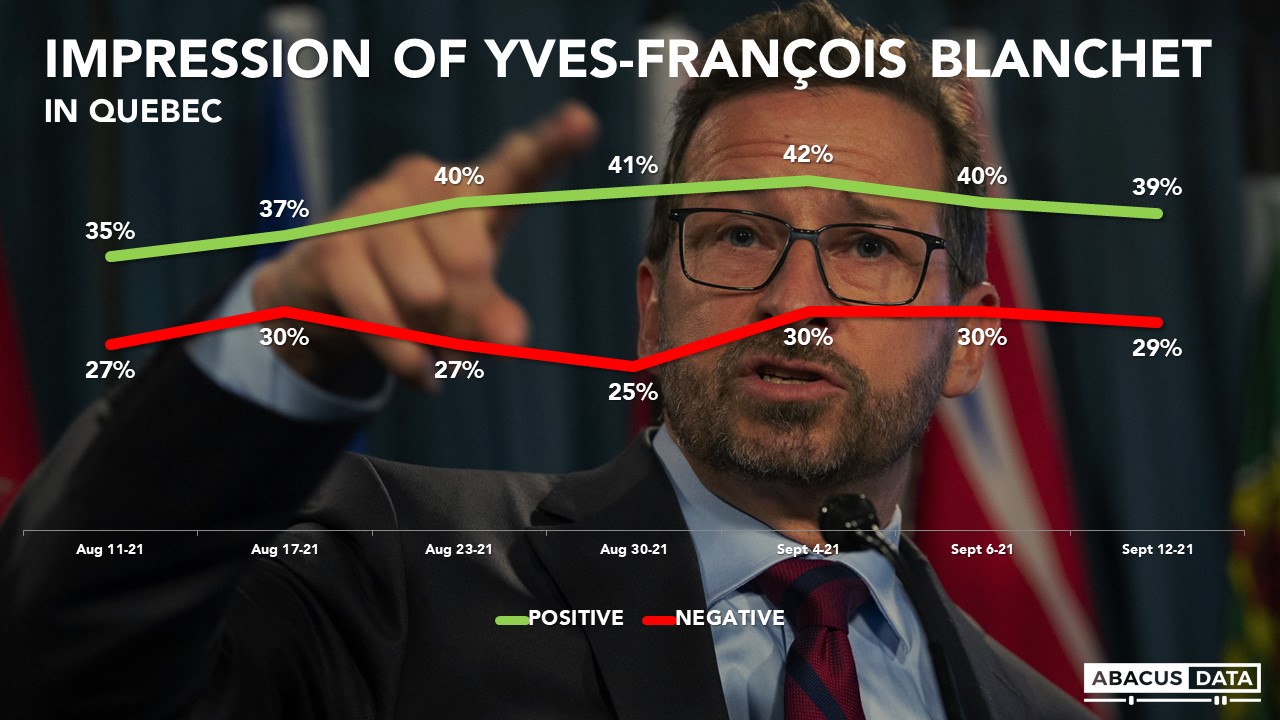
In Quebec, BQ Leader Mr. Blanchet is 39% positive and 29% negative for a net score of +10. Mr. Blanchet’s is largely unchanged from the last wave.
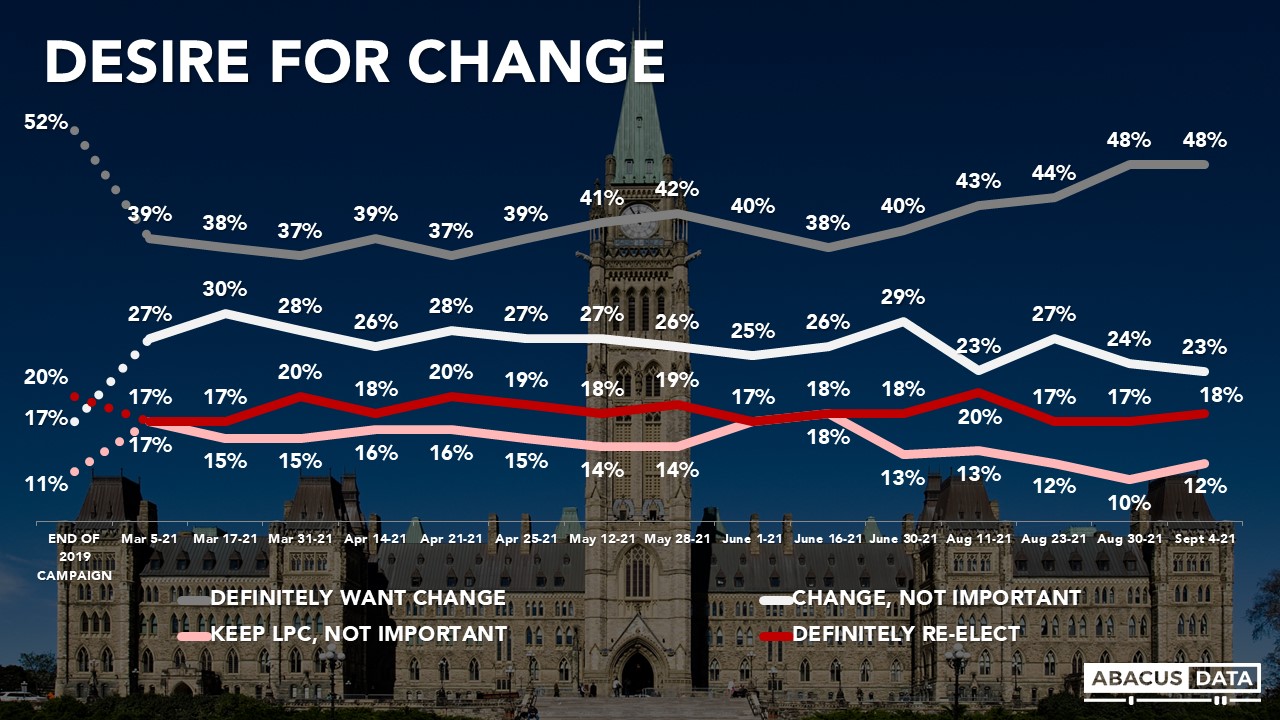
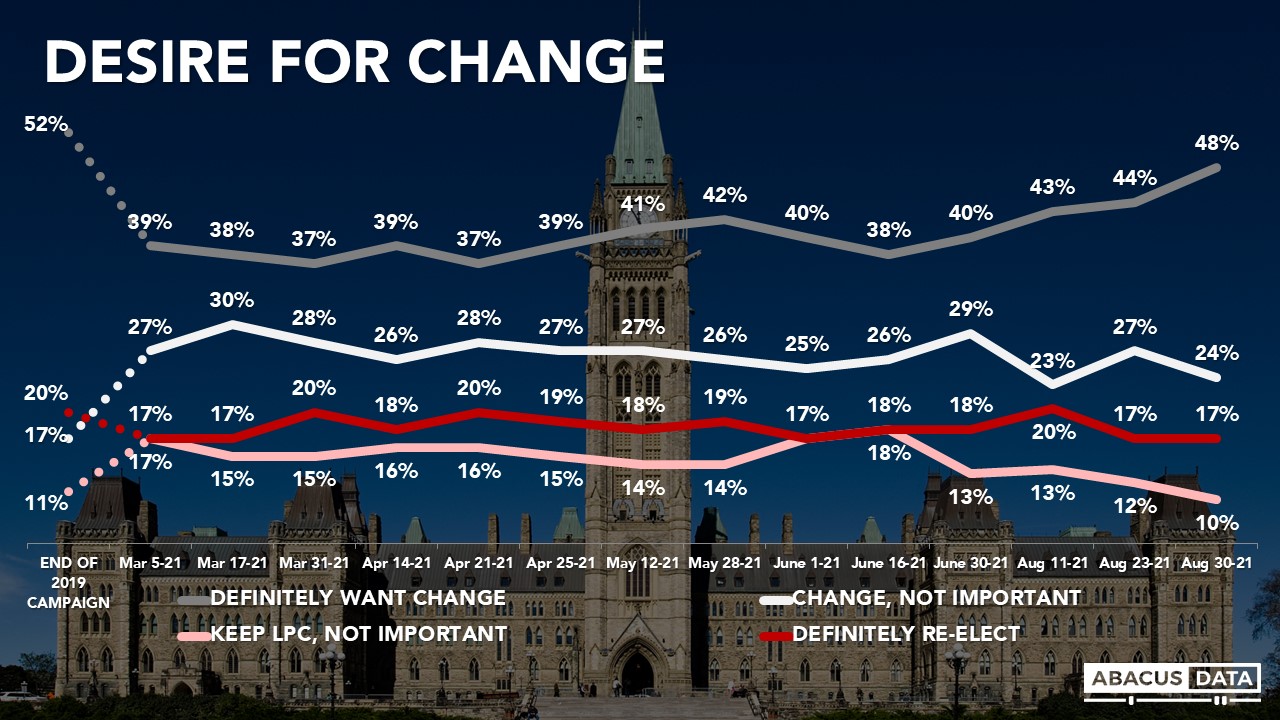
DESIRE FOR CHANGE
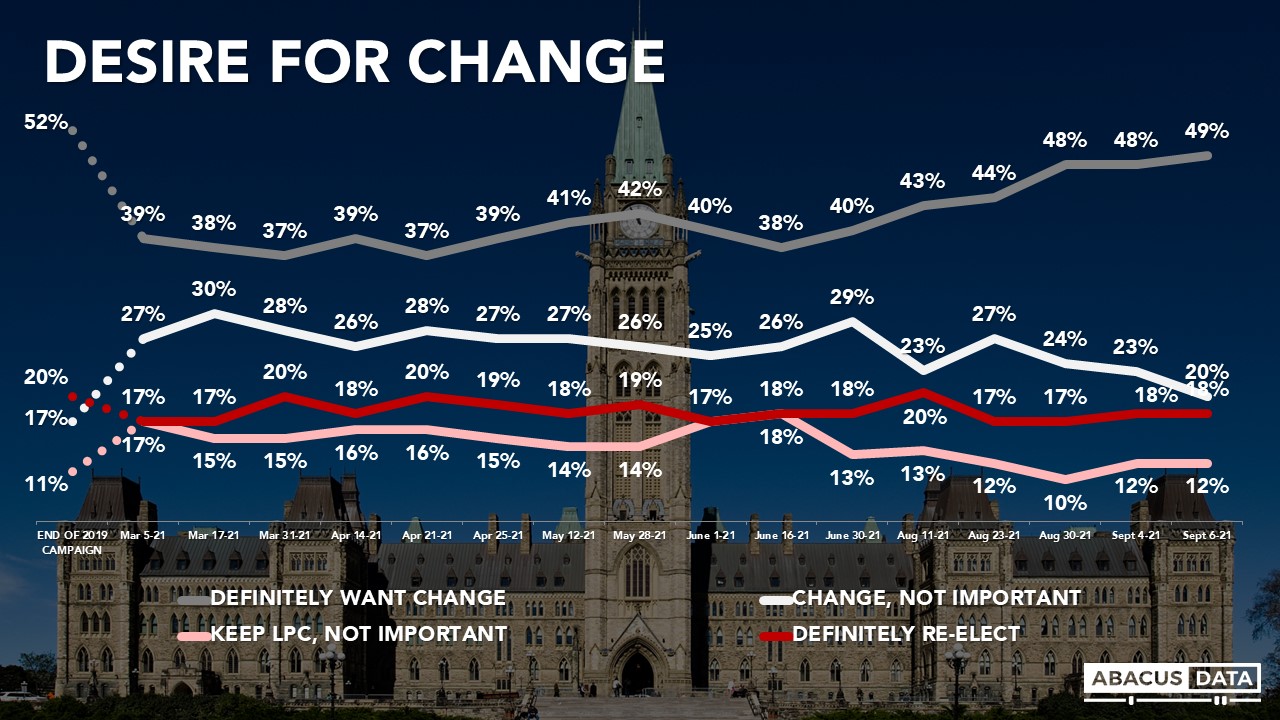
Today, 49% definitely want to see a change in government (unchanged from last week) while another 21% say it would be good to have a change, but it is not really that important to them (up 1), for a total of 70% who would prefer a change in government.
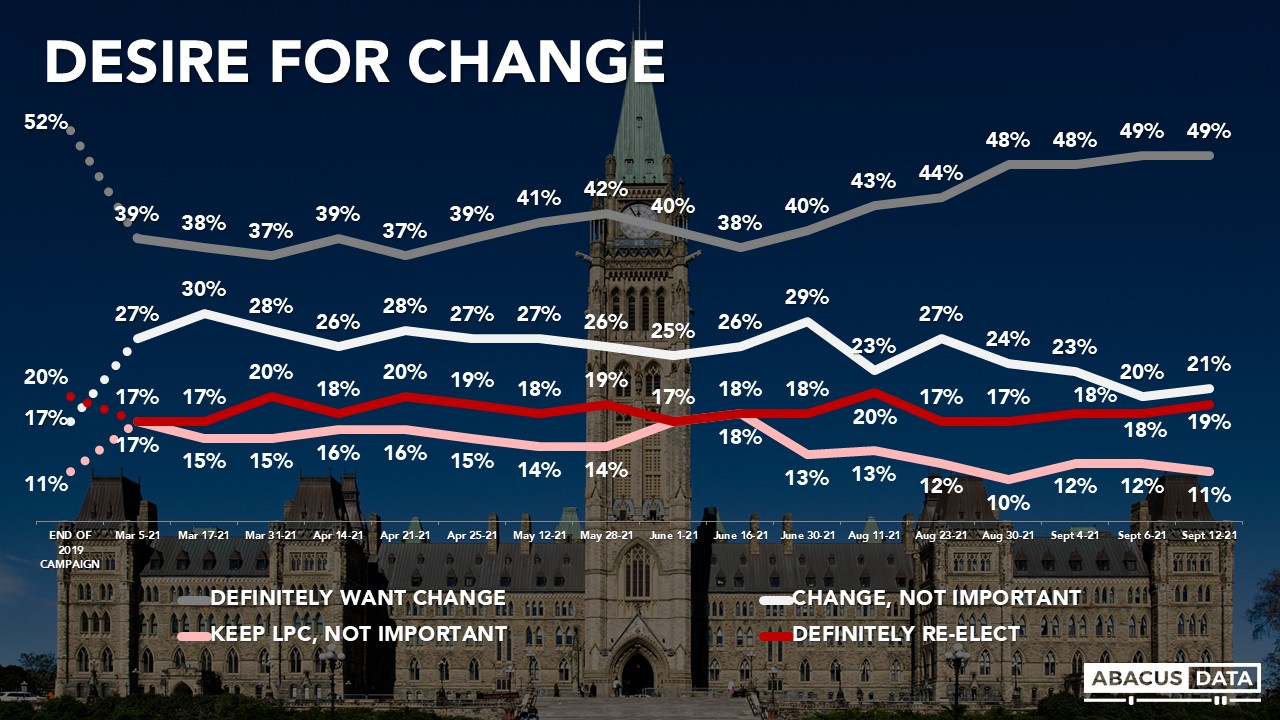
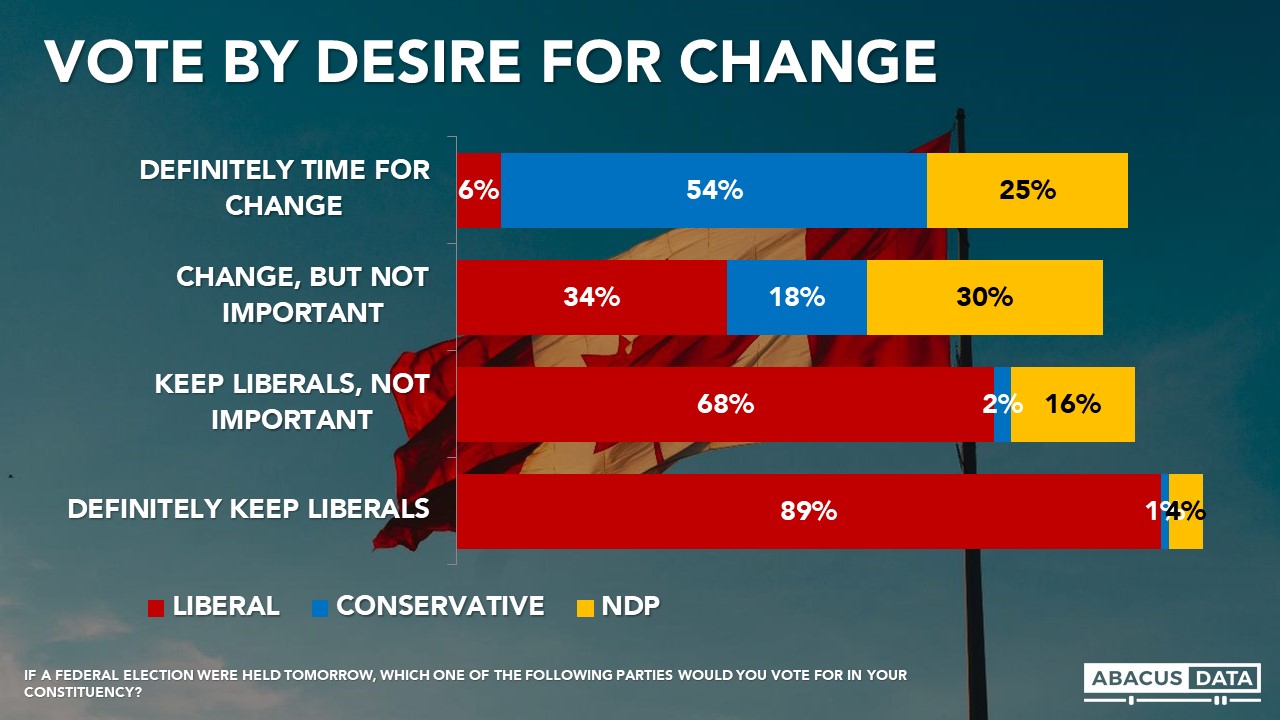
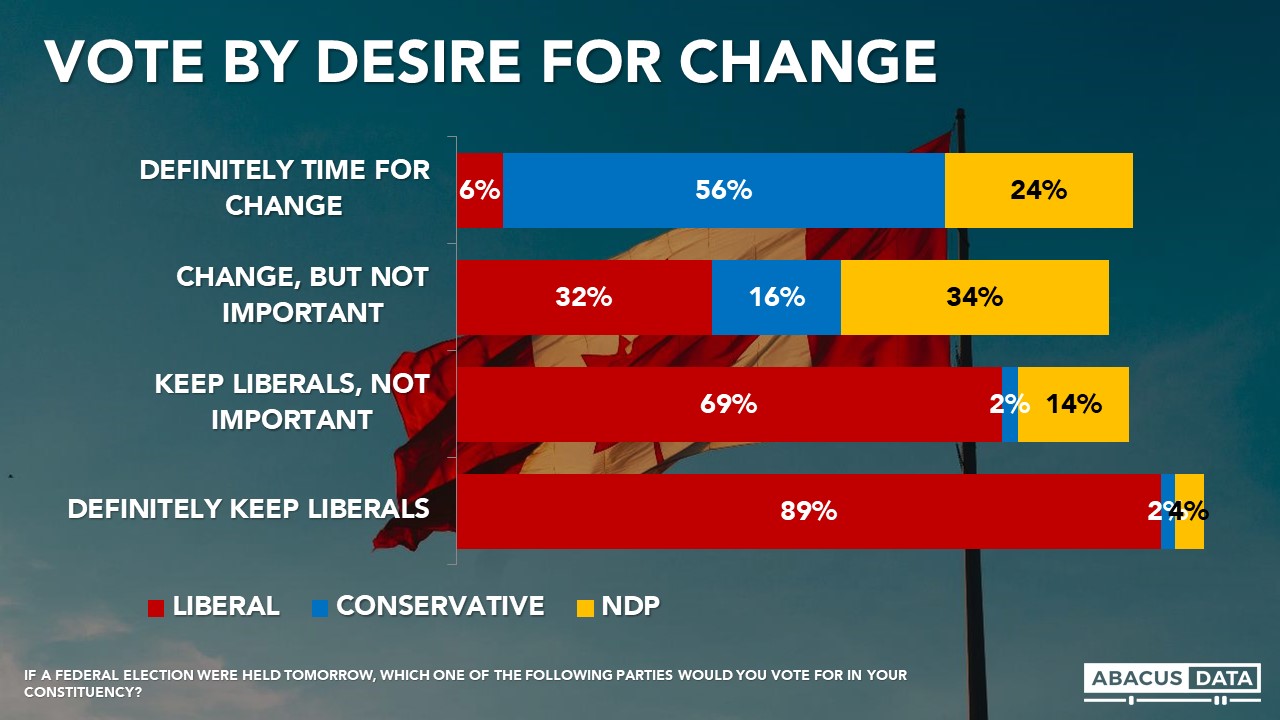
The vote preference by change group is important to understanding the election. Among those who prefer change but say it isn’t that important to them (21% of the electorate at the moment), the Liberals have opened up a 13-point lead over the NDP with the Conservatives in third. Liberal re-election hopes continue to ride on how this group ultimately leans and Mr. Trudeau’s party seem to be gaining over timing.
Among those who say they want to keep the Liberals in office but it’s not important to them, 74% would vote Liberal compared with 9% who would vote NDP.

UPSHOT
According to Bruce Anderson: “The debates are over and the campaign enters its final week with more good news for the Liberals than for their competitors, although the outcome is far from clear. Mr. O’Toole’s reputation gains have stalled, and the Liberals have gained some precious margin in Ontario and Quebec. BC looks like a vital and potentially determining race. Perhaps the most important news in this poll for the Liberals is that the desire for change may be softening and among those who were leaning towards a change but not committed to that position, the Liberals find more support this week.
None of the leaders performed badly enough to affect their prospects in this election, and it’s arguable that the PM accomplished more of what he needed to accomplish than his main rivals did in the debates.”
According to David Coletto: “With a week to go the race remains tight nationally but the Liberals have opened up some leads in vote-rich Ontario and Quebec. Right now, the Liberals have the advantage as the debates don’t seem to have made much difference except for reinforcing some pre-existing ideas people had of the leaders.
In my opinion, the most important data point in this release is the question about the desire for change. At 49%, those definitely wanting a change in government remain below the 2019 number and has hasn’t moved in a few weeks now.
Instead of articulating a clear rationale for why the Liberals should be replaced, the Conservative and NDP campaigns have focused on the election call itself. Undoubtedly people are annoyed by the election, but so far, it doesn’t look like either has made much progress in convincing past Liberal voters to switch their support.
Because they have repeatedly claimed this election was “unnecessary” they may have inadvertently helped the Liberals buffer against growth in a desire for change.”
METHODOLOGY
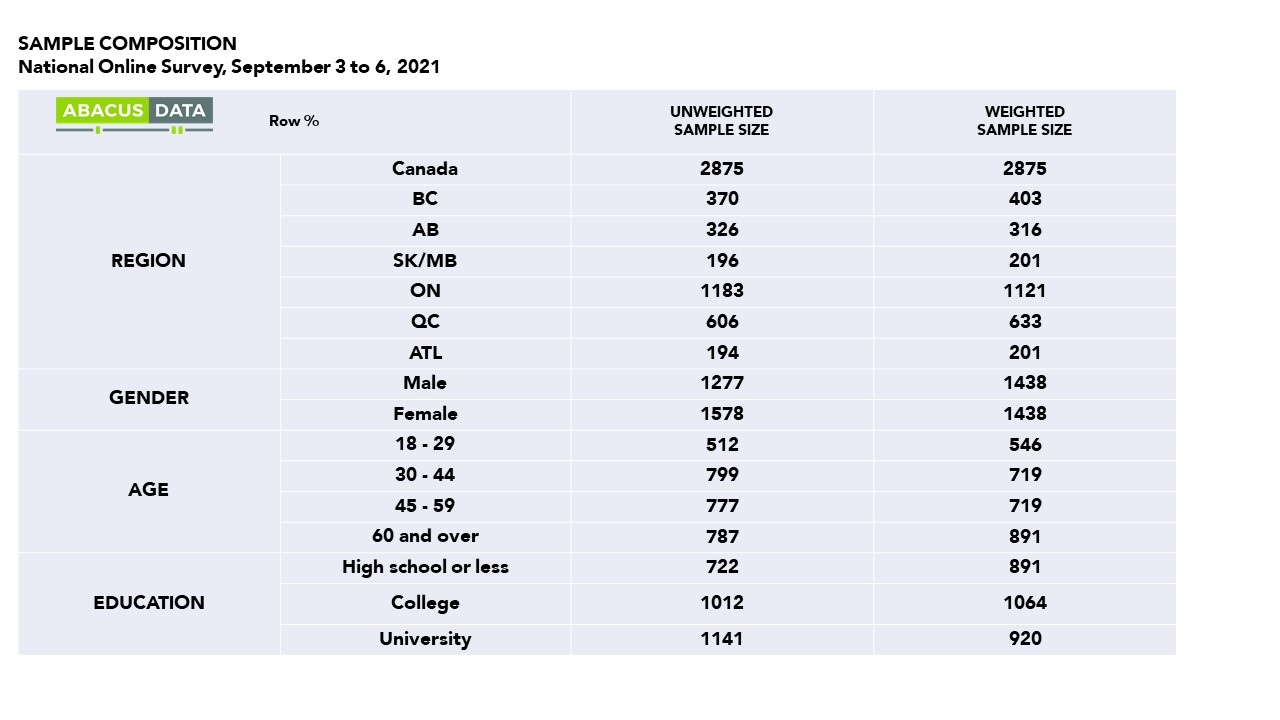
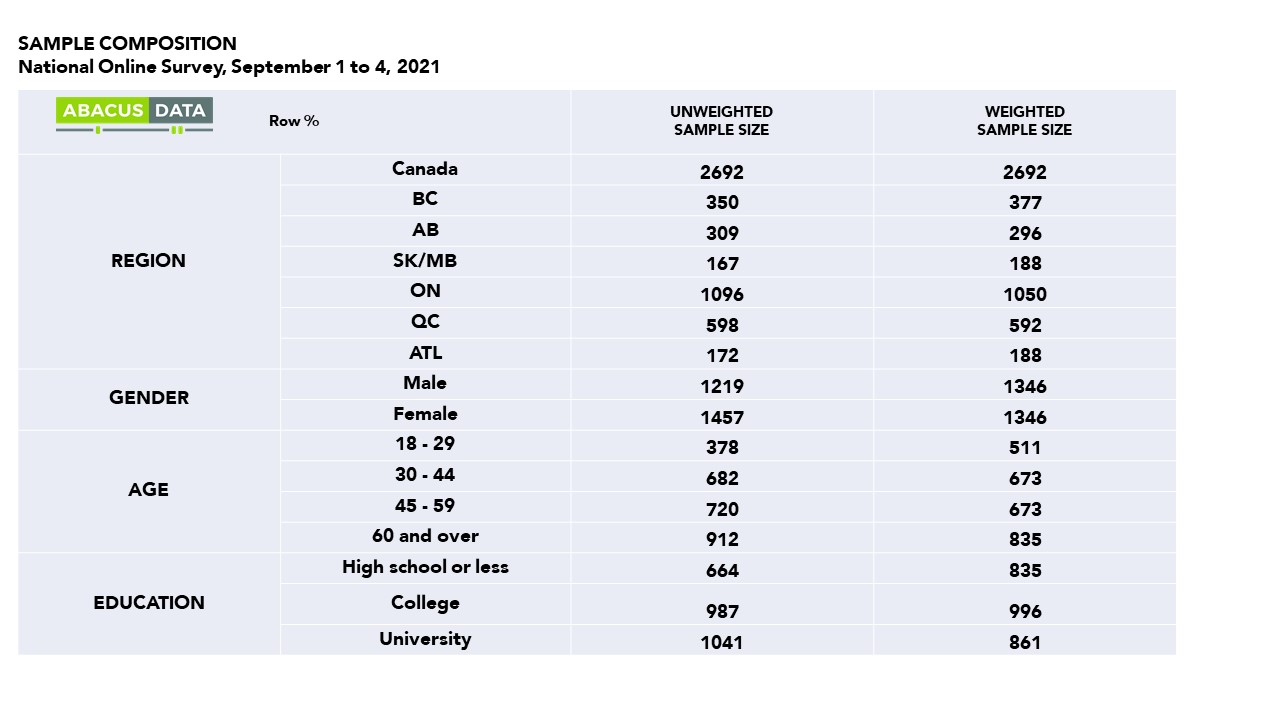
The survey was conducted with 2,000 Canadian adults eligible to vote from September 10 to 12, 2021. A random sample of panelists were invited to complete the survey from a set of partner panels based on the Lucid exchange platform. These partners are typically double opt-in survey panels, blended to manage out potential skews in the data from a single source.
The margin of error for a comparable probability-based random sample of the same size is +/-2.1%, 19 times out of 20.
The data were weighted according to census data to ensure that the sample matched Canada’s population according to age, gender, educational attainment, and region. Totals may not add up to 100 due to rounding.
This survey was paid for by Abacus Data Inc.
Abacus Data follows the CRIC Public Opinion Research Standards and Disclosure Requirements that can be found here: https://

ABOUT ABACUS DATA
We are the only research and strategy firm that helps organizations respond to the disruptive risks and opportunities in a world where demographics and technology are changing more quickly than ever.
We are an innovative, fast-growing public opinion and marketing research consultancy. We use the latest technology, sound science, and deep experience to generate top-flight research-based advice to our clients. We offer global research capacity with a strong focus on customer service, attention to detail and exceptional value.
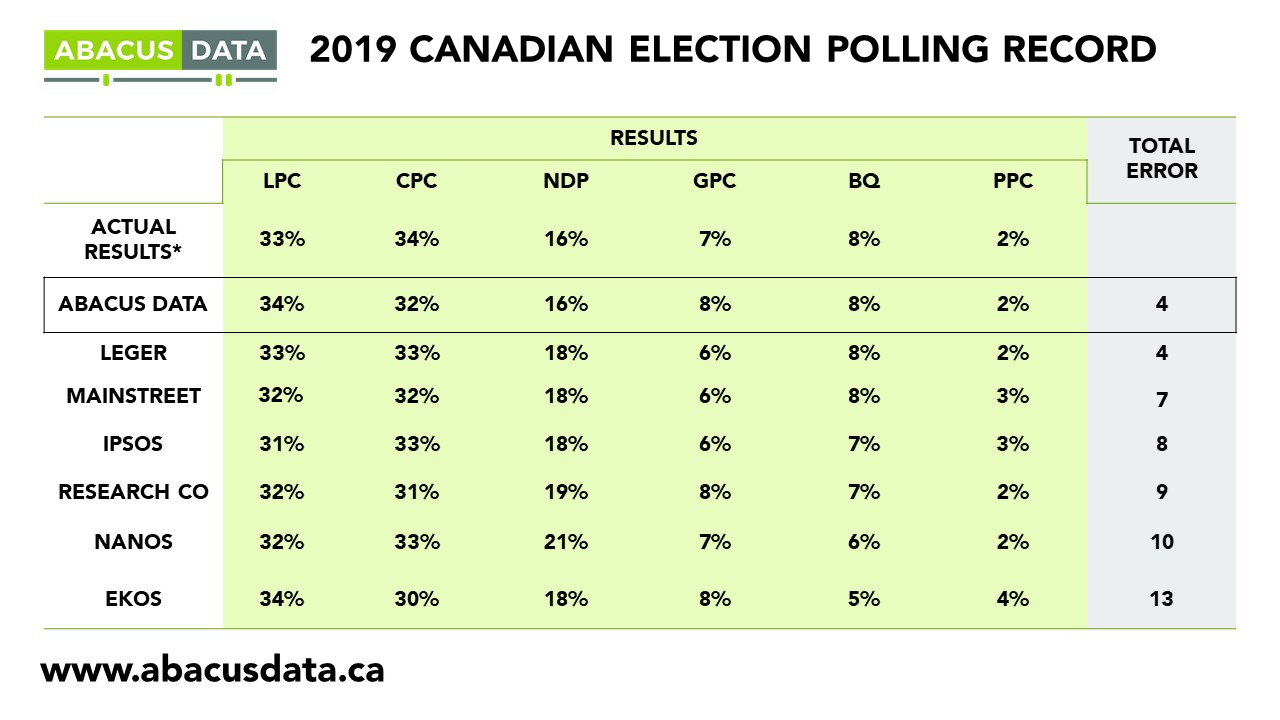
We were one of the most accurate pollsters conducting research during the 2019 Canadian Election.
Contact us with any questions.
Find out more about how we can help your organization by downloading our corporate profile and service offering.