Abacus Poll: UCP leads NDP in Alberta with one week to go.
May 22, 2023
After the leaders’ debate last Thursday, we launched our second last survey of the campaign to gauge what impact the debate and campaign may be having on voting intentions. The survey was conducted from May 19 to 22, 2023, and surveyed 1,507 eligible voters in Alberta online.
In this report, I specifically highlight the results of the 72% of respondents who said they would definitely be voting in the election. I refer to these people as likely voters.
Here’s what we found:
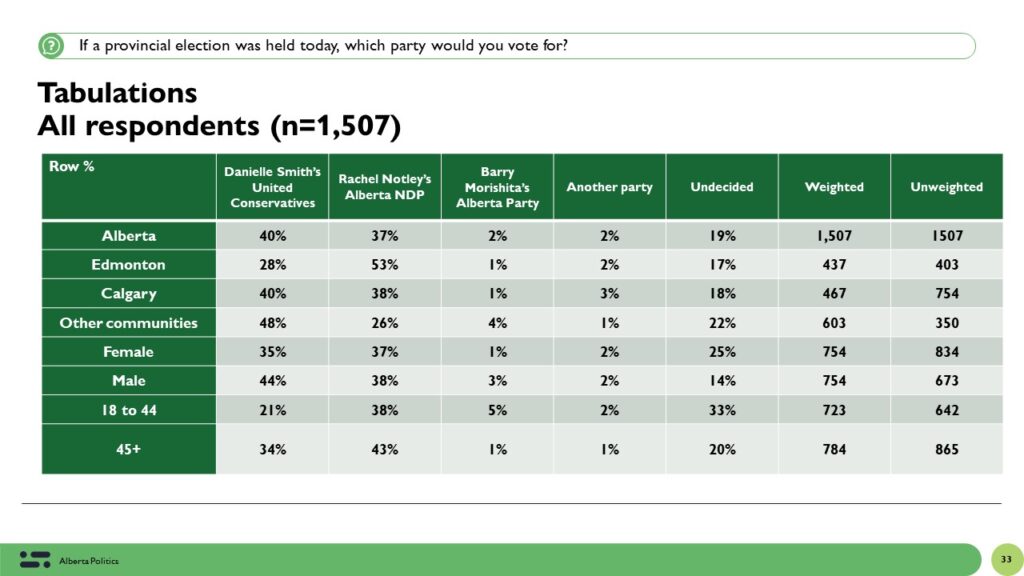
The United Conservative Party is ahead of the NDP province-wide but Calgary remains close.
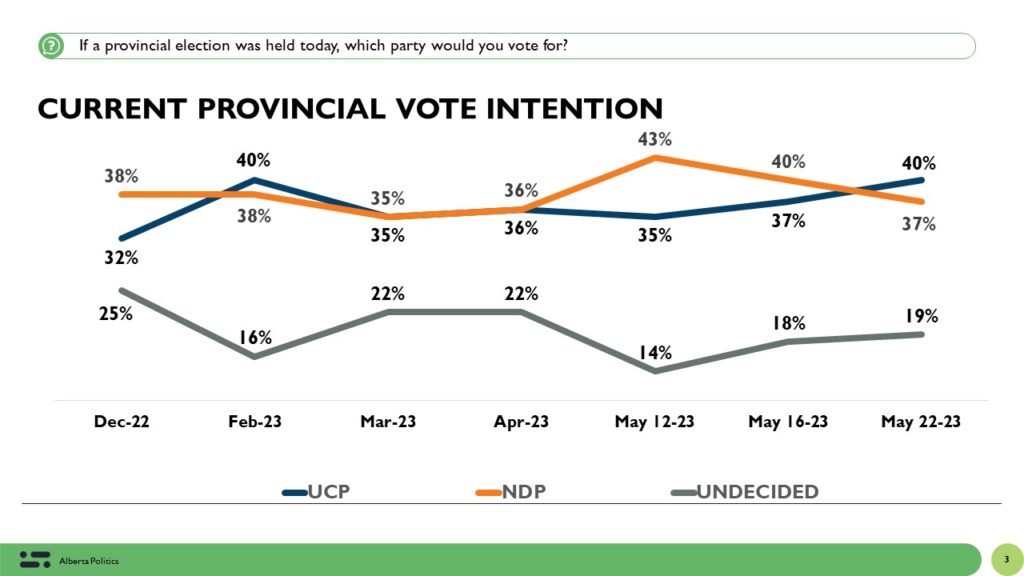
Among all eligible voters, 40% would vote UCP (up 3), 37% would vote NDP (down 3) while 2% would vote for the Alberta Party. 19% say they are undecided, up slightly from last week.
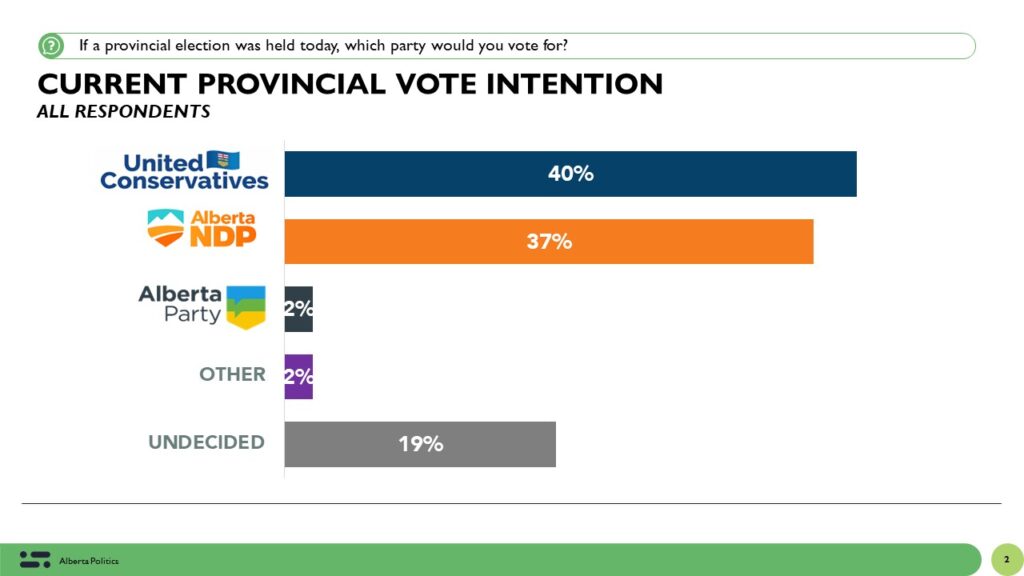
This is the largest lead we’ve measured for the UCP since we started tracking vote intentions in December 2022. The NDP vote is down 6 points over two weeks while the UCP share is up 5.
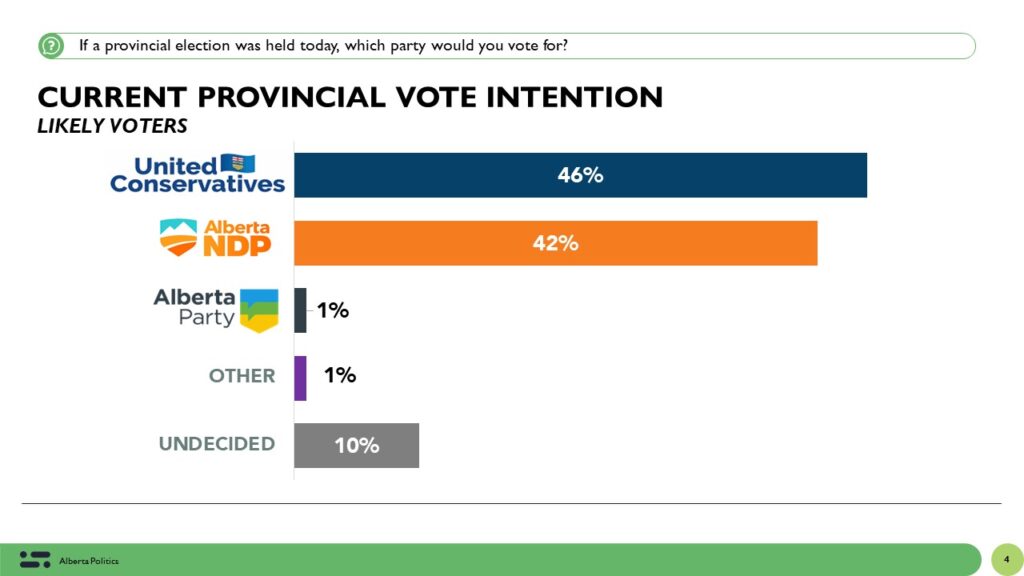
Among likely voters, the UCP leads by 4 over the NDP with 10% of likely voters saying they are still undecided with one week to go in the election. Based on the sample size of likely voters (1,067) there’s a 90% probability that the UCP is ahead province-wide a UCP lead as wide as 10% and an NDP lead as big as 2%.
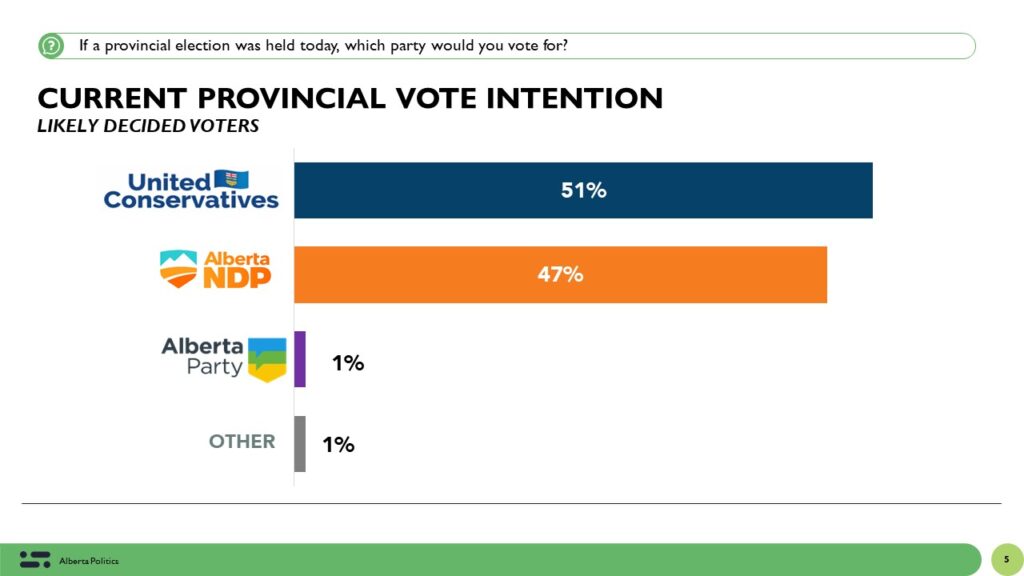
Among committed likely voters (our ballot estimate), the UCP is at 51% while the NDP is at 47%. The Alberta Party gets 1% of the vote as do other parties.
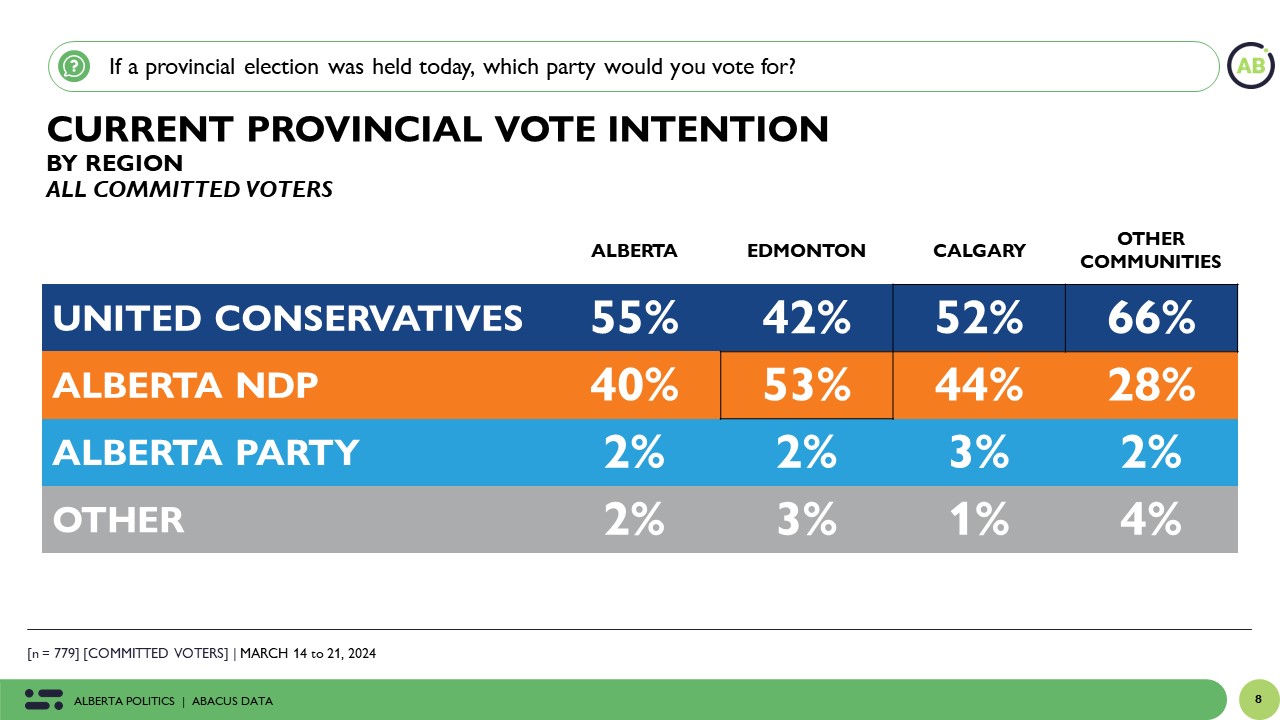
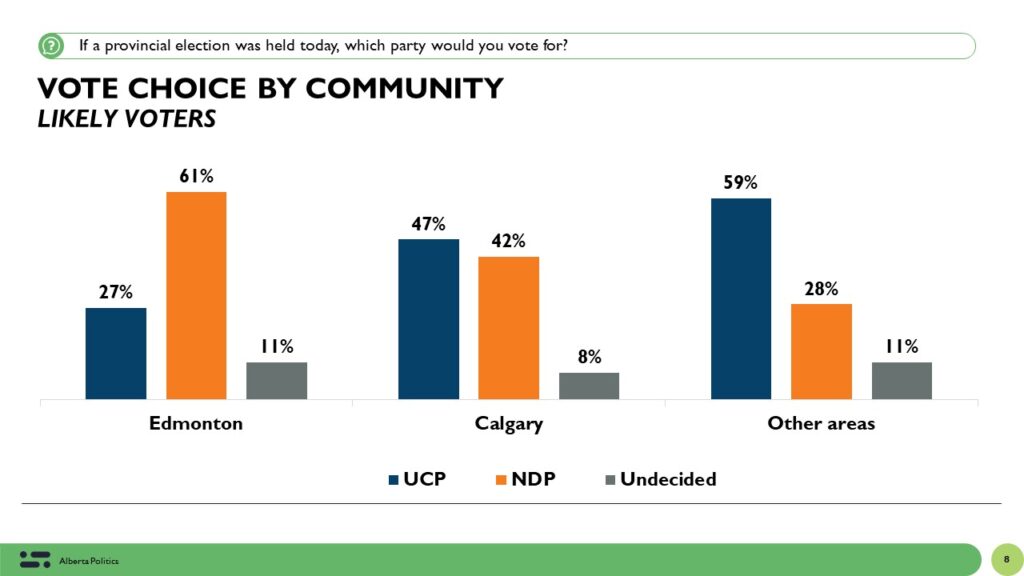
Regionally, we have the NDP ahead by 34 in Edmonton (61% to 27%), the UCP ahead by 31 outside the two biggest cities (59% to 28%) while Calgary remains close with 47% for the UCP and 42% for the NDP.
When you removed undecideds, the results by region are:
- Calgary: UCP 51%, NDP 46%
- Edmonton: NDP 68%, UCP 30%
- Other communities: UCP 67%, NDP 31%
There is a big generational and educational divide
The NDP leads by 12 among those under 45 while the UCP is ahead by 15 among those aged 45+. The NDP leads by two among women while the UCP leads by 10 among men. The gender gap has shrunk since our previous survey.
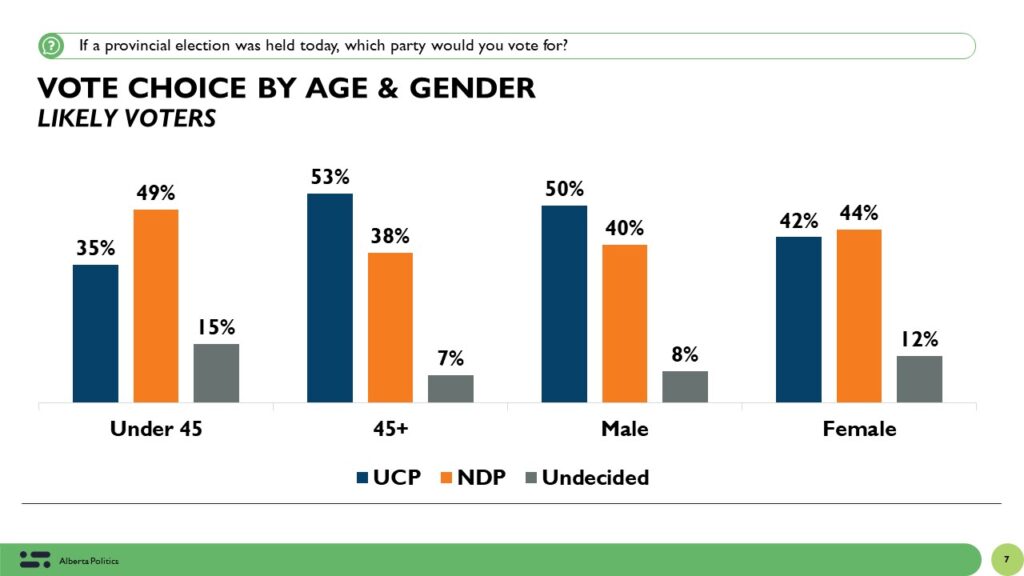
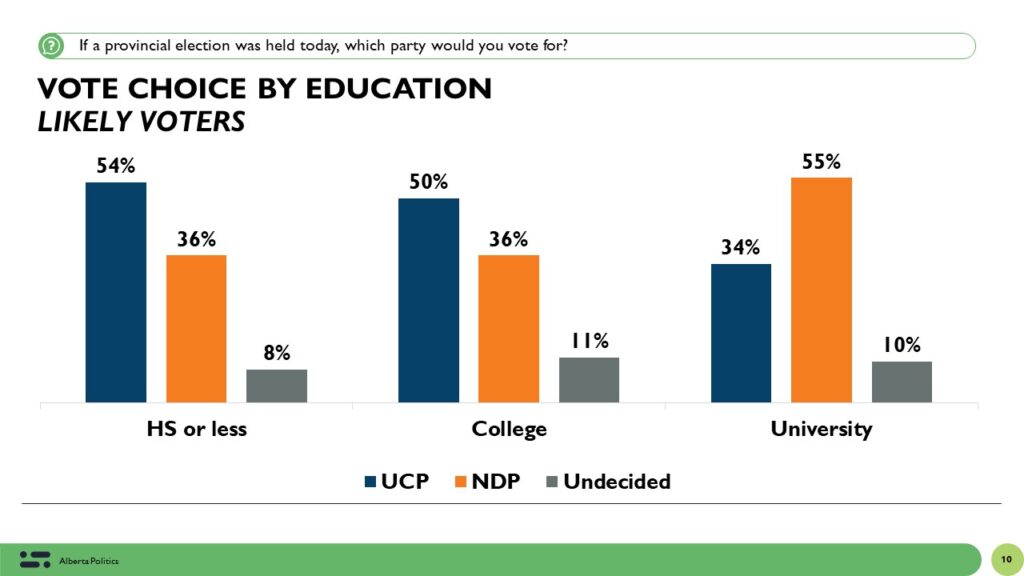
The UCP leads by double digits among those with high school or college education while the NDP leads by 21-points among those with a university degree.
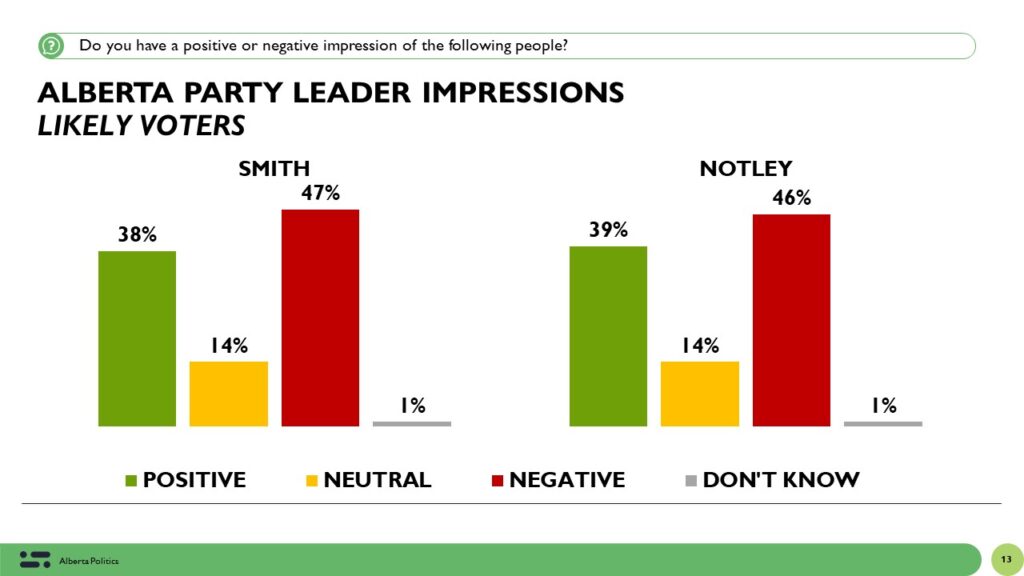
Party Leader Impressions
Among likely voters, impressions of Danielle Smith and Rachel Notley are almost exactly the same. For Smith, 38% have a positive impression while 47% have a negative view. For Notley, it’s 39% positive and 46% negative.
Views of the leaders remain deeply polarized and predictive of vote choice. 78% of UCP voters have a positive view of Smith and 90% have a negative view of Notley. In contrast, 80% of NDP voters have a positive view of Notley while 87% have a negative view of Smith.
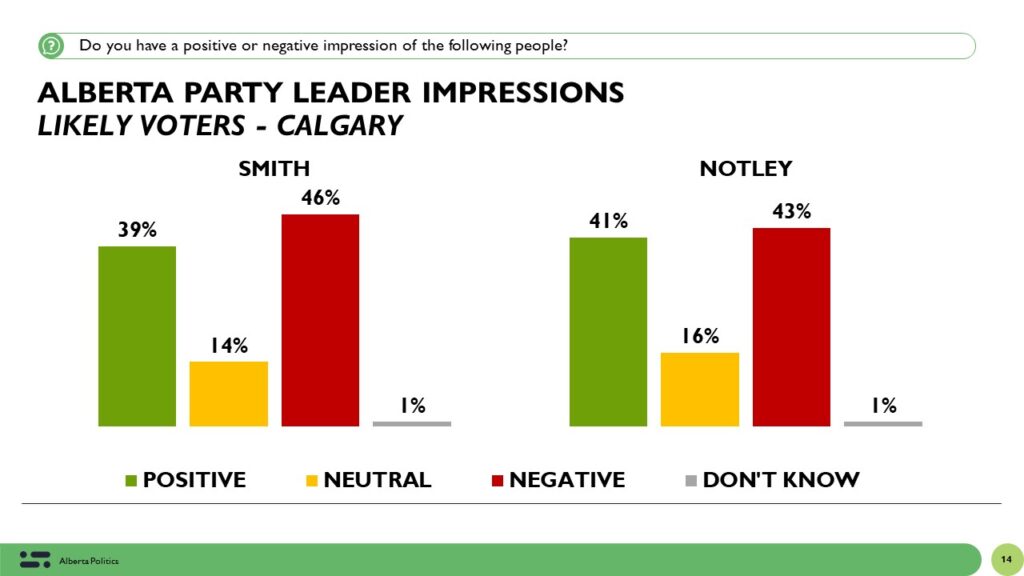
As we watch what happens in Calgary closely, it is worth noting that Smith and Notley have almost the same overall image – Smith is -7 and Notley is -2. The difference is marginal given the sample size in Calgary.
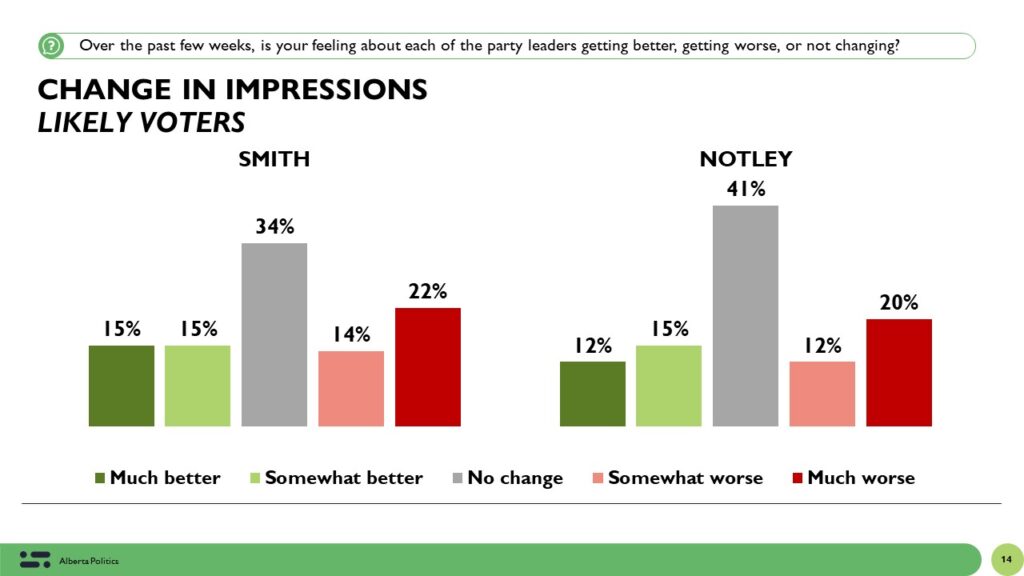
At the same time, the momentum scores for Smith and Notley are about the same among likely voters. 30% say their impression of Smith has improved over the past few weeks, 3 points higher than Notley. In contrast, 36% say their impression of Smith has worsened, 4-points higher than Notley. This suggests that some of the earlier challenges faced by the UCP campaign over past comments made by Smith may be having less impact.
The Debates: A draw
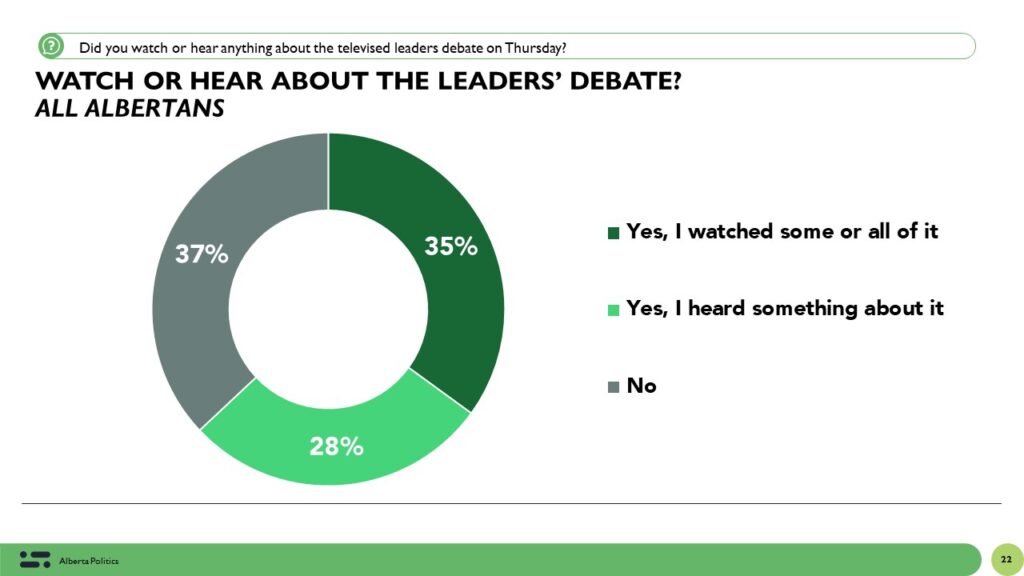
1 in 3 Albertans eligible to vote said they watched some or all of the leaders’ debate held last Thursday. Another 28% said they heard something about it. 37% heard nothing about it.
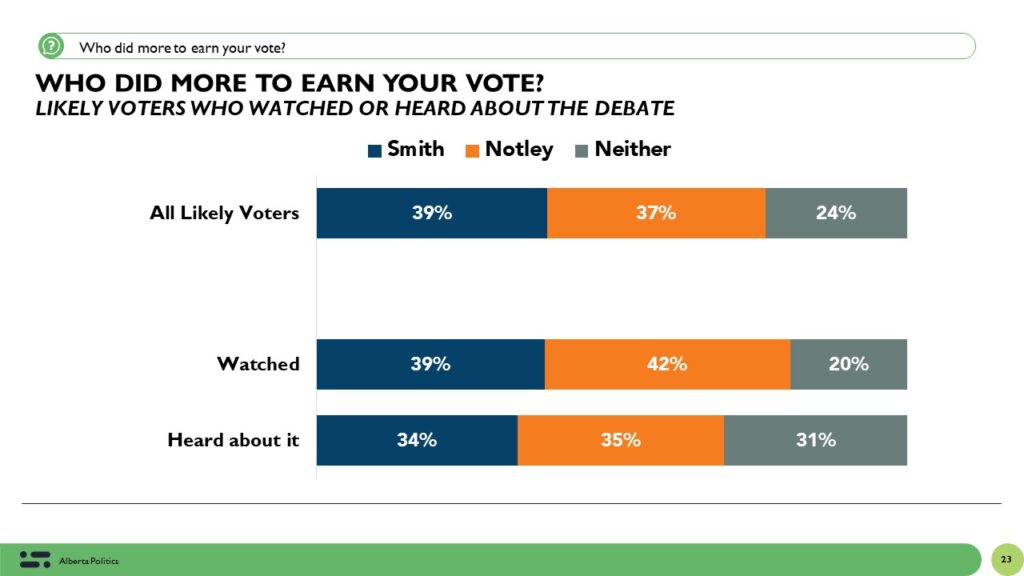
Among likely voters who watched or heard about the debate, 39% say Smith did the most to earn their vote while 37% say Notley did. 24% say neither did.
Of those who thought neither Smith nor Notley did the most to earn their vote, 45% are voting NDP, 29% UCP and 21% are undecided. 92% of those who thought Smith did the best are voting UCP. 92% of those who thought Notley did the best are voting NDP. The debate, for many, didn’t clarify the choice enough.
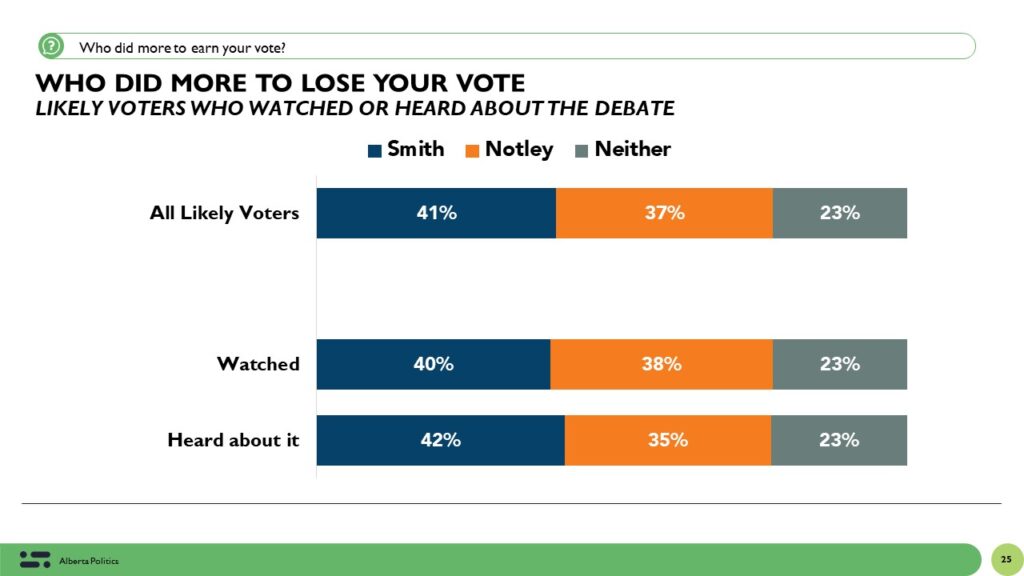
When asked who did most to lose their vote, 41% of likely voters say Smith while 37% point to Notley. 23% say neither.
Risk, healthcare and the economy
In this survey, we asked respondents a new set of questions.
First we asked what’s worse in their mind – the choices the Smith UCP government made when it was in government or the choices the Notley NDP government made when it was in government. Overall, Albertans – like many other questions – are split. 54% think the NDP’s record is worse while 46% think Smith’s and the UCP’s is worse.
Looking forward, when asked what worries them more – what the UCP and Smith will do if re-elected or what the NDP and Notley will do if elected, the split is almost 50/50. 51% of likely voters say they worry more about what the NDP will do while 49% worry more about the UCP.
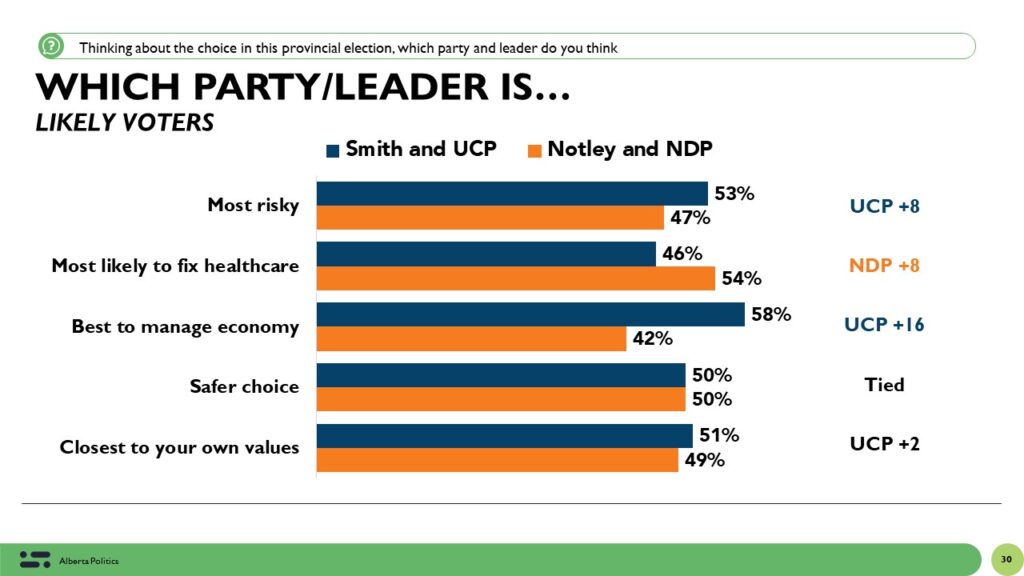
Digging a bit deeper into this, we also asked which party do people feel is the most risky, the most likely to fix healthcare, the best to manage the economy, the safer choice, and is closest to their own values. In almost every case – except on the economy – Albertans split close to 50/50.
The UCP has an advantage on the economy while the NDP is seen as better on healthcare and on risk.
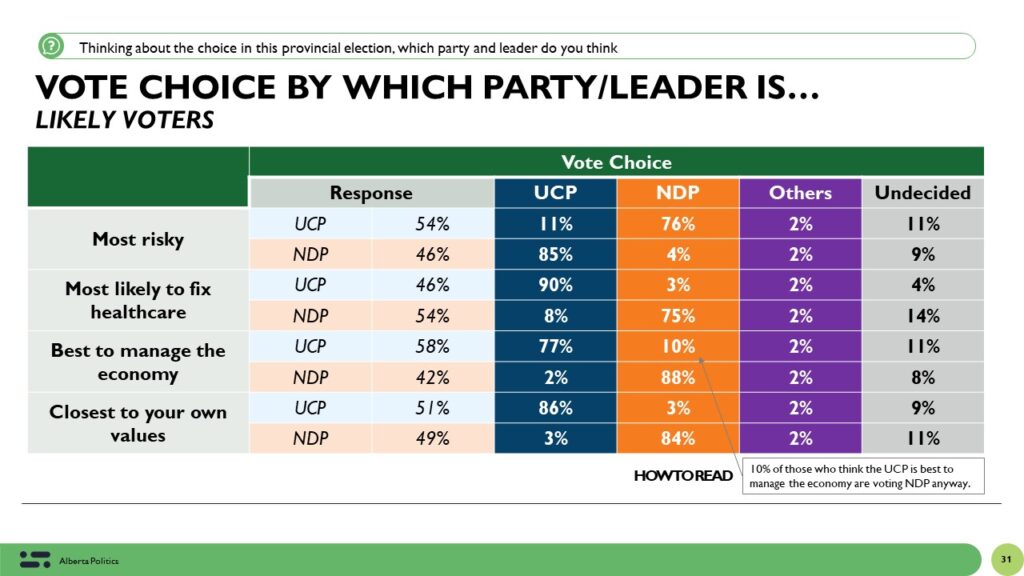
To understand the potential impact on vote choice – the campaign framing effects – the table below reports the vote choice by responses to these questions.
What it shows is that the NDP hasn’t fully convinced those who are uncomfortable about the UCP to vote NDP. For example, 11% of those likely voters who think the UCP is the most risky are still voting UCP and 11% are undecided. Moreover, 8% of those who think the NDP is best on healthcare are voting UCP anyway.
In contrast, 10% of likely voters who think the UCP is best on the economy are still going to vote NDP despite feeling this way.
This suggests that the preferred ballot questions for the UCP and NDP are not fully formed but much of the vote breaksdown by how people feel the parties will do on the economy and healthcare and on the level of risk associated with each choice.
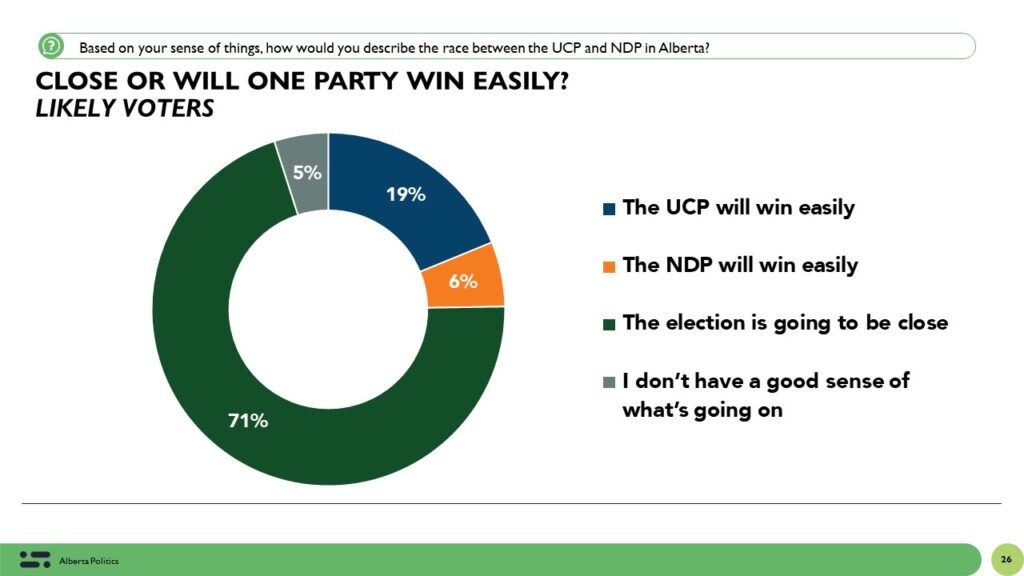
Likely voters think the election is close but more think Danielle Smith will win.
Finally, seven in ten likely voters think the provincial election is going to be close. 19% think the UCP will win easily while 6% think the NDP will win easily.
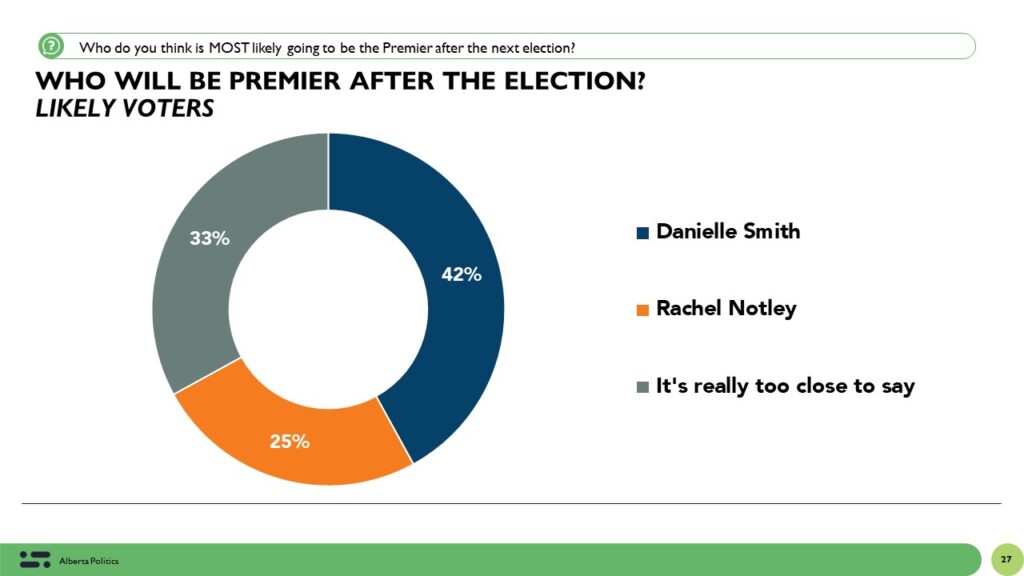
When asked who they think will be premier after the election, 42% of likely voters say Smith while 25% say Notley. 33% are unsure and say it’s too close to say.
THE UPSHOT
With a week to go, the provincial Alberta election remains very close and Calgary remains the most competitive battleground. Right now, it does seem that the UCP has consolidated some of its previous support and the debate neither helped nor harmed either leader. I’d say the UCP is slight favourite based on these numbers but with 10% of likely voters still undecided, that could change in the next week. I wouldn’t rule out an NDP win either.
The deep divide on almost every measure show how polarized the choice in this campaign has become. NDP voters really don’t like Smith while UCP voters really don’t like Notley. Almost equal numbers think the NDP and UCP are the most risky and scary choice. The UCP still has an opportunity to put the economy into frame while healthcare remains the NDP’s strongest card.
Ultimately, the risk that voters see in both choices is dividing the electorate. Half think the Smith and the UCP are more risky while another half think it’s the NDP that’s more risky. If either party can gain just a few points in either direction on that measure, it may be the difference between winning and losing.
Subscribe to my substack for more data and breakouts in the coming days from this poll.
METHODOLOGY
The survey was conducted with 1,507 Alberta adults eligible to vote from May 19 to 22, 2023
A random sample of panelists were invited to complete the survey from a set of partner panels based on the Lucid exchange platform. These partners are typically double opt-in survey panels, blended to manage out potential skews in the data from a single source.
The margin of error for a comparable probability-based random sample of the same size is +/- 2.6%, 19 times out of 20.
The data were weighted according to census data to ensure that the sample matched Alberta’s population according to age, gender, educational attainment, and region. Totals may not add up to 100 due to rounding.
This survey was paid for by Abacus Data Inc.
Abacus Data follows the CRIC Public Opinion Research Standards and Disclosure Requirements that can be found here: https://canadianresearchinsightscouncil.ca/standards/
ABOUT DAVID COLETTO
David Coletto is Chair, CEO and a founding partner of Abacus Data a full-service market research and strategy firm based in Ottawa and Toronto. With over a decade and a half of experience in the industry, David and his partners founded Abacus 12 years ago and since then David has become one of Canada’s most respected social researchers regularly commenting on politics, the labour market, and consumer behaviour.
He earned a PhD in Political Science from the University of Calgary in 2010 and is an adjunct professor at Carleton University. He is the host and producer of inFocus with David Coletto a podcast that explores the intersection of public opinion, politics, public policy, and consumer behaviour.
ABOUT ABACUS DATA
We are the only research and strategy firm that helps organizations respond to the disruptive risks and opportunities in a world where demographics and technology are changing more quickly than ever.
We are an innovative, fast-growing public opinion and marketing research consultancy. We use the latest technology, sound science, and deep experience to generate top-flight research-based advice to our clients. We offer global research capacity with a strong focus on customer service, attention to detail, and exceptional value.
We were one of the most accurate pollsters conducting research during the 2021 Canadian election following up on our outstanding record in 2019.
Contact us with any questions.
Find out more about how we can help your organization by downloading our corporate profile and service offering.