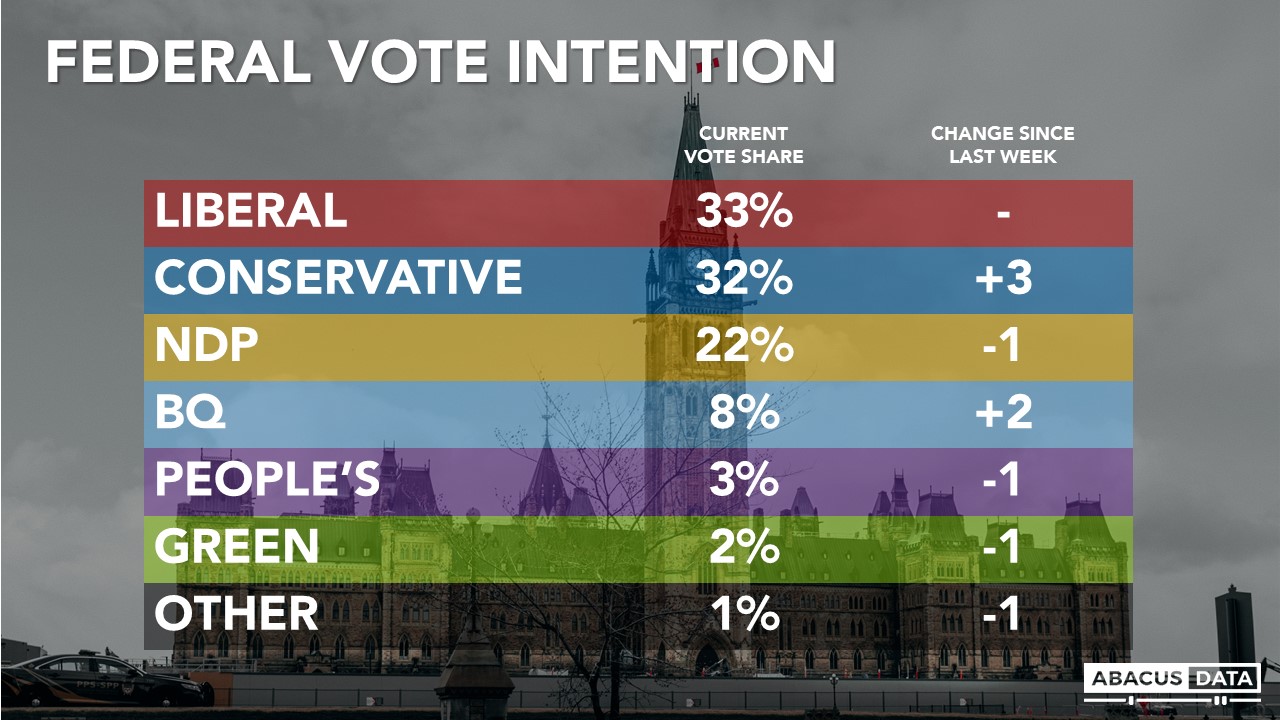
Into week three, the Liberals (33%) and Conservatives (32%) are neck and neck, with the NDP trailing at 22%. But Conservatives are now ahead among likely voters.
August 31, 2021
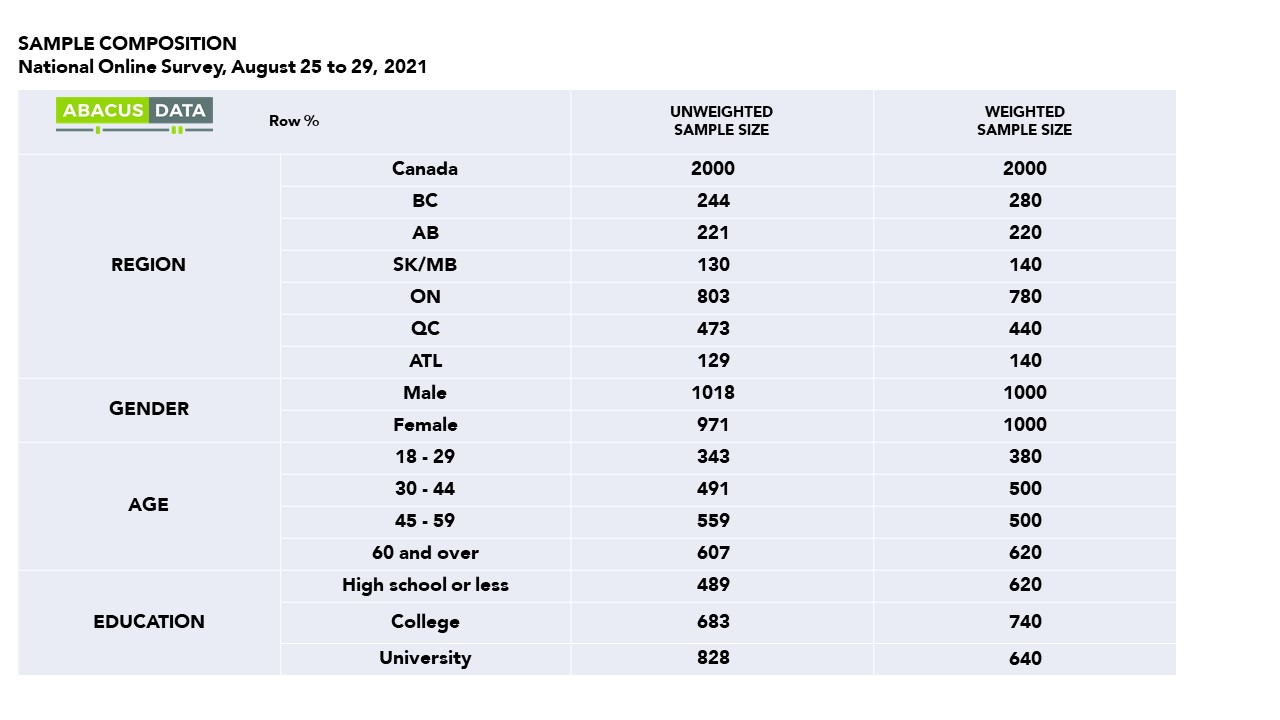
We just completed a national survey of 2,000 Canadians eligible to vote in the current federal election (August 24 to 29, 2021). Here’s what we are seeing:
CURRENT VOTE INTENTION
If an election were held now, the Liberals would win 33% of the vote (unchanged from last week), the Conservatives 32% (up 3), the NDP 22% (down 1), the Green Party 2% (down 2) and the BQ at 34% in Quebec (up 5).
• In BC, we see the Liberals at 35%, the NDP at 34% and the Conservatives at 32%. The Greens are at 2% which is the lowest number we have seen for that party in a long time.
• In Alberta, 52% would vote Conservative compared with 26% for the NDP and 14% for the Liberals, 3% for the Green Party, 3% for the People’s Party, 2% for the Maverick Party.
• In Manitoba and Saskatchewan, the Conservatives lead with 50% followed by the NDP (25%) and Liberals (18%).
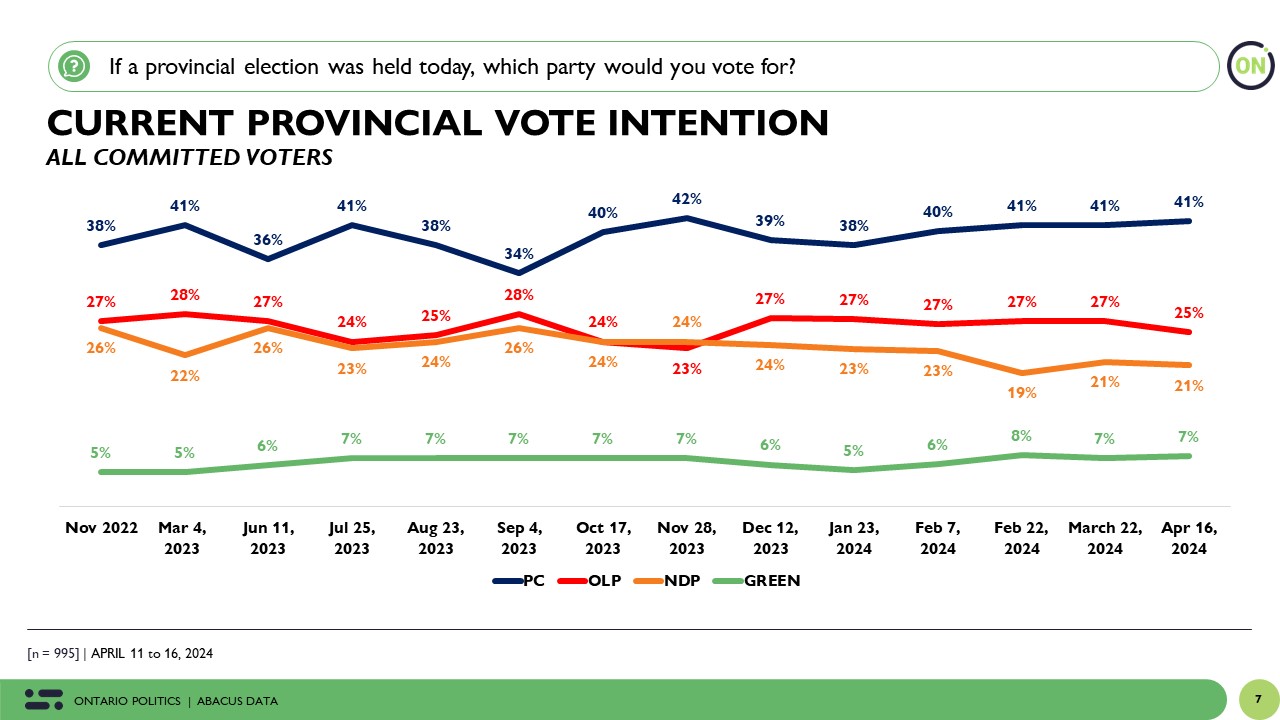
• In Ontario, the Liberals lead by 7 (39% to 32%) with the NDP at 22%. The People’s Party is at 4% in Ontario. The Green Party is at 2%. The Liberal lead in Ontario has been consistent in our tracking.
• In Quebec, we see the BQ with 34%, followed by the Liberals (29%), the Conservatives (20%) the NDP at 12%. The Greens are at 3% in Quebec.
• In the Atlantic provinces, the Liberals (50%) are well ahead of the Conservatives (30%) and the NDP (19%).

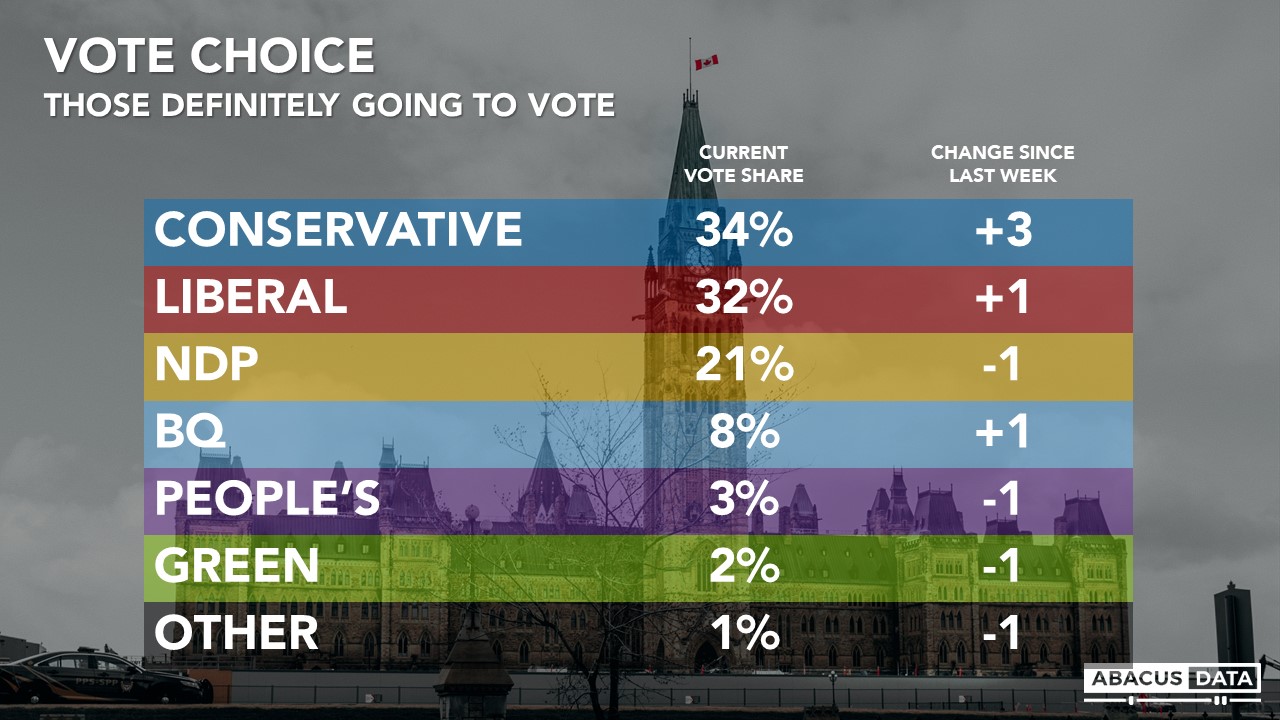
Although the Liberals and CPC are statistically tied among all decided respondents, the Conservatives have a 2-point lead among those who are most likely to vote. Among the 69% of respondents who said they would definitely be voting, the Conservatives have 34% compared with 32% for the Liberals and 21% for the NDP.
Turnout levels may be higher among older people than younger people, with only 59% of those under 30 saying they are certain to vote, compared to 65% among those 30-44, 76% among those 45-59 and 85% among those over 60.
TODAY VS. 2019: HOW WELL ARE PARTIES HOLDING THEIR VOTE?
The Conservatives are holding 87% of their 2019 vote, the rest has been scattered with no more than 4% going to any other party.
The Liberals have held 79% of their 2019 vote, losing 12% of that vote to the NDP and 8% to the Conservatives.
The NDP has held 83% of its 2019 vote, losing a bit more 7% to the Liberals than to the Conservatives (4%) and the BQ (3%)
The Green Party has held on to just 47% of its 2019 vote, losing a third of their voters to the NDP, 10% to the Liberals and 7% to the Conservatives.
SECOND CHOICES
Overall, 21% of decided respondents say their second choice is the NDP, followed by the Liberals (18%) and the Conservatives (10%). 28% say they have no second choice.
Conservative voters are the least likely to have a second-choice preference. Their second choice is a bit more likely to be NDP (19%) or People’s Party (16%) than Liberal (15%)
Liberal voters’ second choice is 39% NDP and 19% Conservative.
NDP voters’ second choice is Liberal 44%, Green 22%, with only 10% saying their second choice would be the Conservatives.
BQ voters would tend to drift more to the Liberals (26%) and NDP (20%) than to the Conservatives (15%).
VACCINATION STATUS AND THE VOTE
Among those fully vaccinated, the Liberals have a four-point lead (34% Liberal, 30% Conservative and 22% for the NDP). Conservatives lead by 7-points among the hesitant and by 34-points among vaccine refusers. Among vaccine refusers, 44% would vote Conservative followed by 25% for the People’s Party.
VOTE CERTAINTY
Almost four in ten of those with a vote preference (38%, down 2 points from last week) say they could change their mind about how they will vote come Election Day, including at least a third of voters in every region, almost half of voters under 30 (47%). NDP and Green supporters are the most likely to be open to switching. 32% of Conservative supporters might change, 36% of Liberal voters, 43% of BQ supporters, and 45% of NDP voters.

PREFERRED OUTCOME
Asked which of four (most likely based on today’s numbers) outcomes they would prefer, 60% would prefer a Liberal victory (31% majority, 29% minority) while 40% would prefer a Conservative win (13% minority, 27% majority). Compared with last week, preference for a Liberal government is down 3-points with a 3-point rise in preference for a Conservative in.
A Liberal win is the preference of 63% in BC, 40% in Alberta, 46% in Manitoba/Saskatchewan, 65% in Ontario, 63% in Quebec, and 69% in Atlantic Canada.
Among Liberal/NDP switchers 99% would prefer a Liberal to a Conservative victory. Among NDP voters 82% would prefer a Liberal win.
Among BQ voters 61% would prefer the Liberals win, compared to 39% who would like the Conservatives to come out on top.
Among Liberal/Conservative switchers two thirds (64%) would prefer to see the Liberals win.
Among vaccine refusers, 73% would like the Conservatives to win while 64% of those fully vaccinated would prefer the Liberals to win.
EXPECTED ELECTION OUTCOME
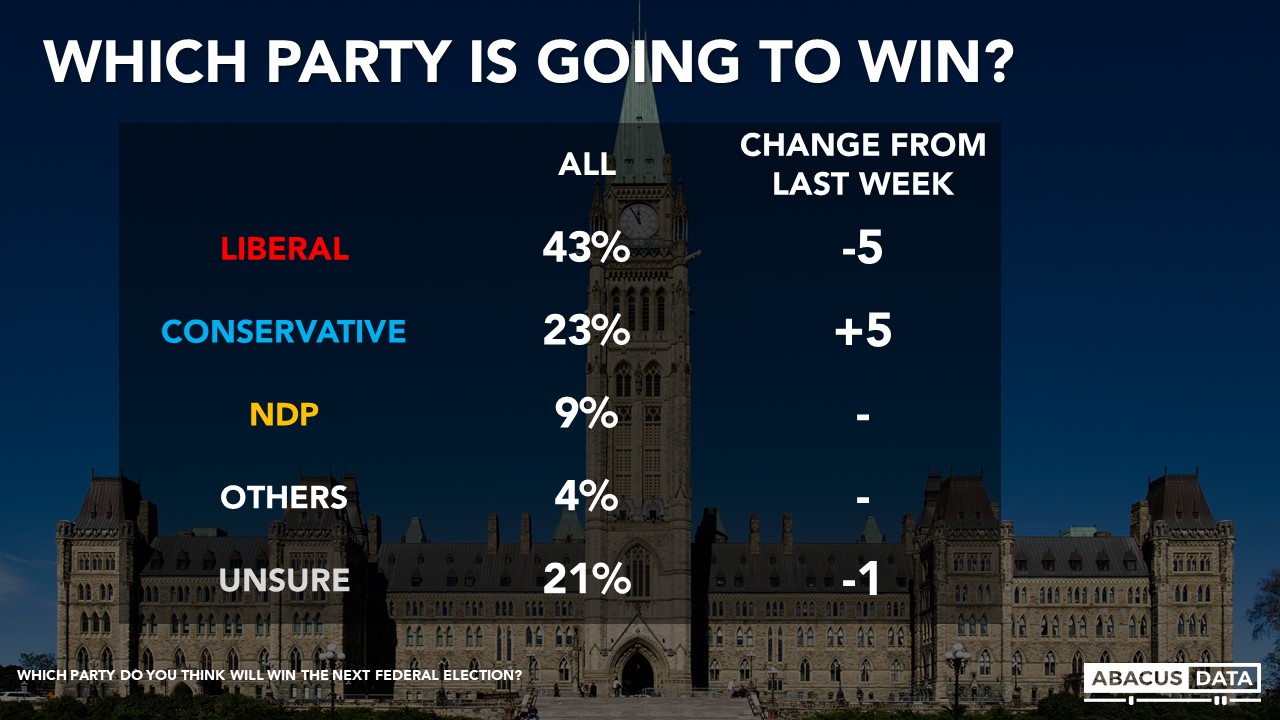
As of today, 43% expect the Liberals to win (down 5 since last week), followed by 23% who expect the Conservatives to win (up 5), and 9% who expect the NDP to come out on top.
Those who would prefer the LPC to win but think the Conservatives are going to win make up 2% of the electorate. This is unchanged from last week and is a good indicator of the potential of strategic voting.
LEADER IMPRESSIONS
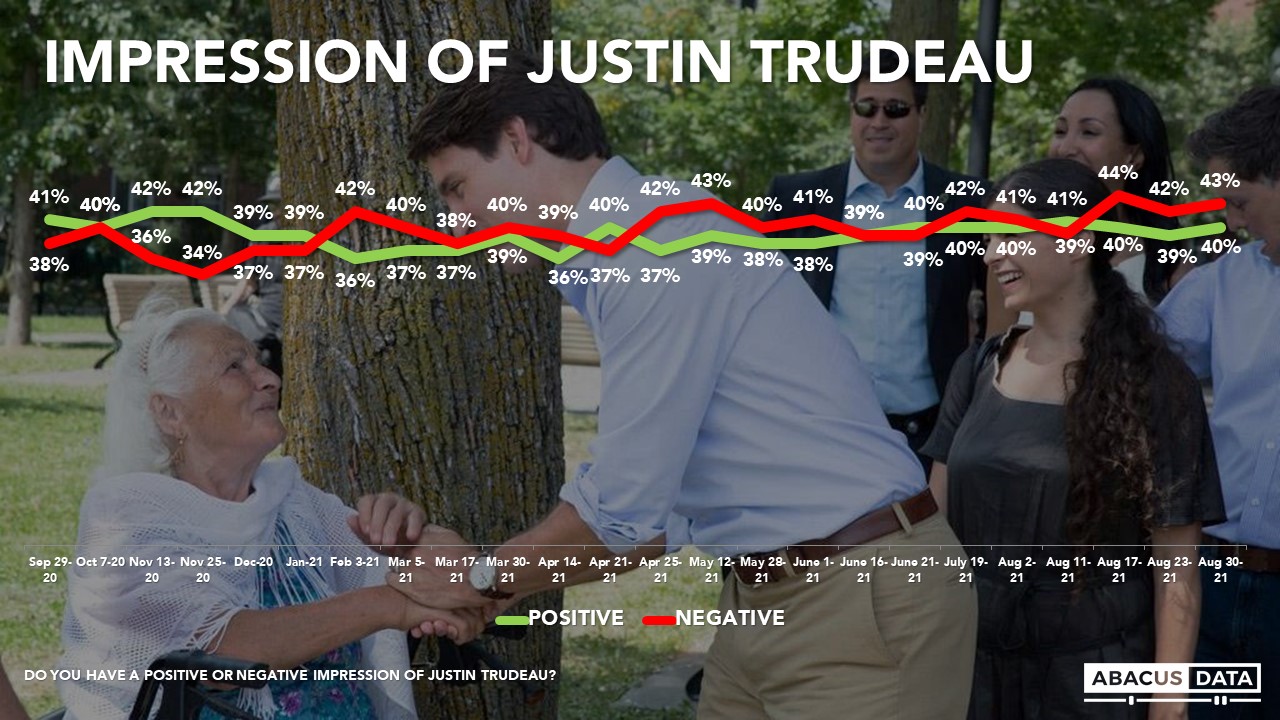
Justin Trudeau enjoys a positive impression among 40% and negative impressions among 43%, for a net score of -3. This is unchanged from last week. Regionally, Mr. Trudeau’s net favourables are +2 in BC, -48 in Alberta, -32 in SK/MB, +1 in Ontario, +7 in Quebec, and +22 in Atlantic Canada. Among Liberal/NDP switchers Trudeau is +65. Among Liberal/Conservative switchers he is +46. Trudeau is +2 among the fully vaccinated and -72% among vax refusers.
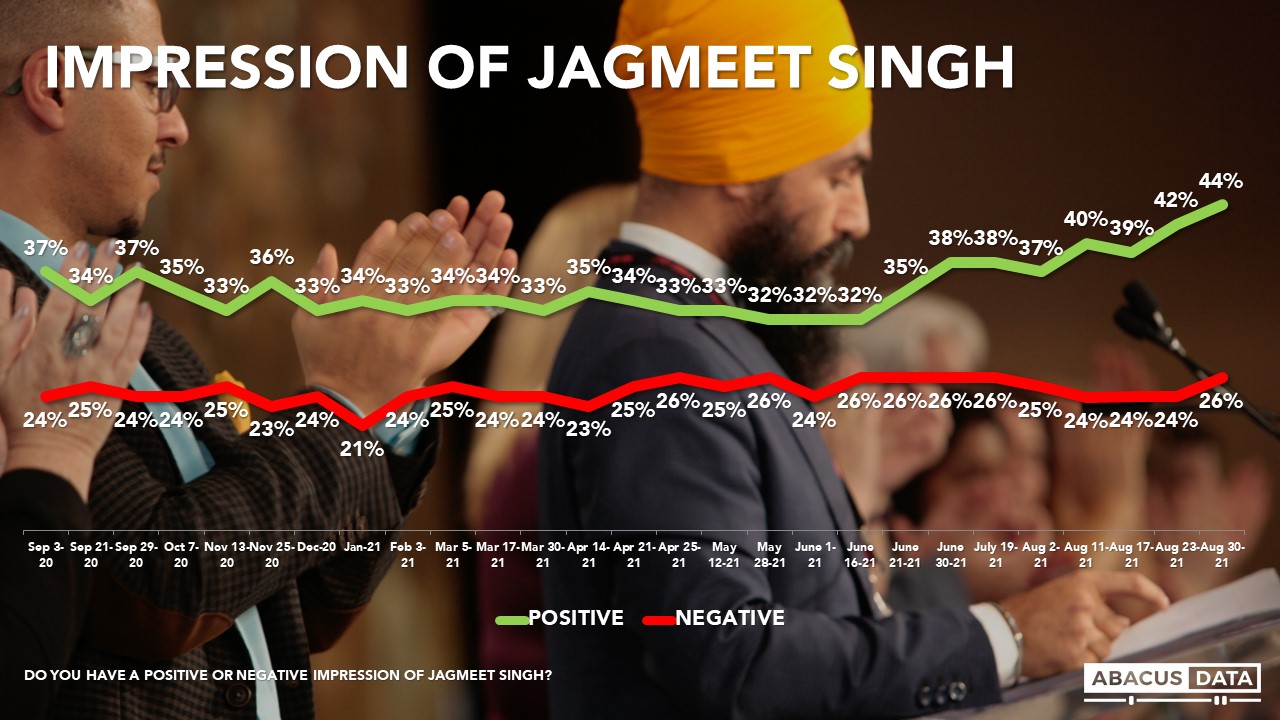
Jagmeet Singh enjoys a positive impression among 44% and finds negative impressions among 26% for a net score of +18. Positive impressions and negative impressions of Mr. Singh are up each by 2-points in the last week.
Regionally, Mr. Singh’s net favourables are +33 in BC, +7 in AB, +14 in SK/MB, +20 in Ontario, +3 in Quebec, and +34 in Atlantic Canada. Among Liberal/NDP switchers Singh is +65. Among CPC/NDP switchers he is +47.
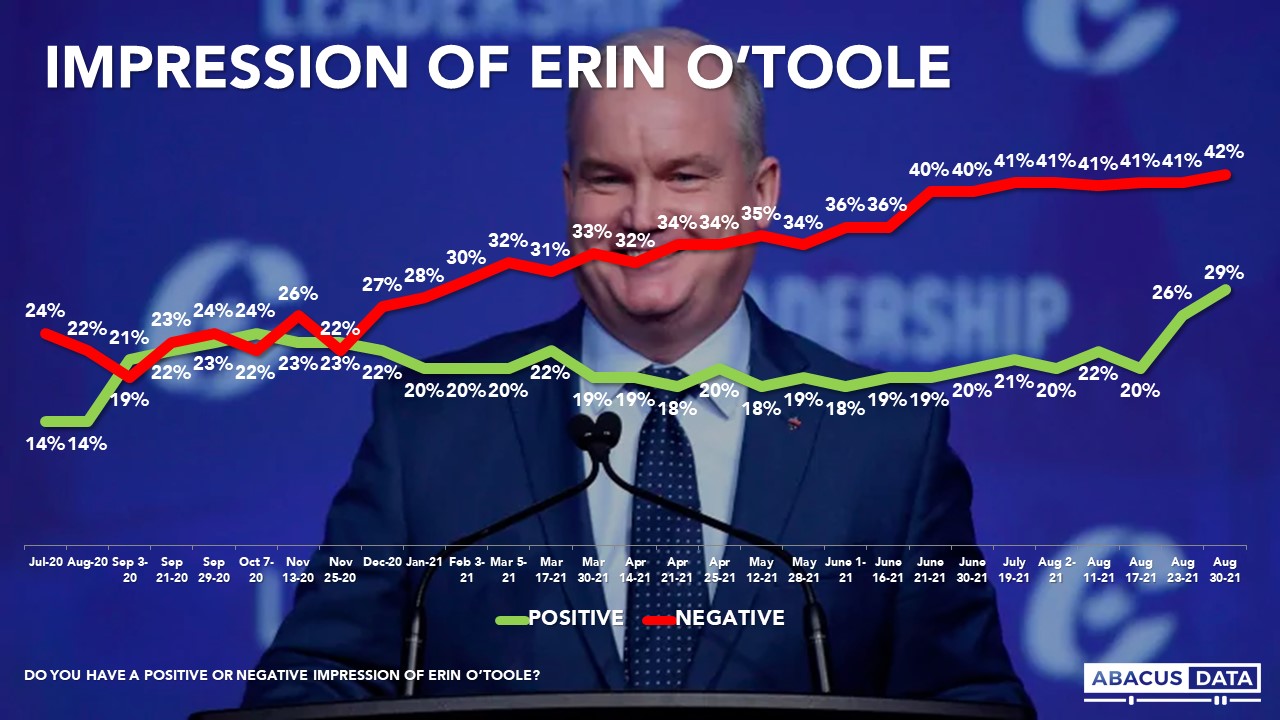
Today 29% have a positive impression of the Conservative leader Erin O’Toole (+3 from last week) while his negatives are at 42% for a net score of -13, showing another week of gains.
Regionally, Mr. O’Toole’s net favourables are -24 in BC, +7 in AB, +2 in SK/MB, -15 in Ontario, -13 in Quebec, and -15 in Atlantic Canada. Mr. O’Toole’s improvements so far seem to be concentrated more in the Prairies and among Conservative voters who were soft in their support before the election was called. Among Liberal/Conservative switchers O’Toole is +44. O’Toole is -13 among the fully vaccinated and -9% among vax refusers.
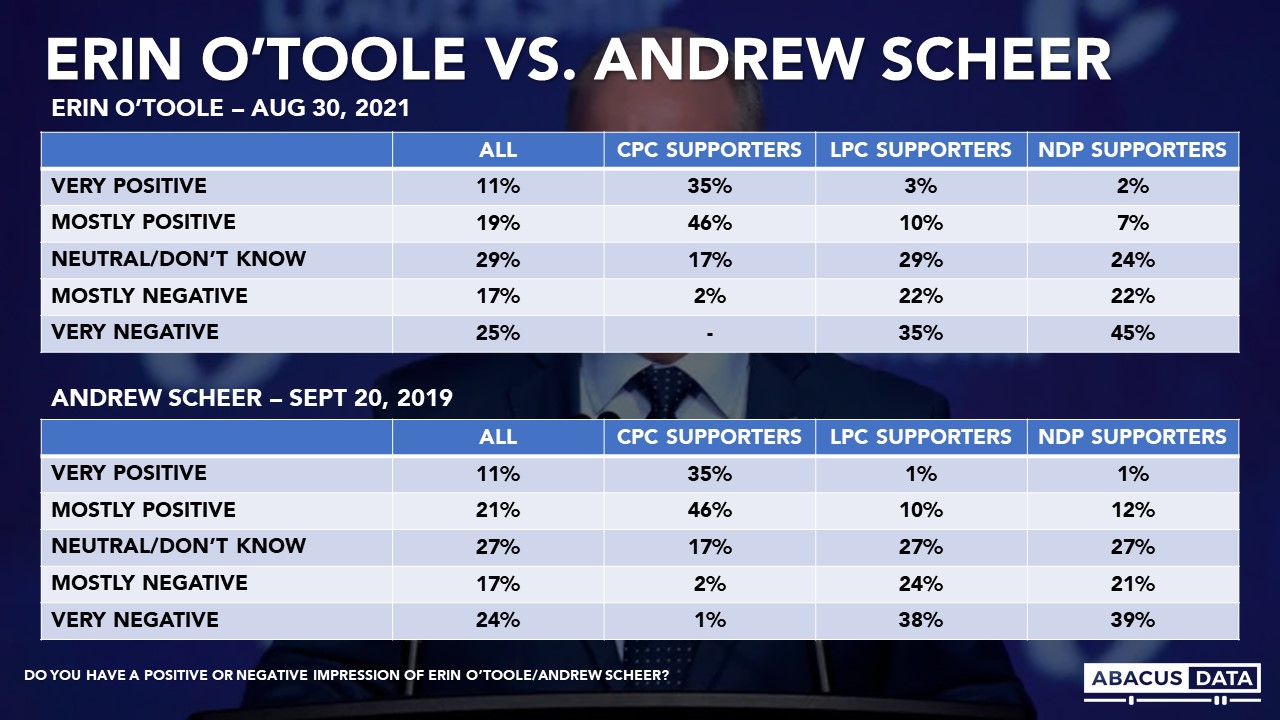
If we compare Mr. O’Toole’s image with that of Mr. Scheer around the same time of the 2019 election, we find almost identical results. Mr. O’Toole is as unpopular with non-Conservative voters as Mr. Scheer was and as popular with Conservatives as he was at this point in the campaign.
In Quebec, BQ Leader Mr. Blanchet is 41% positive and 25% negative for a net score of +16. In contrast, Mr. Trudeau is +7 and Mr. O’Toole is -13 in Quebec.

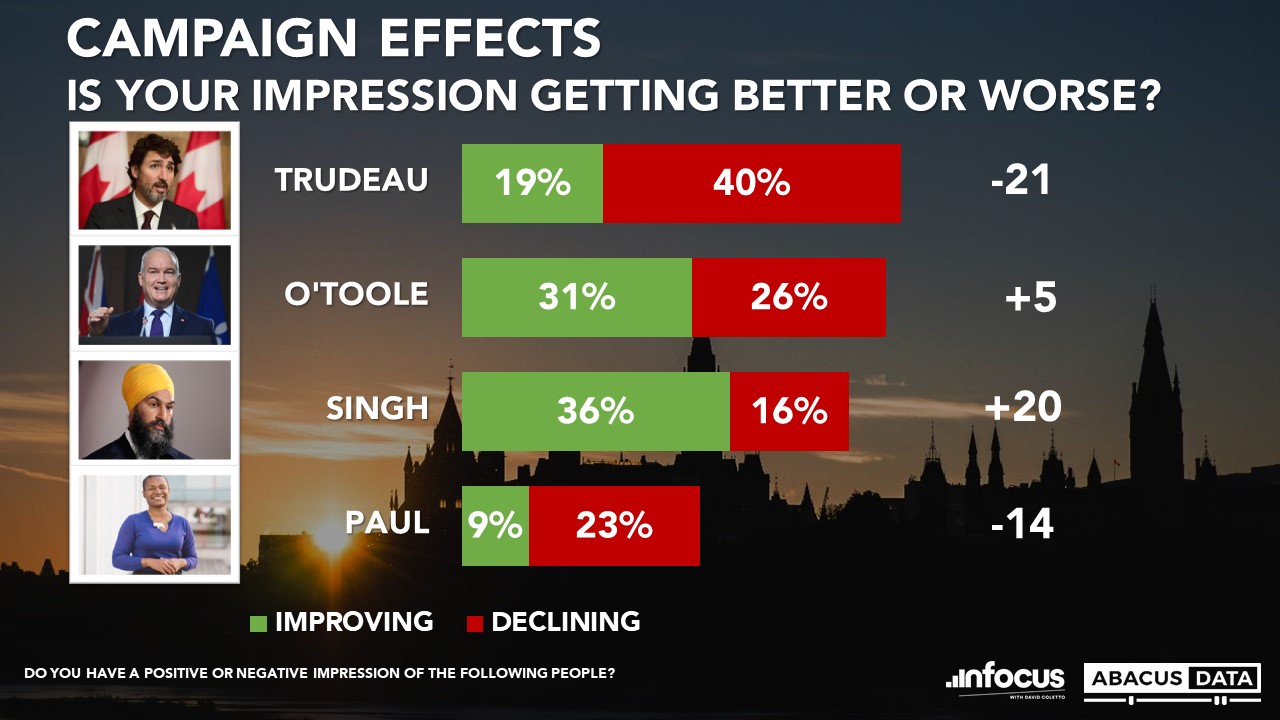
In terms of whether people’s views are improving or declining of the three main party leaders, we find Mr. Trudeau has the lowest momentum score while Mr. Singh has the highest.
• Justin Trudeau: 19% say their impressions are improving, 40% declining, for a momentum score of -21, similar to last week. Among LPC/NDP switchers, his momentum score is +6 and among LPC/CPC switchers it is +15. Among those who voted Liberal in 2019, 20% say their impression of Mr. Trudeau has declined since the start of the campaign.
• Erin O’Toole: 31% say their impressions are improving (up 7), 26% declining, for a momentum score of +5. Among LPC/CPC switchers, his momentum score is +43. Among CPC/NDP switchers, it is +59. Among those who voted CPC in 2019, 5% say their impression of Mr. O’Toole has declined since the start of the campaign.
• Jagmeet Singh: 36% say their impressions are improving (up 4), 16% declining (unchanged), and 48% not changing for a momentum score of +20. Among LPC/NDP switchers his momentum score is +57 and among CPC/NDP switchers it is +51. Among those who voted NDP in 2019, his momentum score is +55.
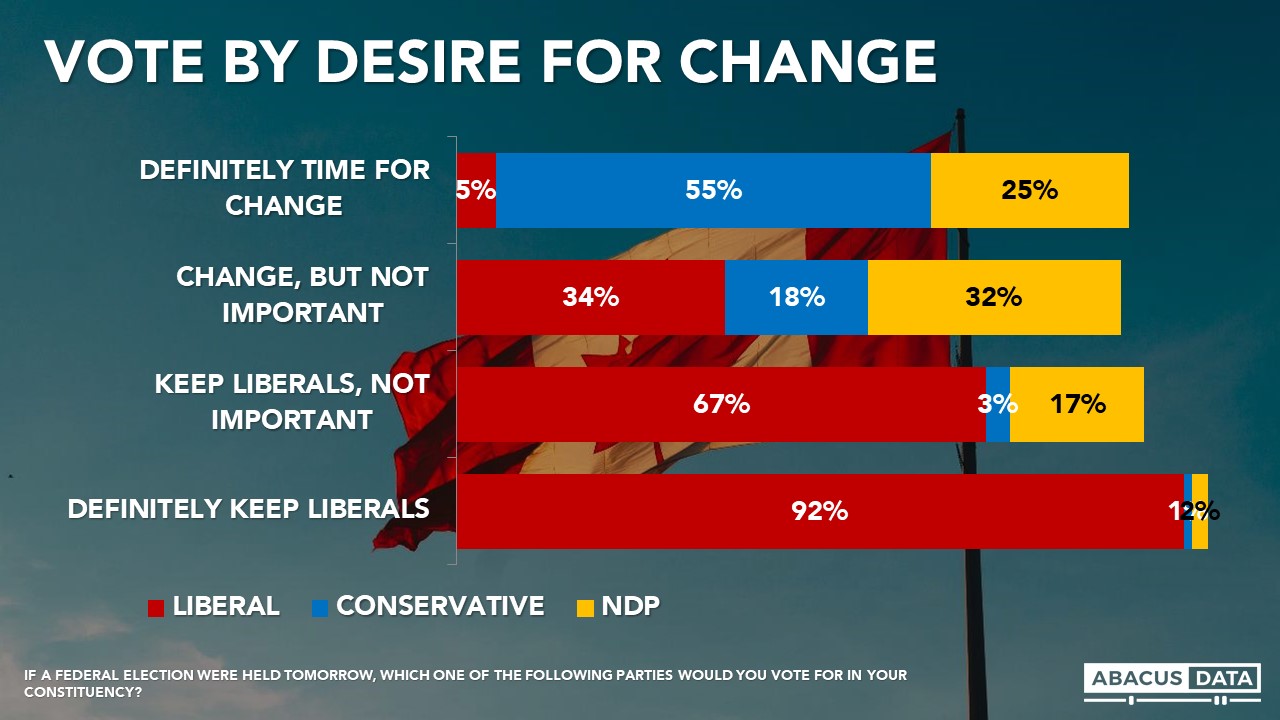
DESIRE FOR CHANGE & GOVERNMENT APPROVAL
Today 40% approve of the job being done by the Trudeau government, while 43% disapprove. Regionally, the net approval rating for the federal government is +3 in BC, -44 in Alberta, -34 in Saskatchewan and Manitoba, +2 in Ontario, +4 in Quebec, and +25 in Atlantic Canada.
We are seeing a rise in those who definitely want a change in government. Today, 48% definitely want to see a change in government (up 4 from last week) while another 24% say it would be good to have a change, but it is not really that important to them, for a total of 71% who would prefer a change in government. This outlook is almost identical to the feelings we measured in the run up to the 2019 election.
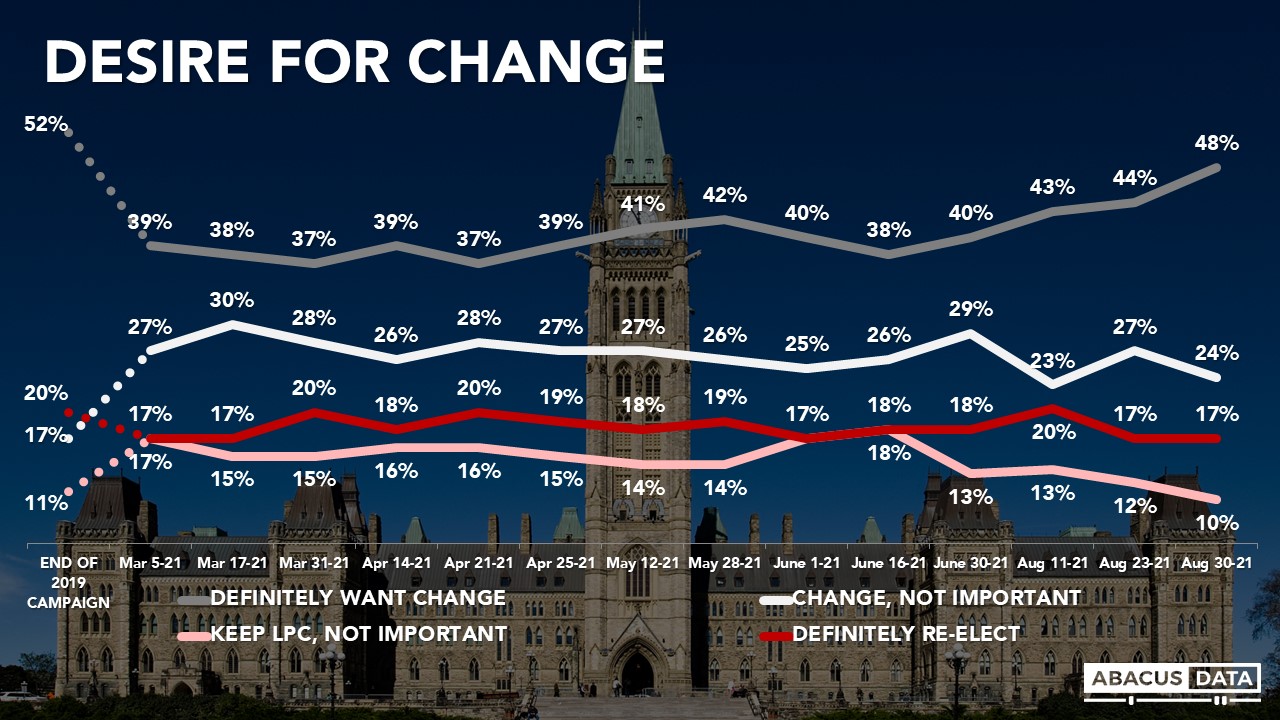
The vote preference by change group is important to understanding the election. Among those who say they want change but it isn’t important (24% of the electorate at the moment), the Liberals are slightly ahead of the NDP. As long as the Liberals can win a large share of this group, they can be re-elected.
But if those in this group migrate up to “definitely want change”, it’s far less likely they will vote Liberal. As perceptions about the competitiveness of the election shifts, the split in these groups could also change.
PREFERRED PRIME MINISTER
Today, 36% of voters would prefer Justin Trudeau be PM after the election, 32% would prefer Erin O’Toole, and 25% Jagmeet Singh. O’Toole is preferred in the Prairies by a wide margin with Mr. Trudeau behind Mr. Singh.

In BC, 37% would prefer Singh and 34% Trudeau, followed by O’Toole at 25%. In Ontario, Trudeau is preferred by 37% followed by O’Toole (31%) and Singh (24%). In Quebec, Trudeau is well ahead of O’Toole (43% to 27%) followed by Singh at 189In Atlantic Canada Trudeau is the preference of 53% compared to 26% for O’Toole and 21% for Singh.
Asked if the choice was only between O’Toole and Trudeau, Trudeau would be the preference of 58% and O’Toole 42%. Trudeau would be chosen by 64% in BC, 59% in Ontario, 62% in Quebec and 70% in Atlantic Canada. O’Toole would be the preference of 61% in the Prairies. Trudeau would be the preference of 78% of NDP voters and 62% of BQ supporters. O’Toole would be the preference for 75% of vaccine refusers while 60% of those fully vaccinated would prefer Mr. Trudeau over Mr. O’Toole.
UPSHOT
According to Bruce Anderson: This race is about ready to kick into a higher gear, and the outcome is unpredictable. The key variables I’m watching are these:
1. Erin O’Toole has had a successful start and his gains have probably begun put him and his party under a different level of scrutiny – and made this election feel less like a referendum on Justin Trudeau and more like a conversation about the different choices on offer. Whether he and his party will fare well through that scrutiny is an unknown. The ugly protests of anti-vaxxers are a cloud that certainly does more to threaten Conservative prospects, than Liberal chances.
2. The NDP has made gains at the expense of both the Liberals and the Green Party. Will the gains hold, even as voters start to focus on the prospects of a Conservative government? If they don’t, the benefit will accrue to the Liberals, disproportionately. If the election feels like it comes down to a Trudeau or O’Toole government, soft NDP voters show a lopsided preference for the former.
3. The Liberals have been feeling the brunt of frustrations that build up over years for an incumbent government and probably extra frustrations because of the mood impacts of the pandemic. Enough voters appreciate their record and approach to prefer them to the Conservatives, by a wide margin – making that that the apparent choice and sharpening the contrast is the work that they have cut out for them in the next three weeks.
According to David Coletto: This election is now close and competitive, and the outcome is far from clear.
We see evidence that Conservative supporters are re-engaged, the desire for change is trending up, while Liberal supporters have become less interested and engaged in the election since it started. That lends itself to a good environment for Mr. O’Toole and the Conservatives.
However, while the Conservative campaign has been able to animate past supporters, it hasn’t yet made much progress in converting past Liberal, NDP, Green, or BQ supporters– hence why it’s stuck at around its 2019 vote share. It’s almost like we have returned to normal – the political environment pre-pandemic.
The only difference remains the stronger position for the NDP and Mr. Singh. Despite more viewing Mr. Singh positively than last week, the NDP’s vote share has stalled. More people are open to voting NDP (50%) than at any point in the past two years, but they remain hesitant to support the party outright. That could change, but as the dynamics of the campaign shift away from a focus on Mr. Trudeau and why the election was called, to what a potential Conservative government might or might not do, the risk for the NDP’s support to be squeezed will increase.
By suggesting he’d be open to working with Mr. O’Toole if the Conservatives win the most seats, Mr. Singh may be playing with fire given that 82% of NDP supporters would prefer a Liberal government over a Conservative one.
METHODOLOGY
The survey was conducted with 2,000 Canadian adults eligible to vote from August 24 to 29, 2021. A random sample of panelists were invited to complete the survey from a set of partner panels based on the Lucid exchange platform. These partners are typically double opt-in survey panels, blended to manage out potential skews in the data from a single source.
The margin of error for a comparable probability-based random sample of the same size is +/- 2.2%, 19 times out of 20.
The data were weighted according to census data to ensure that the sample matched Canada’s population according to age, gender, educational attainment, and region. Totals may not add up to 100 due to rounding.
This survey was paid for by Abacus Data Inc.
Abacus Data follows the CRIC Public Opinion Research Standards and Disclosure Requirements that can be found here: https://

ABOUT ABACUS DATA
We are the only research and strategy firm that helps organizations respond to the disruptive risks and opportunities in a world where demographics and technology are changing more quickly than ever.
We are an innovative, fast-growing public opinion and marketing research consultancy. We use the latest technology, sound science, and deep experience to generate top-flight research-based advice to our clients. We offer global research capacity with a strong focus on customer service, attention to detail and exceptional value.
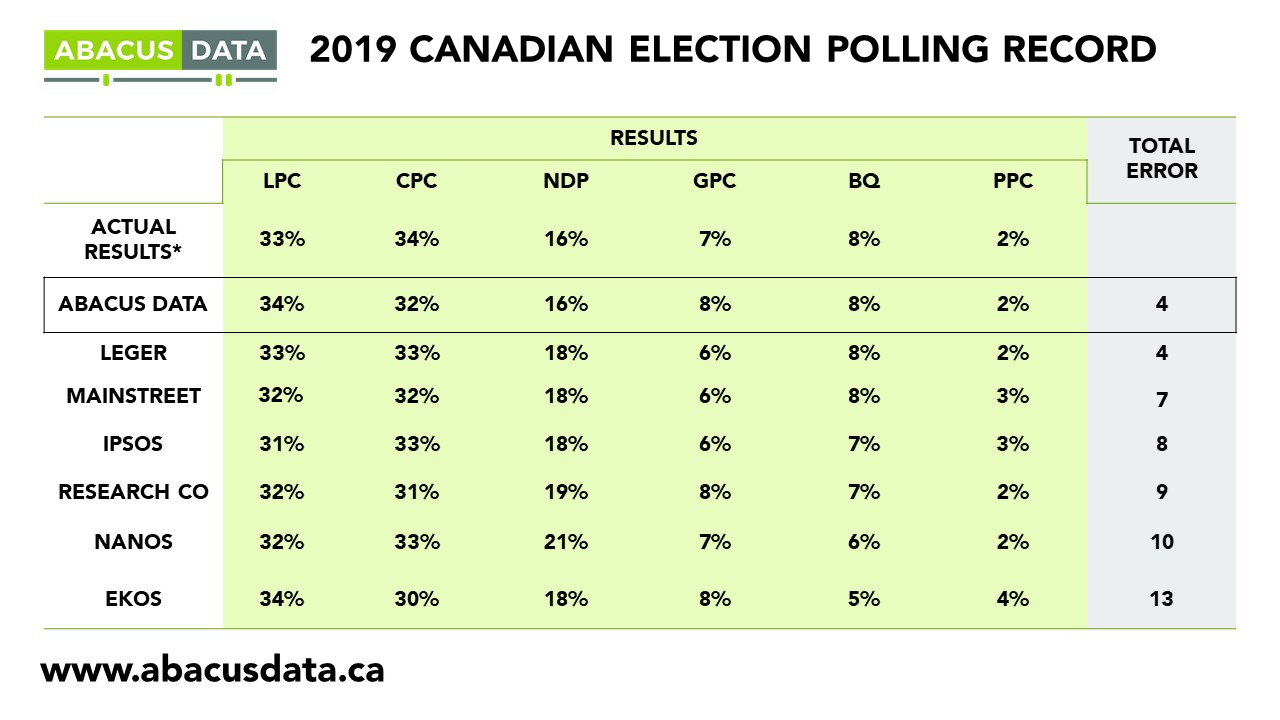
We were one of the most accurate pollsters conducting research during the 2019 Canadian Election.
Contact us with any questions.
Find out more about how we can help your organization by downloading our corporate profile and service offering.