Liberals up by 11 as Conservatives stuck below 30%
June 23, 2020
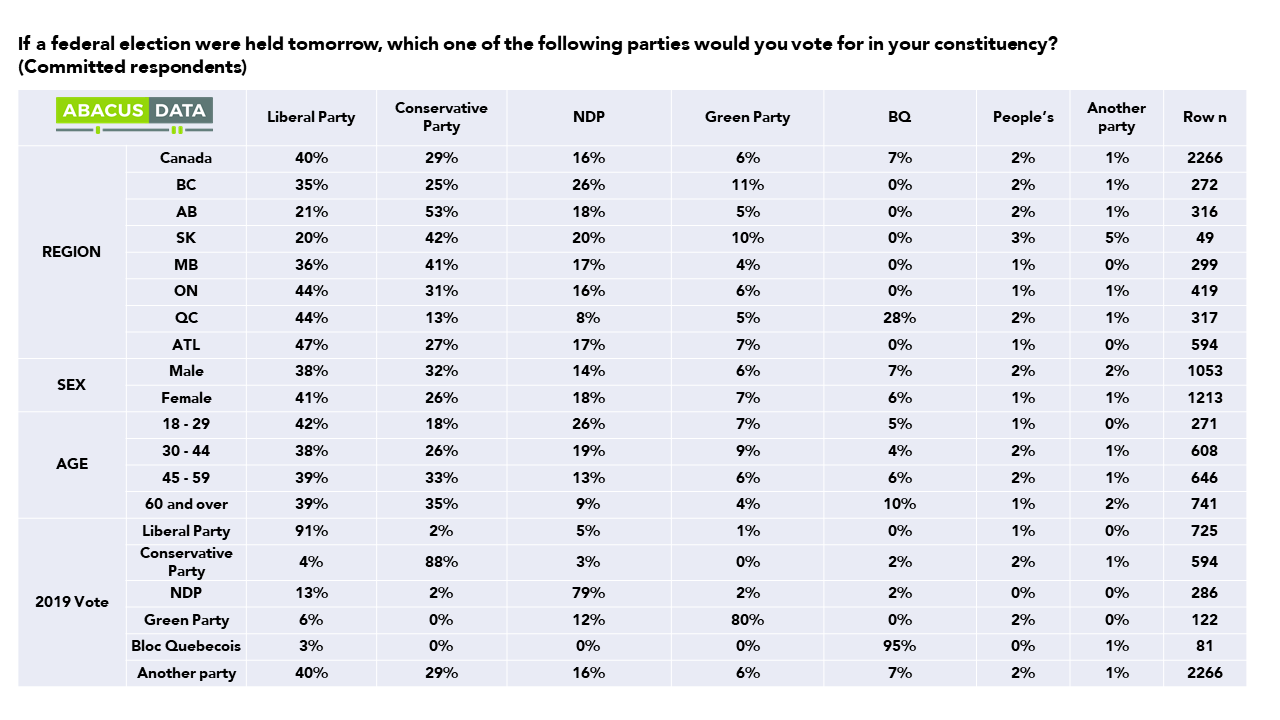
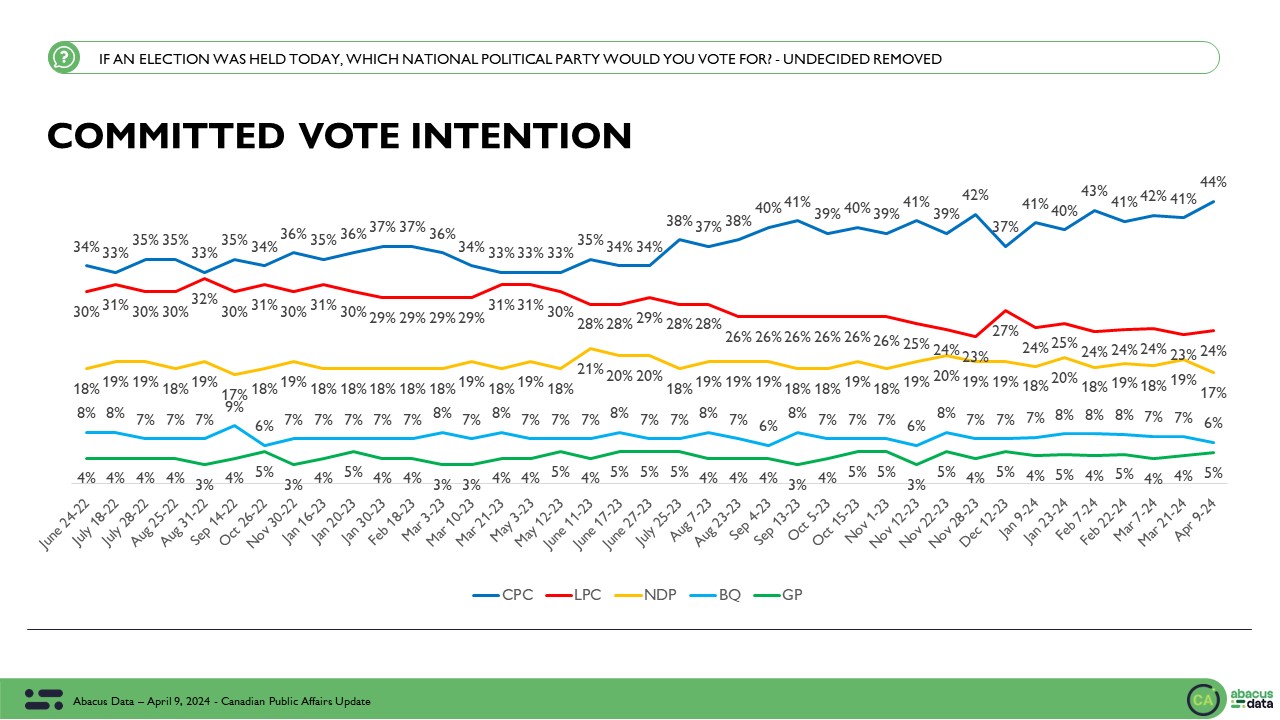
If an election were held at the time of the survey, the Liberals would win 40%, the Conservatives 29% and followed by the NDP at 16%, the Greens at 6%, and the BQ at 7%. Just prior to the pandemic, the Liberals and Conservatives were within a point of each other.

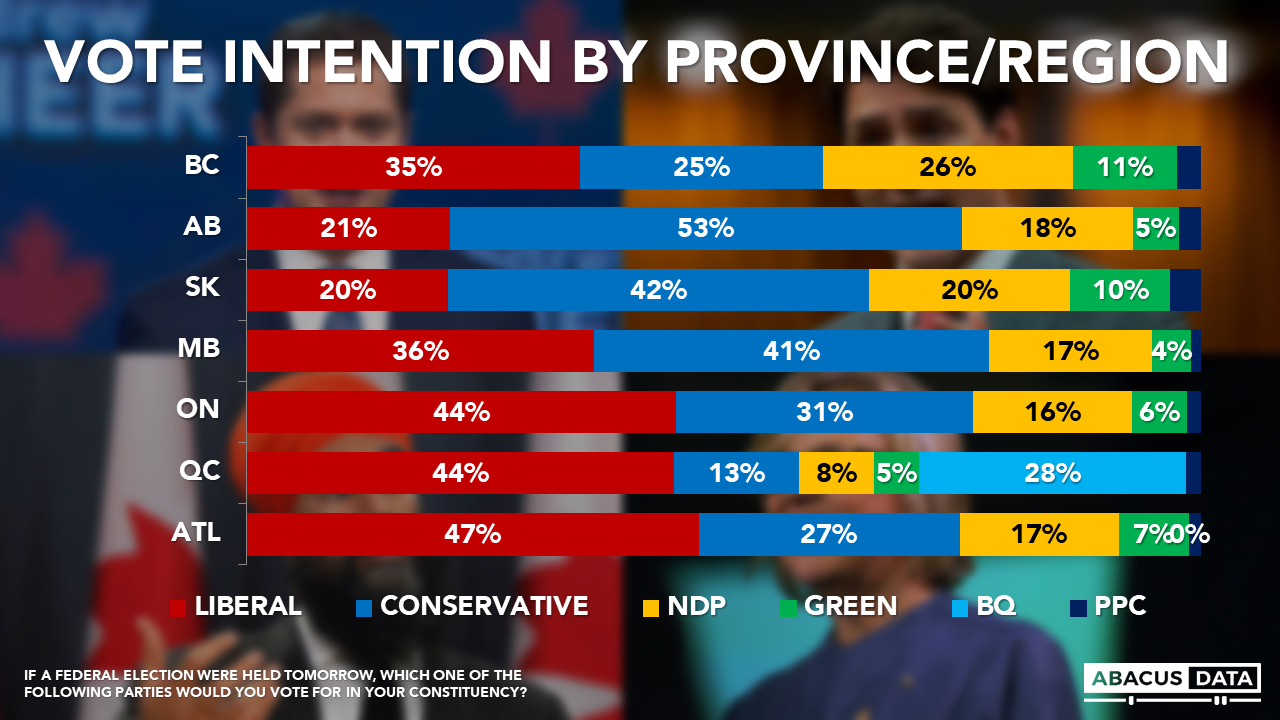
The Conservatives have a 32-point lead over the Liberals, in Alberta, an 18-point lead in Saskatchewan and a 5-point lead in Manitoba.
The Liberals have a 9-point lead over the NDP in BC, a 13-point lead in Ontario, and a 16-point advantage over the BQ in Quebec, and a 20-point lead in Atlantic Canada.
While the NDP have seen some gains in support in BC, they have dropped to just 8% in Quebec.
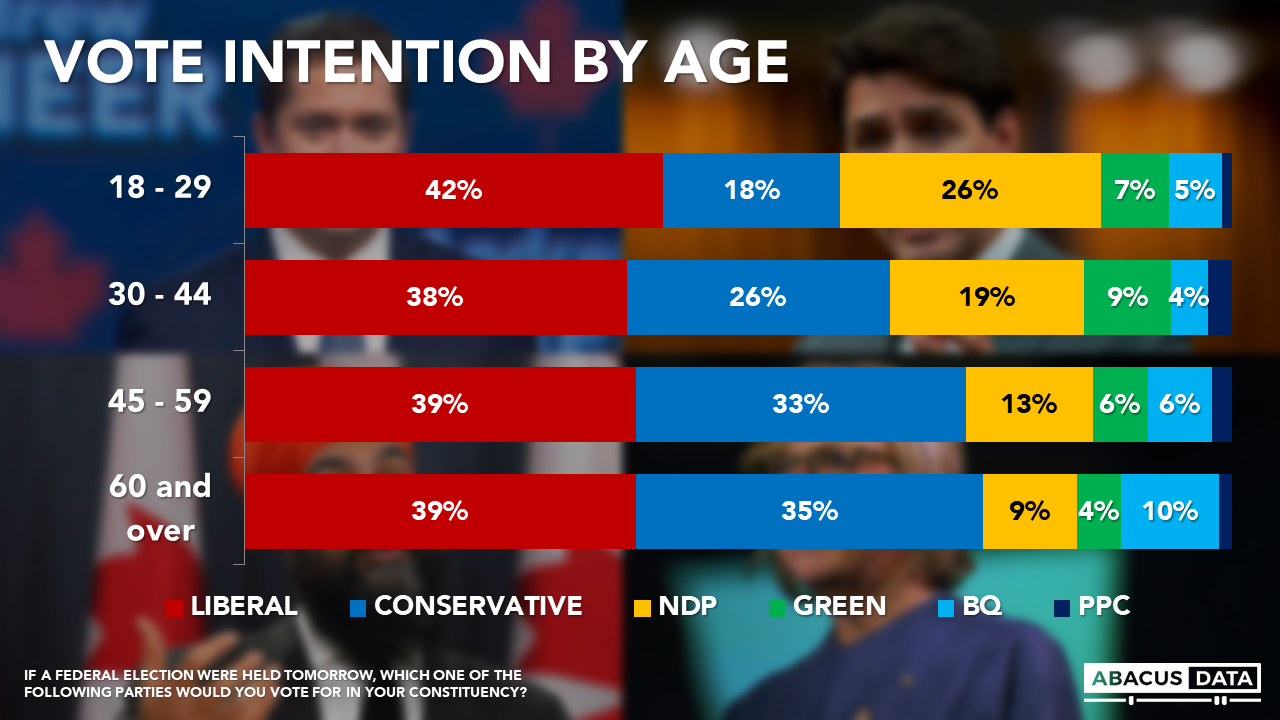
The Liberals lead every age group, and among both men and women. They have a 25-point lead among immigrants and a 21-point lead among racialized Canadians.
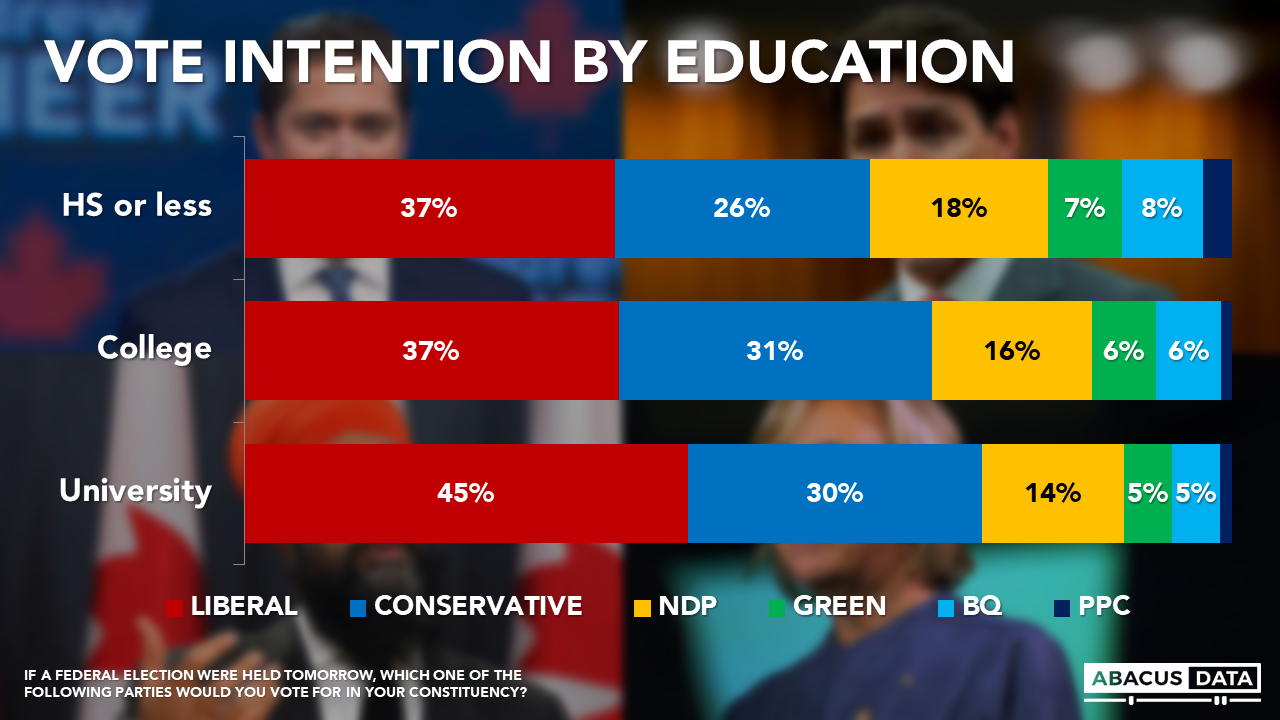
The Liberals also lead across all education groups. They have a 11-point lead among those with High School or less, 6-points among those who attained a college degree, and 15-points among those with a university education.
ACCESSIBLE VOTER POOLS: 55% WOULD CONSIDER VOTING LIBERAL; 46% NDP, 43% CONSERVATIVE.
Today, 55% of Canadians would consider voting Liberal, the highest we have recorded since November 2018. The Liberals have sizeable potential voter pools in BC (62%), Ontario (59%), Quebec (52%), and Atlantic Canada (67%). 4 in 10 Albertans say they are open to voting Liberal as do half of those living in Saskatchewan and Manitoba.
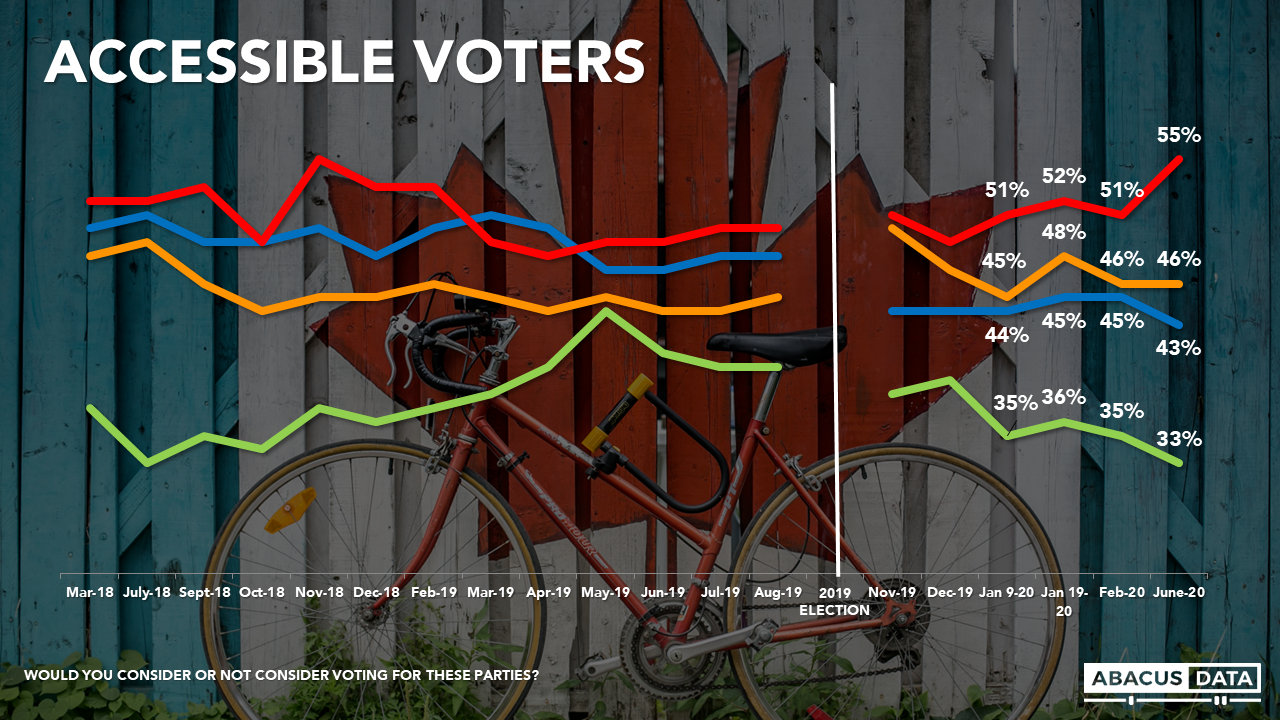

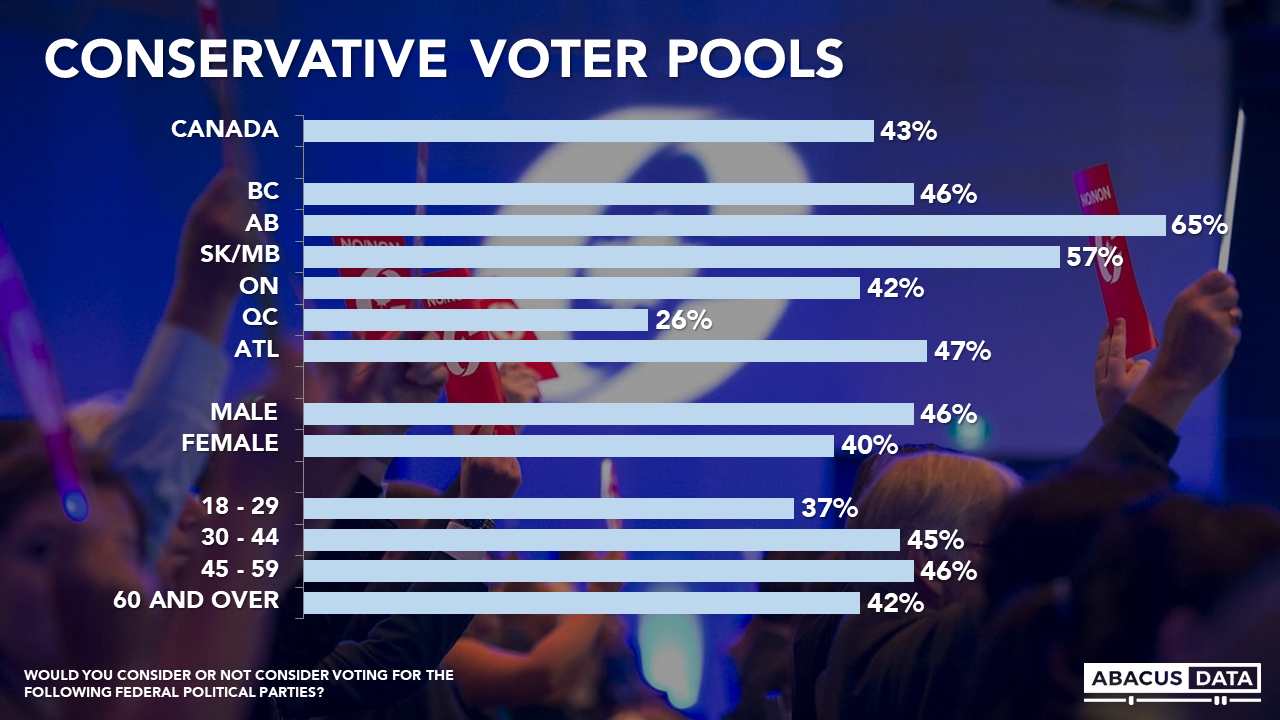
The Conservative Party’s voter pool, at 43%, is the lowest it has been since soon after the 2015 election. Going into the 2019 federal election, 48% said they would consider voting Conservative. Since the election, the party’s accessible voter pool has decreased.
Potential Conservative voters are more likely to live in the Prairies. 42% of Ontarians, 46% of British Columbians, and only 26% of Quebecers would consider voting Conservative. Men are more likely than women to consider voting for the Conservatives while those aged 18 to 30 are the least likely age group to be open to voting Conservative.
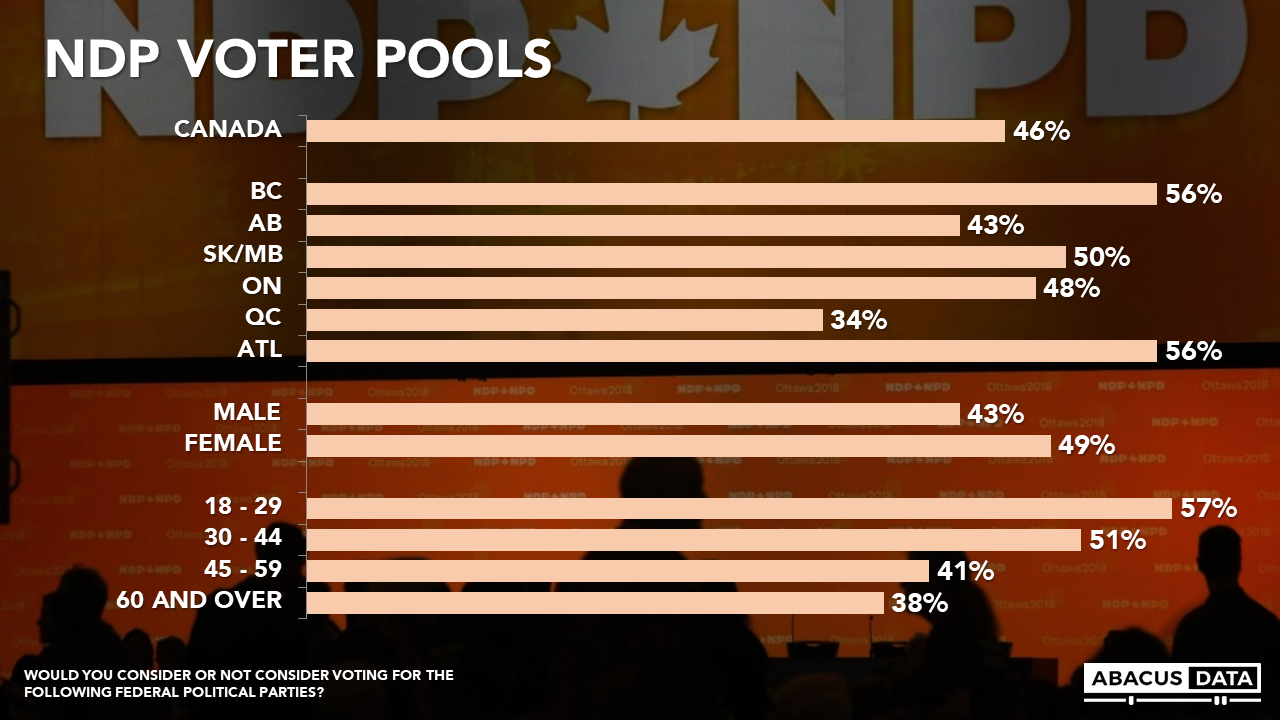
The NDP’s voter pool, at 46% today, has remained relatively consistent hovering between 44% and 48% for most of 2019 and 2020. The party’s voter pool is largest in BC (56%) and Atlantic Canada (56%), with about half in Ontario open to voting NDP. Only 34% of Quebecers say they would even consider voting NDP today.
Women are more likely than men to be open to the NDP as are younger Canadians. While almost six in ten 18 to 30 year olds are open to voting NDP, only about 4 in 10 among those aged 45 and over would consider voting for the New Democrats.
TRUDEAU & SINGH MORE POPULAR THAN SCHEER, MACKAY, AND O’TOOLE.
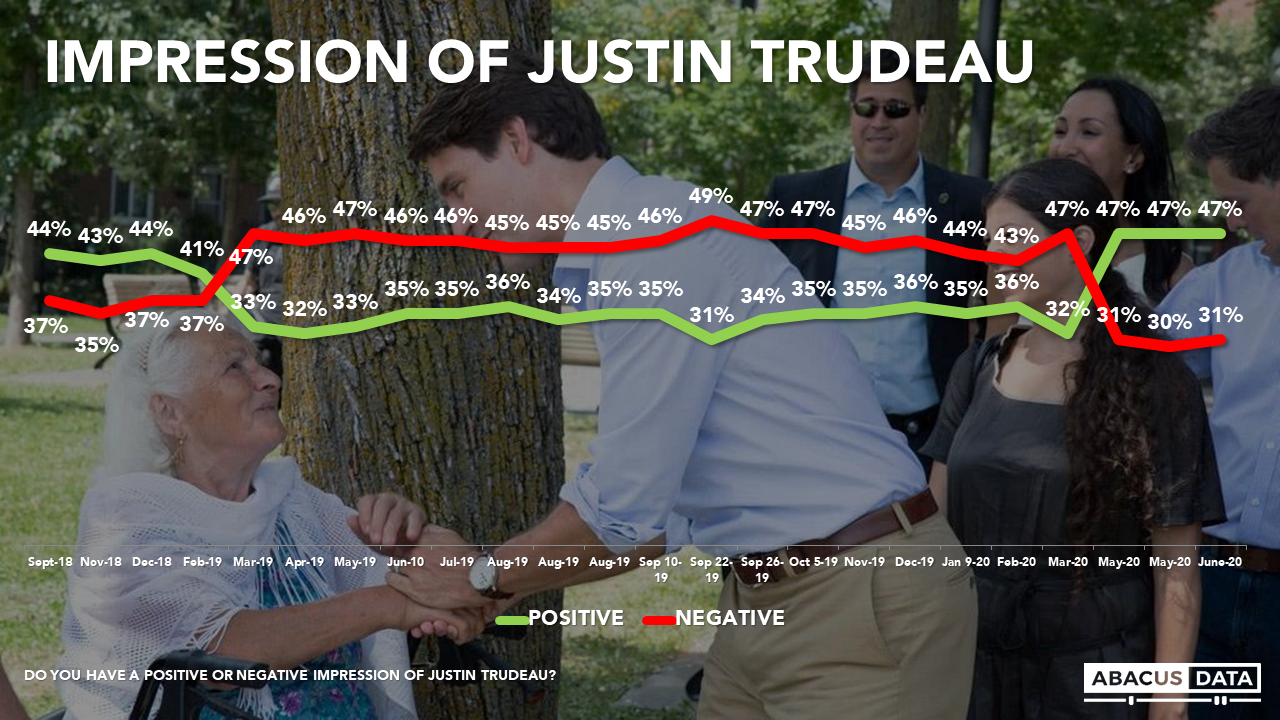
Feelings towards Mr. Trudeau are 47% positive, and his negatives are 31% unchanged over the past few waves of research. He has a positive net score everywhere except for in Saskatchewan and Alberta.
Conservative Leader Andrew Scheer has 19% positive opinion and 45% negative, a slight improvement since May. In Alberta, where the Conservatives swept every seat, Mr. Scheer’s positives are 28% and his negatives 37%. Mr. Scheer has net negatives among immigrants and racialized Canadians but his numbers are worse among people born here and non-racialized people. His biggest weaknesses are -31 in Quebec and -33 among those with university education.

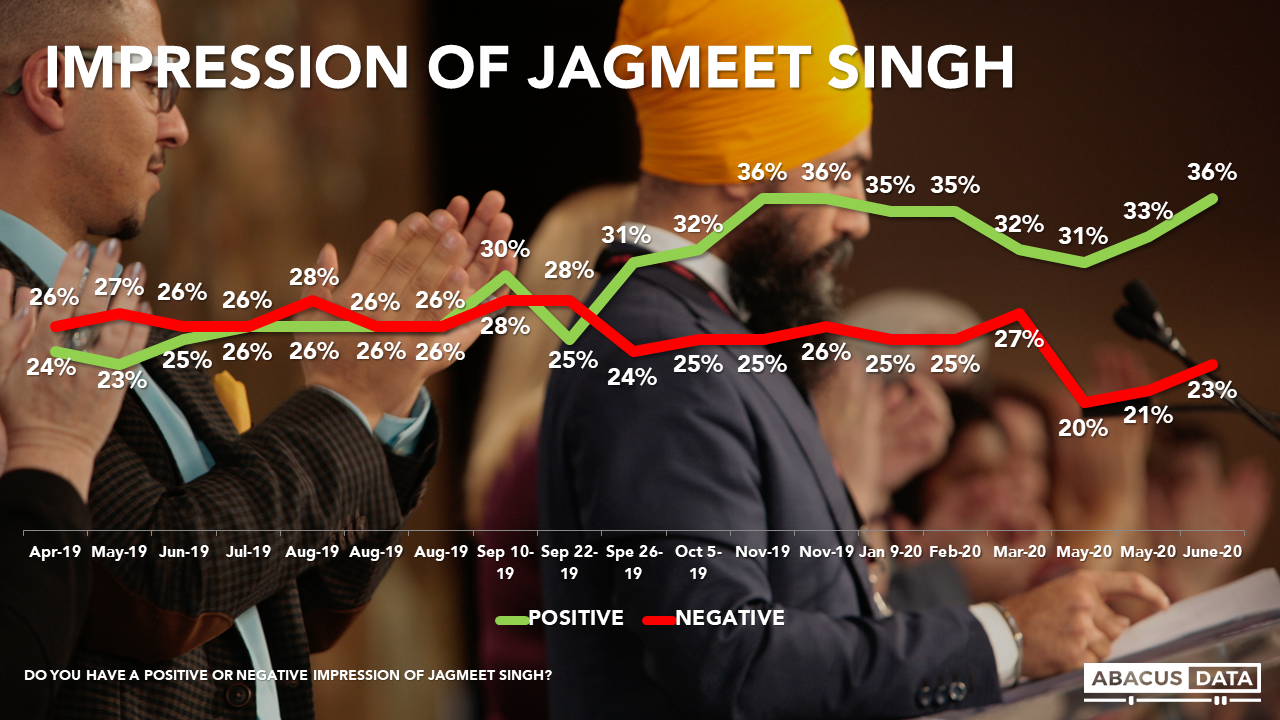
Ratings for NDP leader Jagmeet Singh are 36% positive (the highest since soon after the 2019 election) and his negatives are at 23%. His positives are up 5-points since mid-May while his negatives are up 3-points.
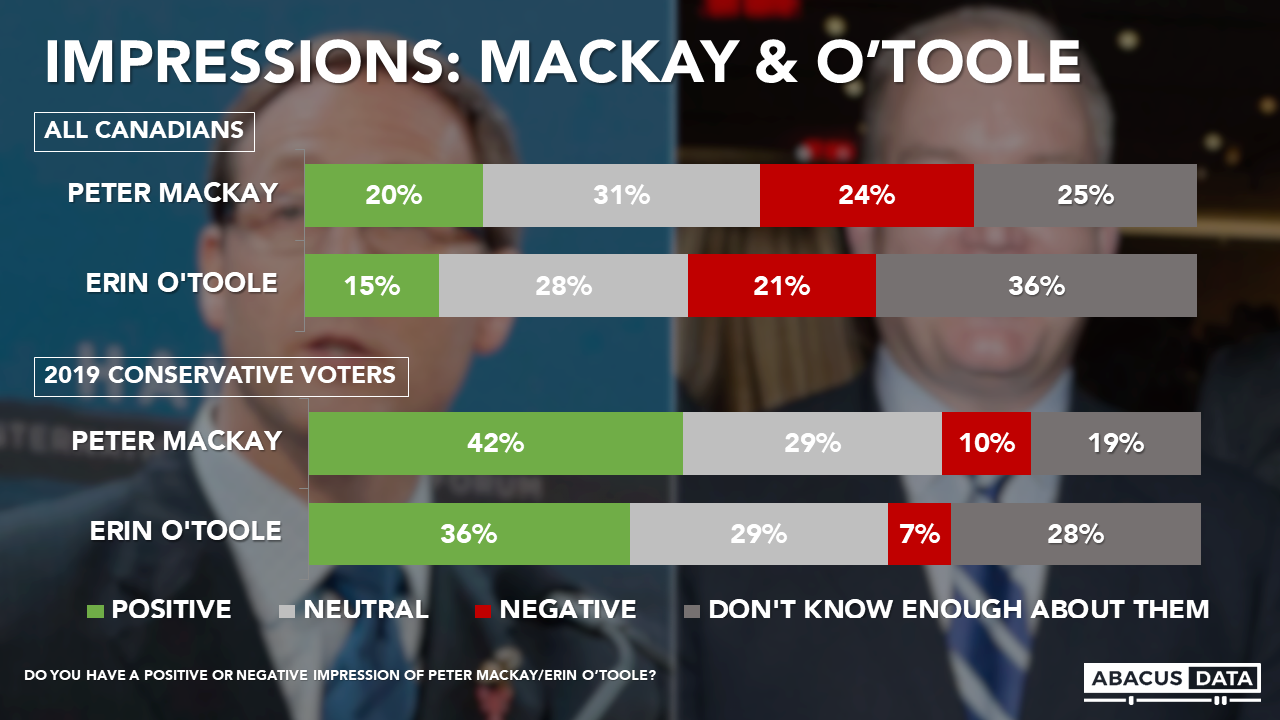
For Peter MacKay, 20% of Canadians report a positive view, 24% negative. Among 2019 Conservative voters, 42% like Mr. MacKay and 10% dislike him.
For Erin O’Toole, 15% report positive, and 21% negative views. Among 2019 Conservative voters, Mr. O’Toole is liked by 36% and disliked by7%. This represents a narrowing of the gap between these two front runners since our previous poll.
UPSHOT
According to Bruce Anderson: “Politics in Canada is in a state of suspended animation. There’s no telling how the next six months will evolve in terms of the pandemic and the economy – but for now, people are satisfied with the response of the Liberals.
Opposition party criticisms are not finding much traction – whether about the House sitting, action on gun control, deficit spending – voters have narrowed their priorities and are hoping for the best, and hoping to avoid the worst. Racial inequality is also prominent today. And for many, the climate change issue has not receded, it is an abiding and urgent priority.
This context naturally favours an activist agenda focused on health protection and steadying the economy, as well as efforts to combat racism and climate change. It is as such a poor backdrop for a Conservative leadership race, at least one in which half the candidates want to focus on social conservatism, and none of the candidates appear willing to make much of an effort to talk about battling climate change and systemic racism.”
According to David Coletto: “Thirteen weeks into the pandemic and the political landscape looks quite different than when it all started. The Liberals have a solid lead nationally, built on broad approval of the government’s performance and goodwill towards the Prime Minister. About half the country has positive views of the Prime Minister, steady over the past two months.
In contrast, the Conservative Party finds itself in far worse condition today than at any point in the past 5 years. Only 43% of Canadians would consider voting Conservative, three points lower than the NDP. The party trails the Liberals by 11-points nationally, 13-points in Ontario, 31-points in Quebec, and 10-points in Quebec.
More troubling, the party is a distant third among those under 30 and trails the Liberals among 30 to 44-year-olds. Even among those over 60, a demographic the Conservatives can typically count on, they trail the Liberals by three.
Andrew Scheer is widely disliked, even in the Conservative stronghold of Alberta. Back in December 2019, we explored the Conservative Party’s brand. It seems little has changed in how Canadians perceive the party and its prospects since then.
NDP support has held steady throughout the pandemic hovering between 15% and 19%. It has pockets of support in BC and some parts of Ontario, but lacks any regional foothold to grow from. Although it does relatively well among younger Canadians, the party barely registers above 10% among those 45 and over.
Although Jagmeet Singh has a net positive image and 46% would consider voting NDP, a level consistent with most of 2019 and 2020, the party is struggling to differentiate itself while the Liberals hold the centre-left of the political spectrum.”
ABOUT ABACUS DATA
We are the only research and strategy firm that helps organizations respond to the disruptive risks and opportunities in a world where demographics and technology are changing more quickly than ever.
Find out more about what we are doing to help clients respond to the COVID-19 pandemic.
We are an innovative, fast-growing public opinion and marketing research consultancy. We use the latest technology, sound science, and deep experience to generate top-flight research-based advice to our clients. We offer global research capacity with a strong focus on customer service, attention to detail and exceptional value.
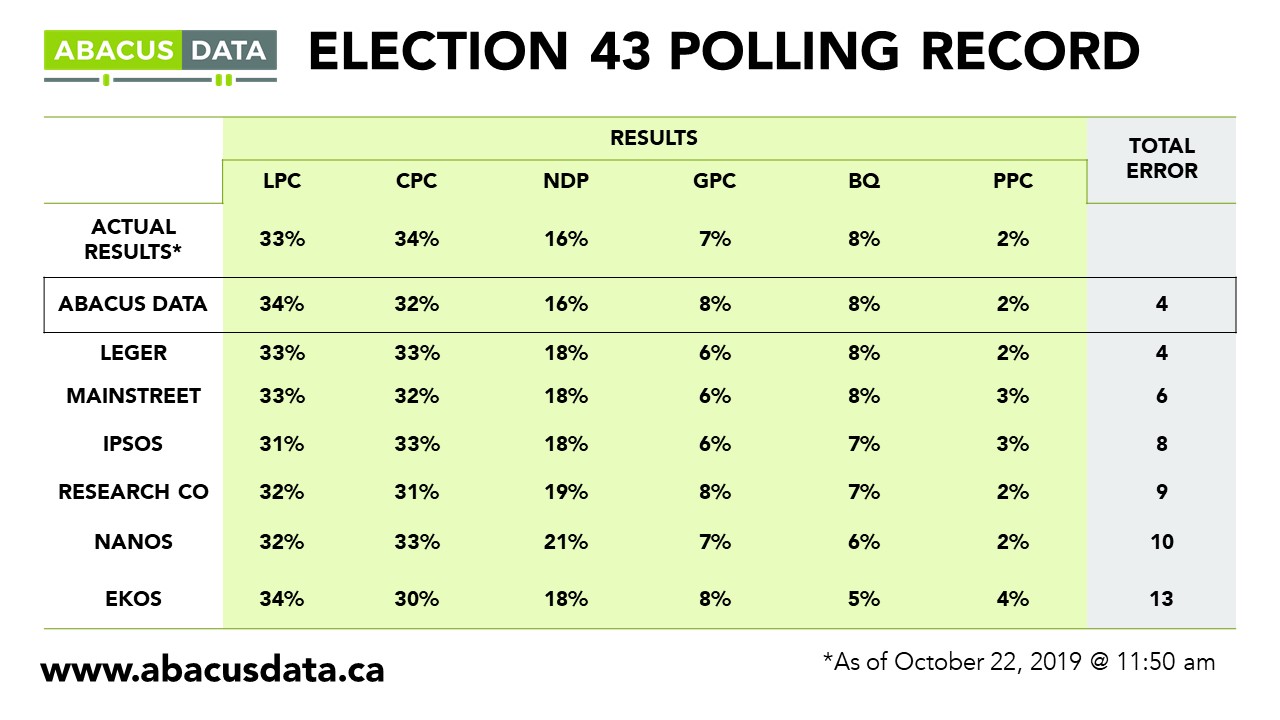
We were one of the most accurate pollsters conducting research during the 2019 Canadian Election.
Contact us with any questions.
Find out more about how we can help your organization by downloading our corporate profile and service offering.
METHODOLOGY
The survey was conducted with 2,979 Canadian residents from June 12 to 21, 2020. A random sample of panelists were invited to complete the survey from a set of partner panels based on the Lucid exchange platform. These partners are typically double opt-in survey panels, blended to manage out potential skews in the data from a single source.
The margin of error for a comparable probability-based random sample of the same size is +/- 1.8%, 19 times out of 20.
The data were weighted according to census data to ensure that the sample matched Canada’s population according to age, gender, educational attainment, and region. Totals may not add up to 100 due to rounding.