The Race for 24 Sussex
September 15, 2015
Mulcair most popular, but has lost ground
Trudeau’s campaign shows good results
Harper negatives hit new high
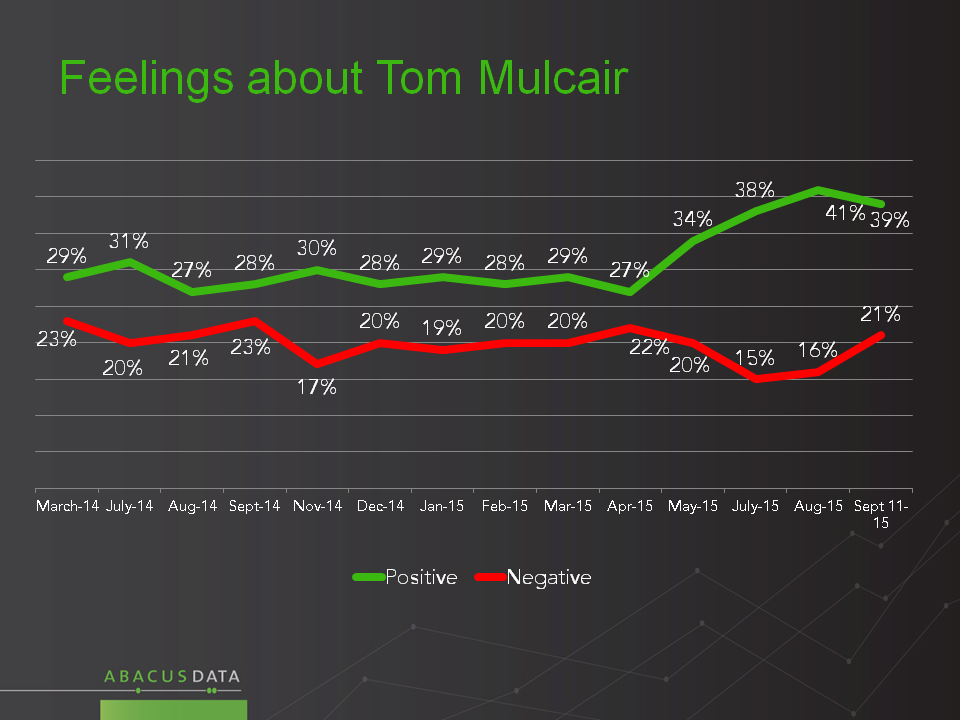
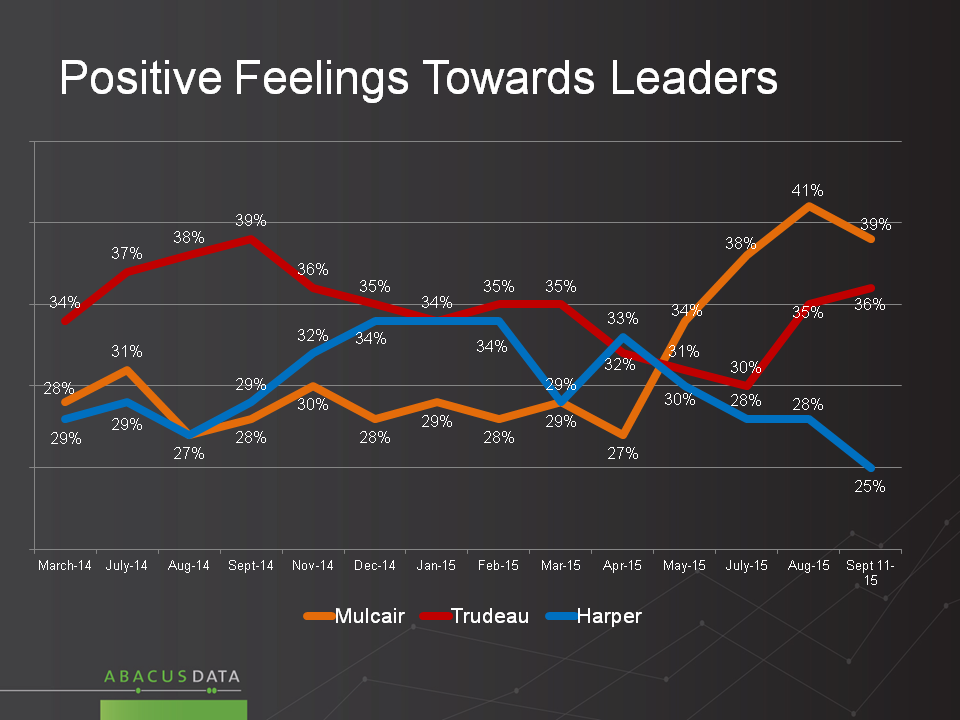
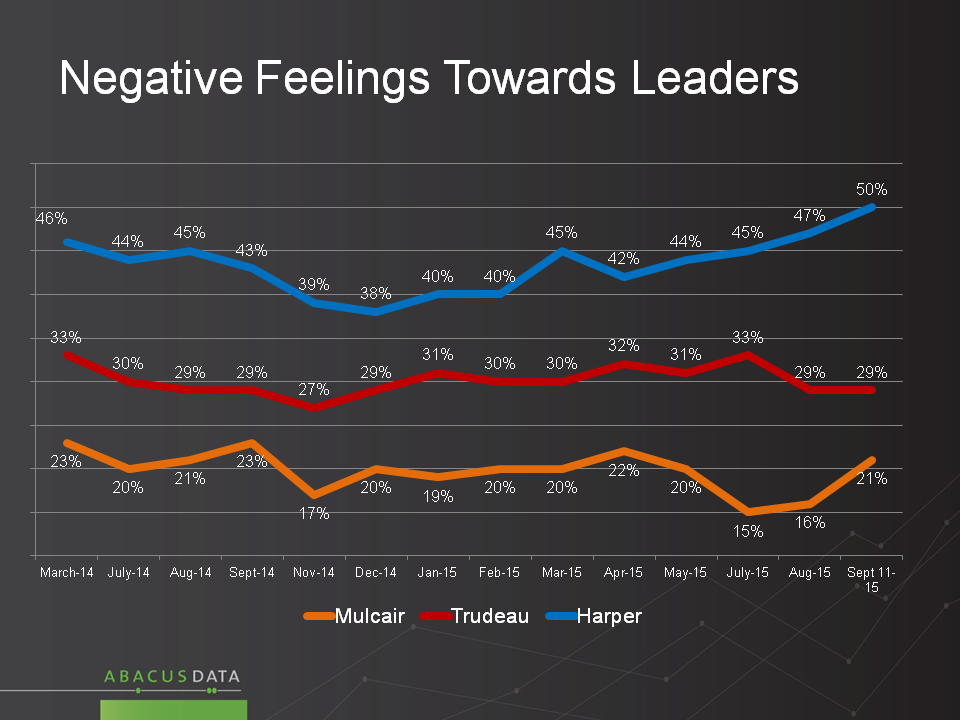
After soaring from April of this year, our latest survey shows a softening of impressions of NDP Leader Thomas Mulcair. His positives sagged slightly (2 points) to 39% and his negatives jumped 5 points to 21%.
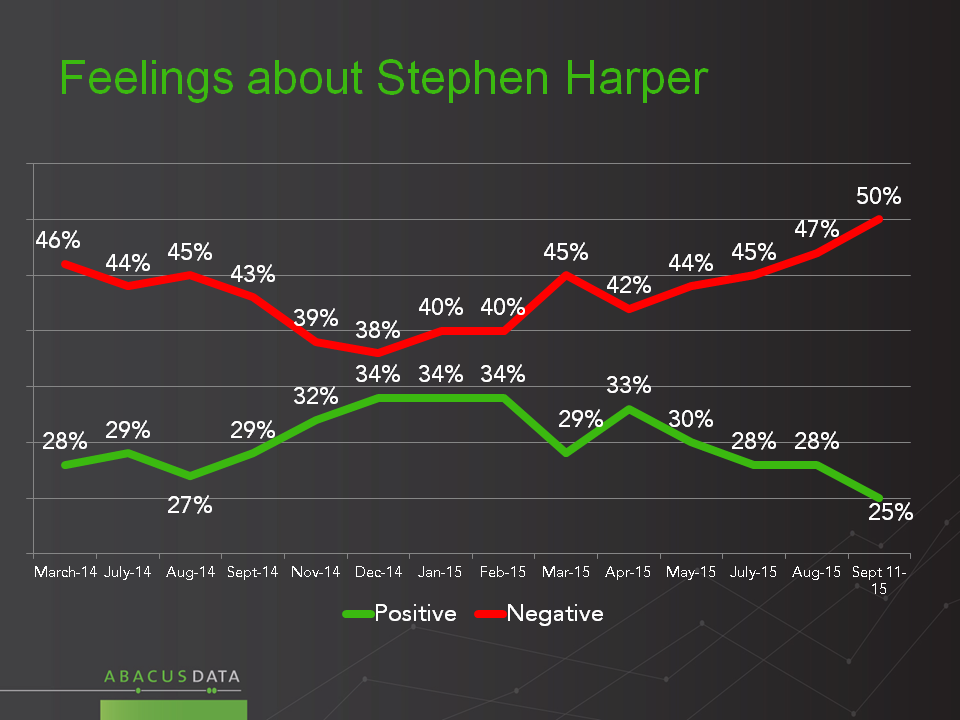
For Stephen Harper, the news is worse. Positive feelings about the PM have hit a new low of 25%, down 9 points from his level in February of this year. His negatives hit a new high of 50%, up a remarkable 16 points from December.
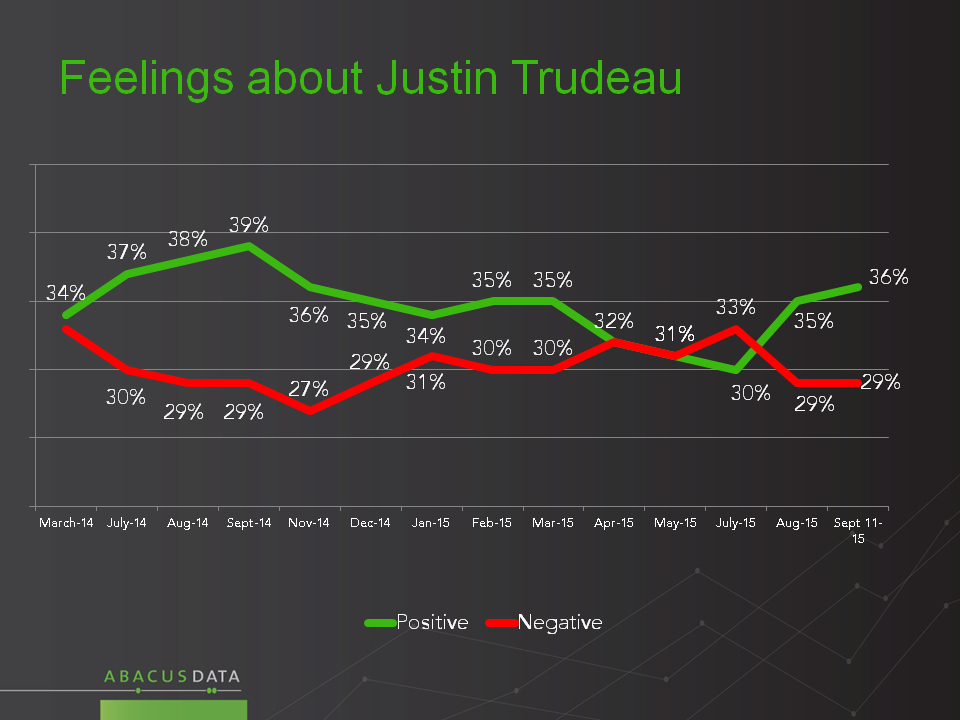
For Justin Trudeau the news is that he has held the gains we saw in our last wave of surveying. His positives are 36%, and his negatives 29%. His net score is 10 points better than it was in July.
What to make of the leaders?
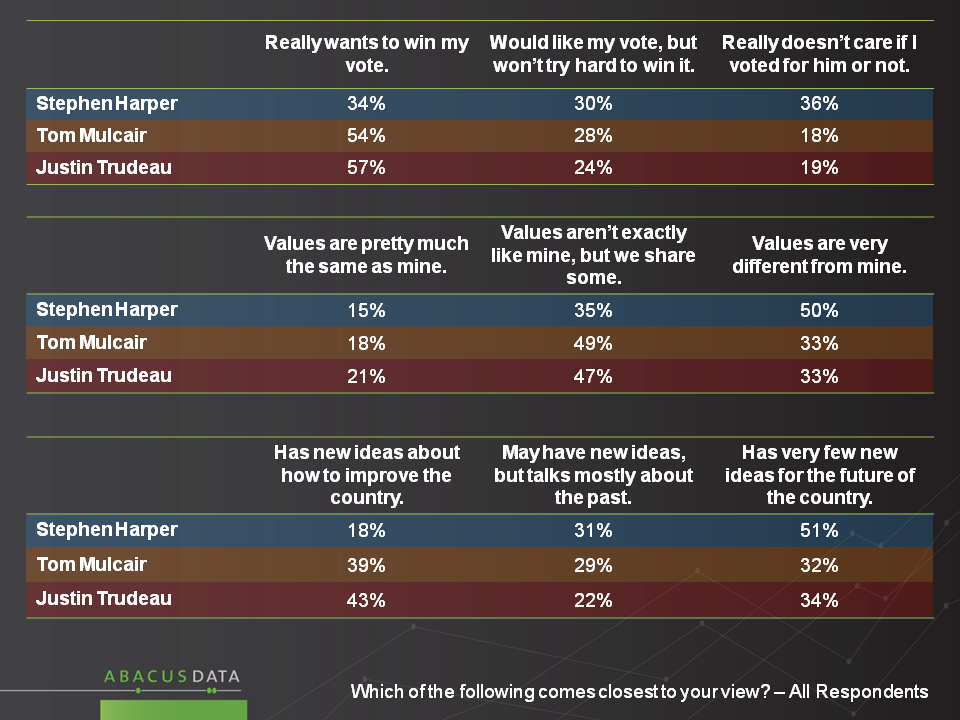
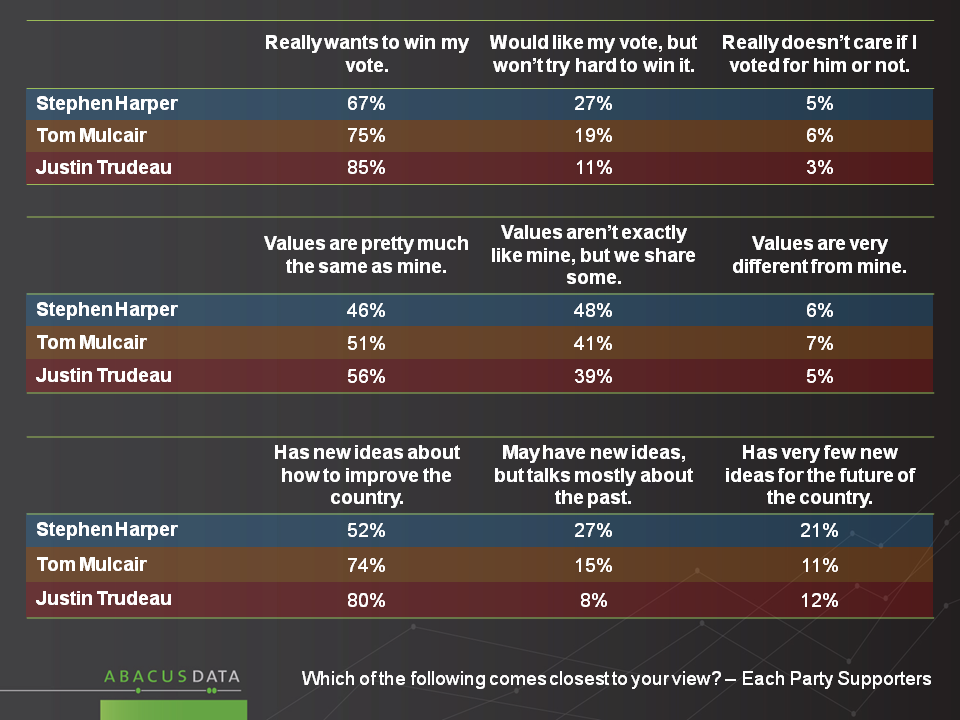
We asked the same three questions about each leader: how much do they want my vote, how close are their values to mine, and do they have new ideas about how to improve the country. The results paint a picture of how voters see their choices.
Both Mr. Mulcair (54%) and Mr. Trudeau (57%) are seen as really wanting to “win your vote”, compared to 34% who say the same thing about Mr. Harper. 36% say Mr. Harper “really doesn’t care if I vote for him” about twice as many who say that about the other leaders.
When it comes to values, few people say any of the leaders’ values are “pretty much the same as mine”. A combined 50% say their values are pretty much the same, or “not exactly but we share some of the same values” as Mr. Harper. 67% say the same thing about Mr. Mulcair and 68% about Mr. Trudeau. 50% say Mr. Harper’s values are very different from mine, compared to 33% for the other two leaders.
In Quebec, 76% say that Mr. Mulcair’s values are either pretty much like theirs or that he shares some of their values compared with 66% for Mr. Trudeau and only 35% for Mr. Harper. In Ontario, Mr. Trudeau leads slightly with 69% thinking he shares at least some of their values, followed by Mr. Mulcair at 66% and Mr. Harper at 55%.
When asked about their ideas, only 18% say Mr. Harper has new ideas about how to improve the country, compared to 39% for Mr. Mulcair, and 43% for Justin Trudeau.
Because the way partisans feel about their party’s leaders can have a lot to do with their determination to turn out and vote it is worthwhile to look at how each party’s supporters rate their leaders on these questions.
Conservative Party voters are least likely to say their party’s leader really wants their vote (67%), has values pretty much the same as theirs (46%), and has new ideas about how to improve the economy (52%).
Liberal Party voters are at the other end of the spectrum, with 85% saying Mr. Trudeau really wants their vote, 56% say his values are pretty much the same as theirs, and 80% say he has new ideas about how to improve the country.
Mr. Mulcair’s ratings among his party’s supporters are significantly better than those of Mr. Harper, but not quite as strong as those of Mr. Trudeau.
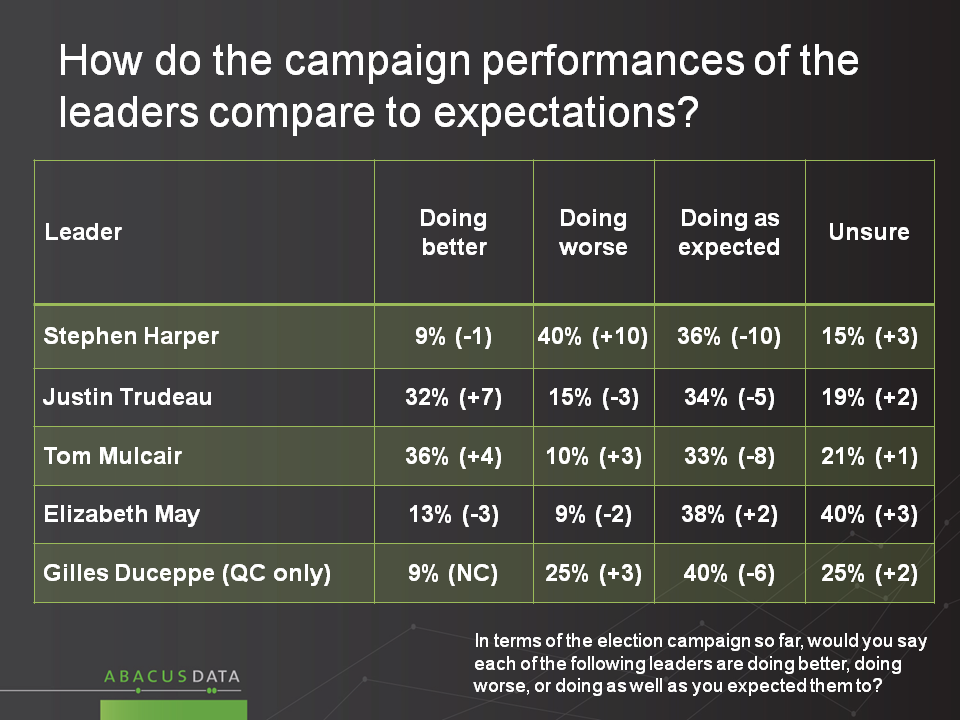
Campaign Performance
Both Mr. Mulcair and Mr. Trudeau tend to be seen as performing better than expected rather than worse than expected (32% better – 15% worse for Mr. Trudeau and 36% better – 10% worse for Mr. Mulcair). Only 9% say Mr. Harper is performing better than expected, while 40% say he is doing worse than they anticipated.
Since our last reading, these numbers show improvement for Mr. Trudeau (his net better vs worse rating improved 10 points) steady results for Mr. Mulcair (net rating shifted 1 point) and and 11-point negative shift for Mr. Harper.
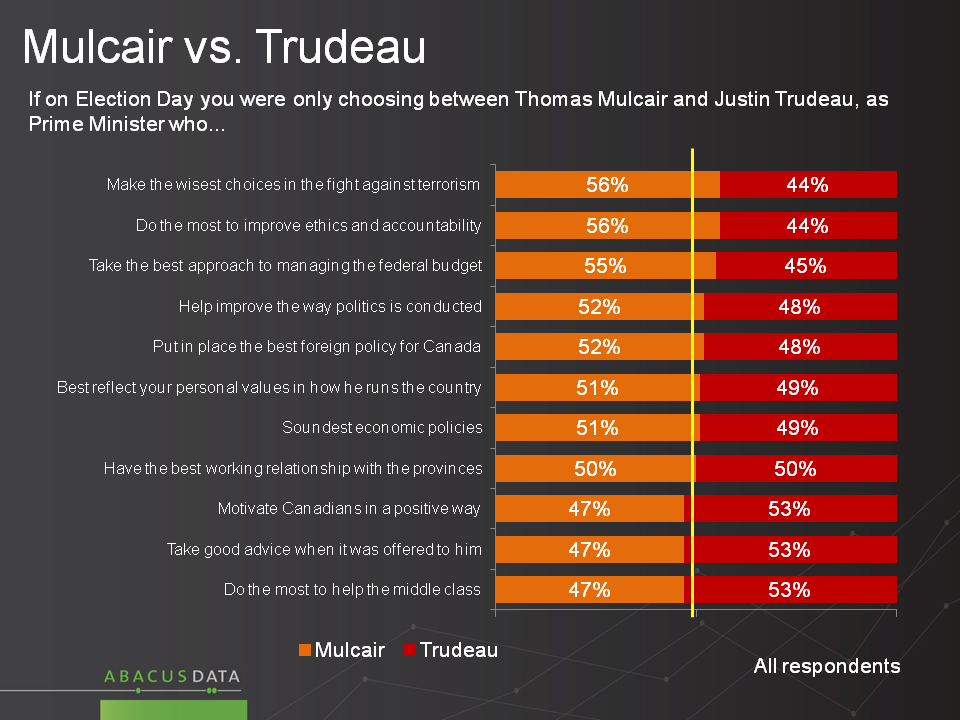
Mulcair v Trudeau head to head matchup
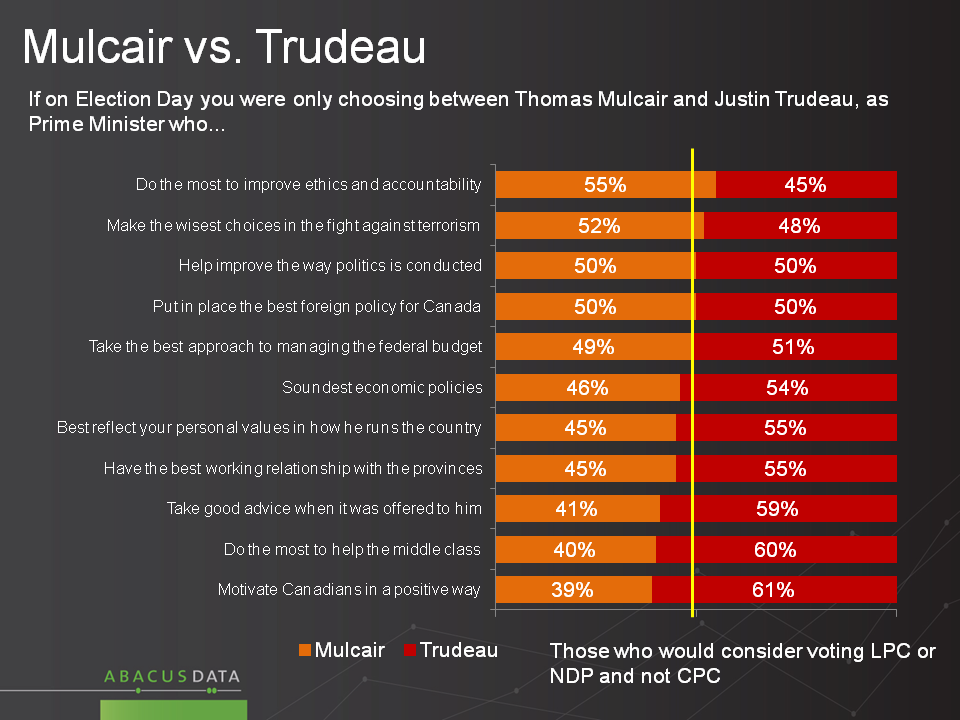
To find out how voters might evaluate a choice between Mr. Mulcair and Mr. Trudeau we asked people to compare the two on a series of measures. (In our next wave, we will do a similar test including Mr. Harper and one of the other leaders).
The results show the two leaders are close together in public esteem, with all 11 items showing a highly competitive race. Mr. Mulcair was preferred choice when it comes to:
• Making the wisest choices in the fight against terrorism
• Doing the most to improve ethics and accountability
• Best approach to managing the federal budget
Mr. Trudeau scored better for:
• Motivating Canadians in a positive way
• Taking good advice if it was offered to him
• Doing the most to help the middle class
The choice is effectively too close to call (a 2-point gap from a 50/50 result) on:
• Improving the way politics is conducted
• Best foreign policy for Canada
• Best reflect your personal values in how he runs the country
• Soundest economic policies
• Best working relationship with the provinces
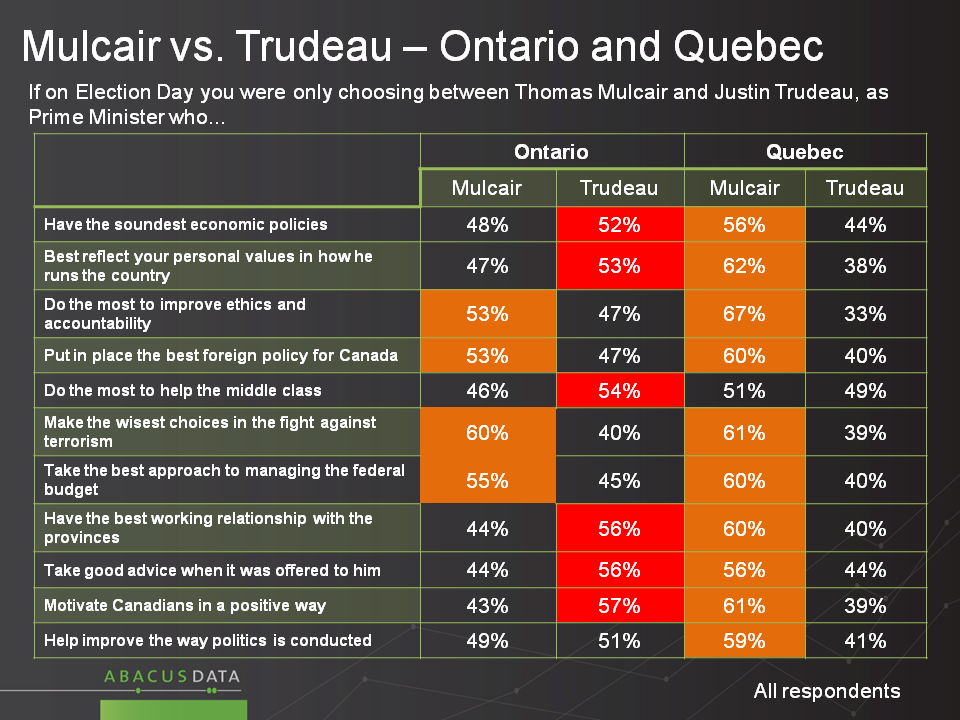
The difference of opinion between Ontarians and Quebecers is again evident, with Mr. Trudeau leading on five measures in Ontario compared with four for Mr. Mulcair. In Quebec, Mr. Mulcair beats Mr. Trudeau on all measures except one (Do most to help the middle class) on which they are effectively tied.
Worth noting is that when we look only at those voters who say they will consider voting for either for the Liberals or the NDP (but will not consider the Conservatives) the responses favour Mr. Trudeau, who leads on 6 items, while Mr. Mulcair leads on 1 and 4 items are too close to call.
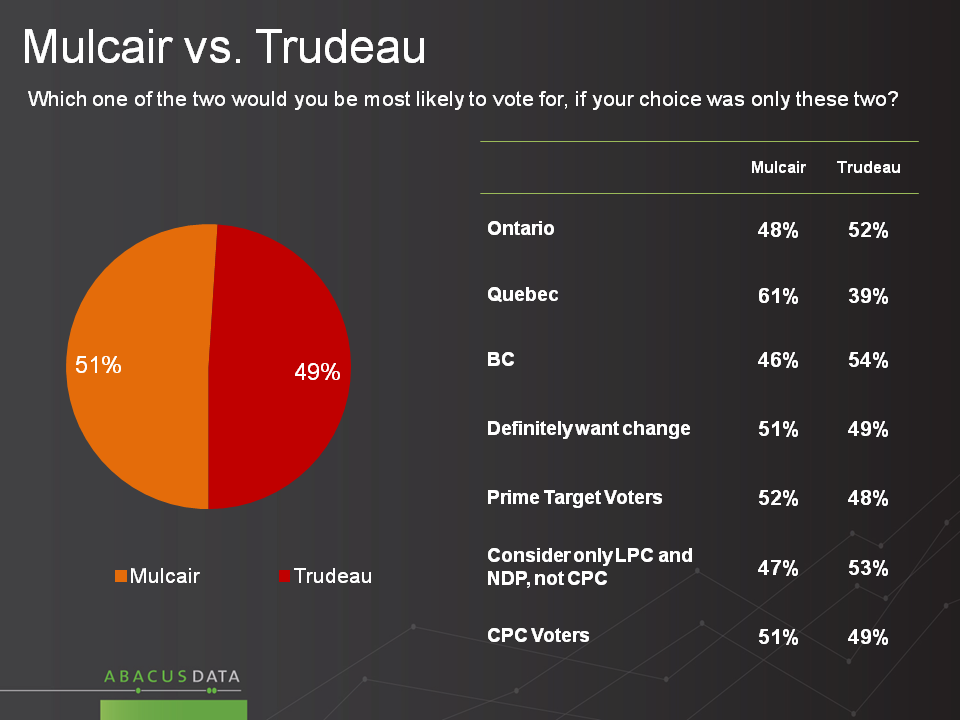
When pressed on which of the two they would ultimately vote for, Mr. Mulcair gets 51% to Mr. Trudeau’s 49%, an extraordinarily close result. In Quebec, Mr. Mulcair wins (61%-39%) while Mr. Trudeau prevails in BC (54%-46%) and in Ontario (52%-48%).
Among swing voters who will consider voting for either the Liberals and NDP but not the Conservatives, Mr. Trudeau leads 53%-47%.
The Upshot
This election will be influenced by platform ideas, but the outcome will also have a lot to do with impressions of the individual who would be Prime Minister and about the values they share with Canadians.
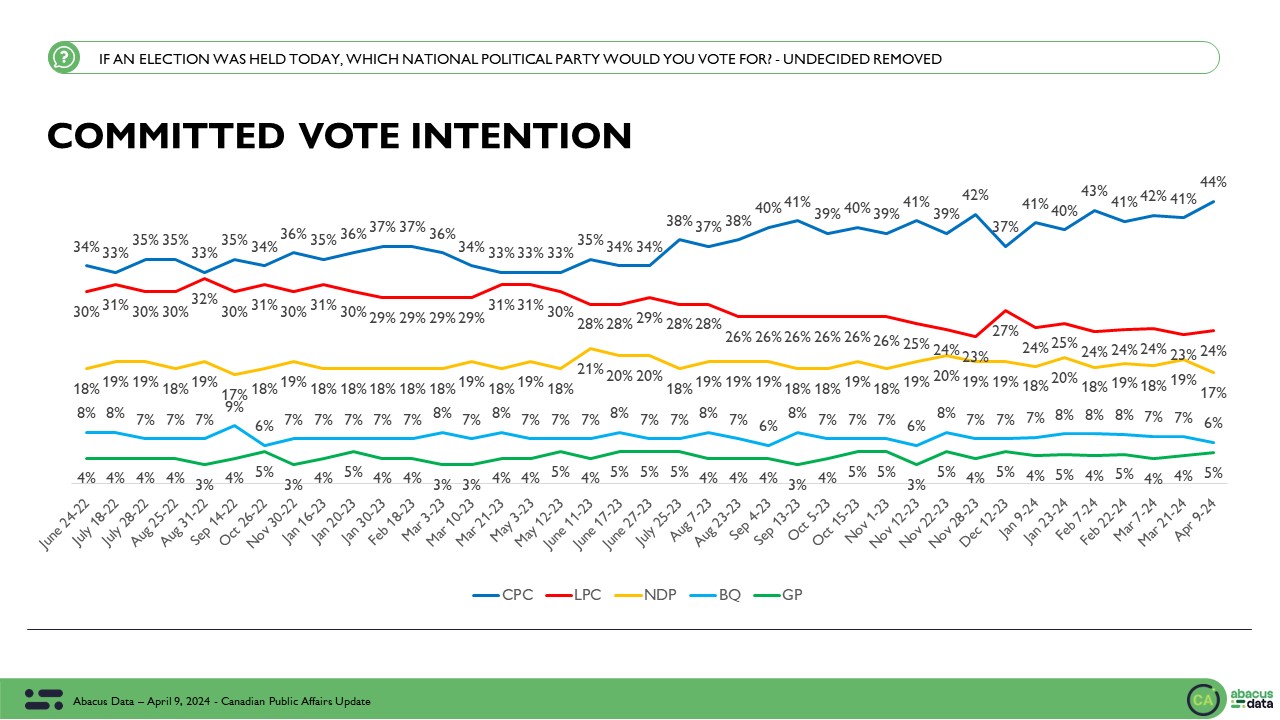
The results show that Mr. Harper’s party remains competitive nationally, but that he is running well behind the other leaders in popularity and is not enjoying as ardent support among supporters of his own party as had been the case in prior elections, or as enjoyed by the other main party leaders.
The sense of Mr. Harper’s campaign is that it is not going as well as the others’, that Mr. Harper seems a bit more indifferent about winning votes, less aligned with the values of voters, and offering fewer ideas about improving the economy. To win, barring a major failure by his opponents, he would likely need to improve these perceptions.
For those looking for a change in this election, the race between Mr. Mulcair and Mr. Trudeau is clearly narrowing. The Liberal leader had surrendered a lead to the NDP leader, and now the balance is shifting in the other direction. To understand the electoral implications of these patterns, it is critical to recognize the differences between perceptions in Quebec compared to the rest of the country. Mr. Mulcair maintains great strength in Quebec, where the NDP already holds a very large majority of the seats. His biggest growth opportunities are in Ontario, where the NDP holds a small fraction of the 121 seats contested this year.
In Ontario, Mr. Trudeau and the Liberal Party have become more competitive, and as the campaign rolls into its second half, enjoy a modest advantage in that province, and among voters who say their choice will come down to the NDP and Liberal Party.
Methodology
Our survey, commissioned by Abacus Data, was conducted online with 1,500 Canadians aged 18 and over from September 9 to 11, 2015. A random sample of panelists was invited to complete the survey from a large representative panel of over 500,000 Canadians, recruited and managed by Research Now, one of the world’s leading provider of online research samples.
The Marketing Research and Intelligence Association policy limits statements about margins of sampling error for most online surveys. The margin of error for a comparable probability-based random sample of the same size is +/- 2.6%, 19 times out of 20. The data were weighted according to census data to ensure that the sample matched Canada’s population according to age, gender, educational attainment, and region. Totals may not add up to 100 due to rounding.
Abacus Data Inc.
We offer global research capacity with a strong focus on customer service, attention to detail and value added insight. Our team combines the experience of our Chairman Bruce Anderson, one of Canada’s leading research executives for two decades, with the energy, creativity and research expertise of CEO David Coletto, PhD.