In our latest national survey completed on November 30th, we asked Canadians about their plans for holiday gatherings. Comparing our results to last year, Canadians are significantly more comfortable celebrating with family and friends this holiday season.
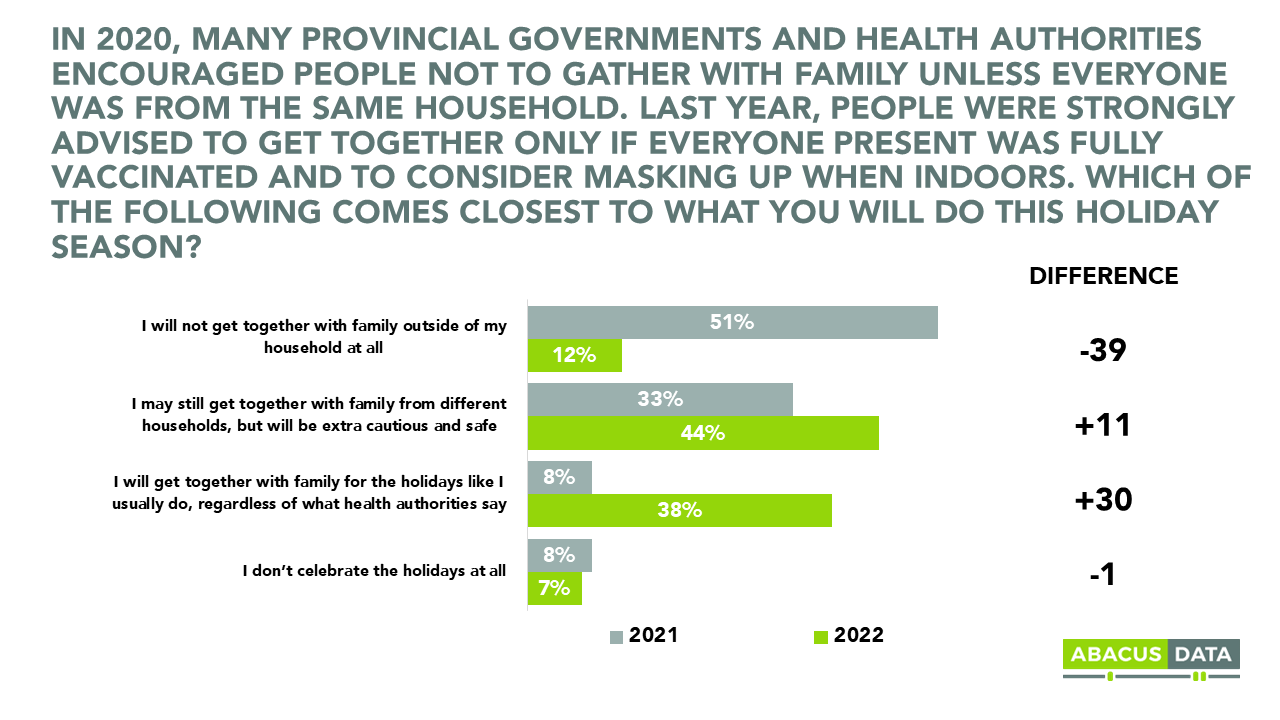
This year, only 12% intend to restrict their holiday plans to household members only. This is down from 51% who said the same last year.
As of right now 44% are taking a wait and see approach- saying they may still get together with family from different households, but will be extra cautious and safe (33% in 2021). 38% say they will get together with family for the holidays like they usually do, regardless of what health authorities say (8% in 2021).
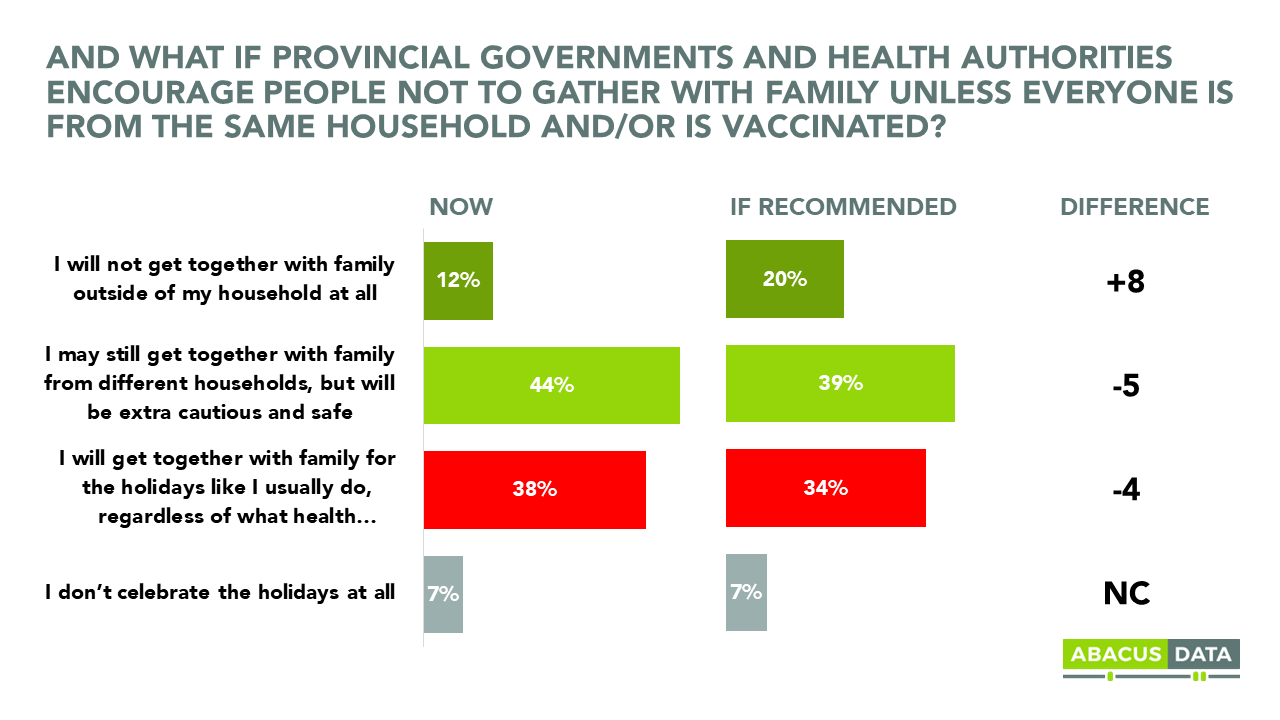
If health authorities were to discourage gatherings as they have done in the past, close to 1 in 5 say they would no longer gather, but overall, Canadians wouldn’t be halting their plans. In this situation only 20% indicated that they would follow these recommendations. 39% would still gather, but be extra cautious, and 34% would celebrate as usual, regardless of what health authorities say.
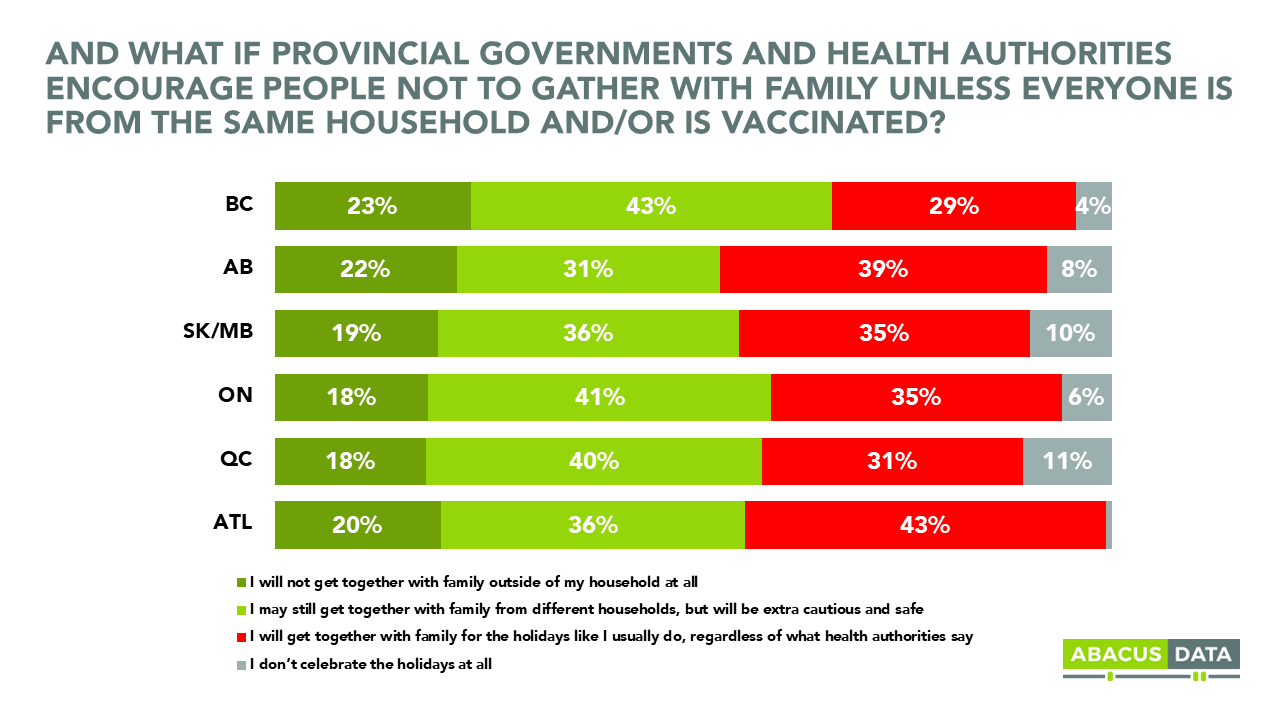
Results were fairly consistent across the country with BC residents being the most likely to follow recommendations and stay home, and Ontario and Quebec residents being the least likely.
UPSHOT
Although provincial governments and health authorities have not yet suggested any limitations to holiday gatherings this season, there is a sizeable minority concerned about the risks.
However, what’s most concerning is the number of individuals who would not follow the guidance of provincial governments and health authorities. Holiday celebrations have been reborn, and are back to pre-pandemic intentions, regardless of what public health and officials say.
METHODOLOGY
The survey was conducted with 1,500 Canadian adults from November 25 to 30, 2022. A random sample of panelists were invited to complete the survey from a set of partner panels based on the Lucid exchange platform. These partners are typically double opt-in survey panels, blended to manage out potential skews in the data from a single source.
The margin of error for a comparable probability-based random sample of the same size is +/- 2.1%, 19 times out of 20.
The data were weighted according to census data to ensure that the sample matched Canada’s population according to age, gender, educational attainment, and region. Totals may not add up to 100 due to rounding.
ABOUT ABACUS DATA
We are the only research and strategy firm that helps organizations respond to the disruptive risks and opportunities in a world where demographics and technology are changing more quickly than ever.
We are an innovative, fast-growing public opinion and marketing research consultancy. We use the latest technology, sound science, and deep experience to generate top-flight research-based advice to our clients. We offer global research capacity with a strong focus on customer service, attention to detail, and exceptional value.
We were one of the most accurate pollsters conducting research during the 2021 Canadian election following up on our outstanding record in 2019.
In December 2021, Abacus Data conducted a national public opinion survey commissioned by the Rideau Hall Foundation as part of a wider consultation related to strengthening the Forum for Young Canadians program. The survey was conducted with 1,750 young people in Canada, aged 16 to 24, and 700 children (through their parents) aged 12 to 15. The intentions of the survey were to understand civic engagement levels among children and youth in Canada, their perceptions of the space and intentions to engage.
Right now, most young people are interested in civic engagement and eager to know how to become involved.
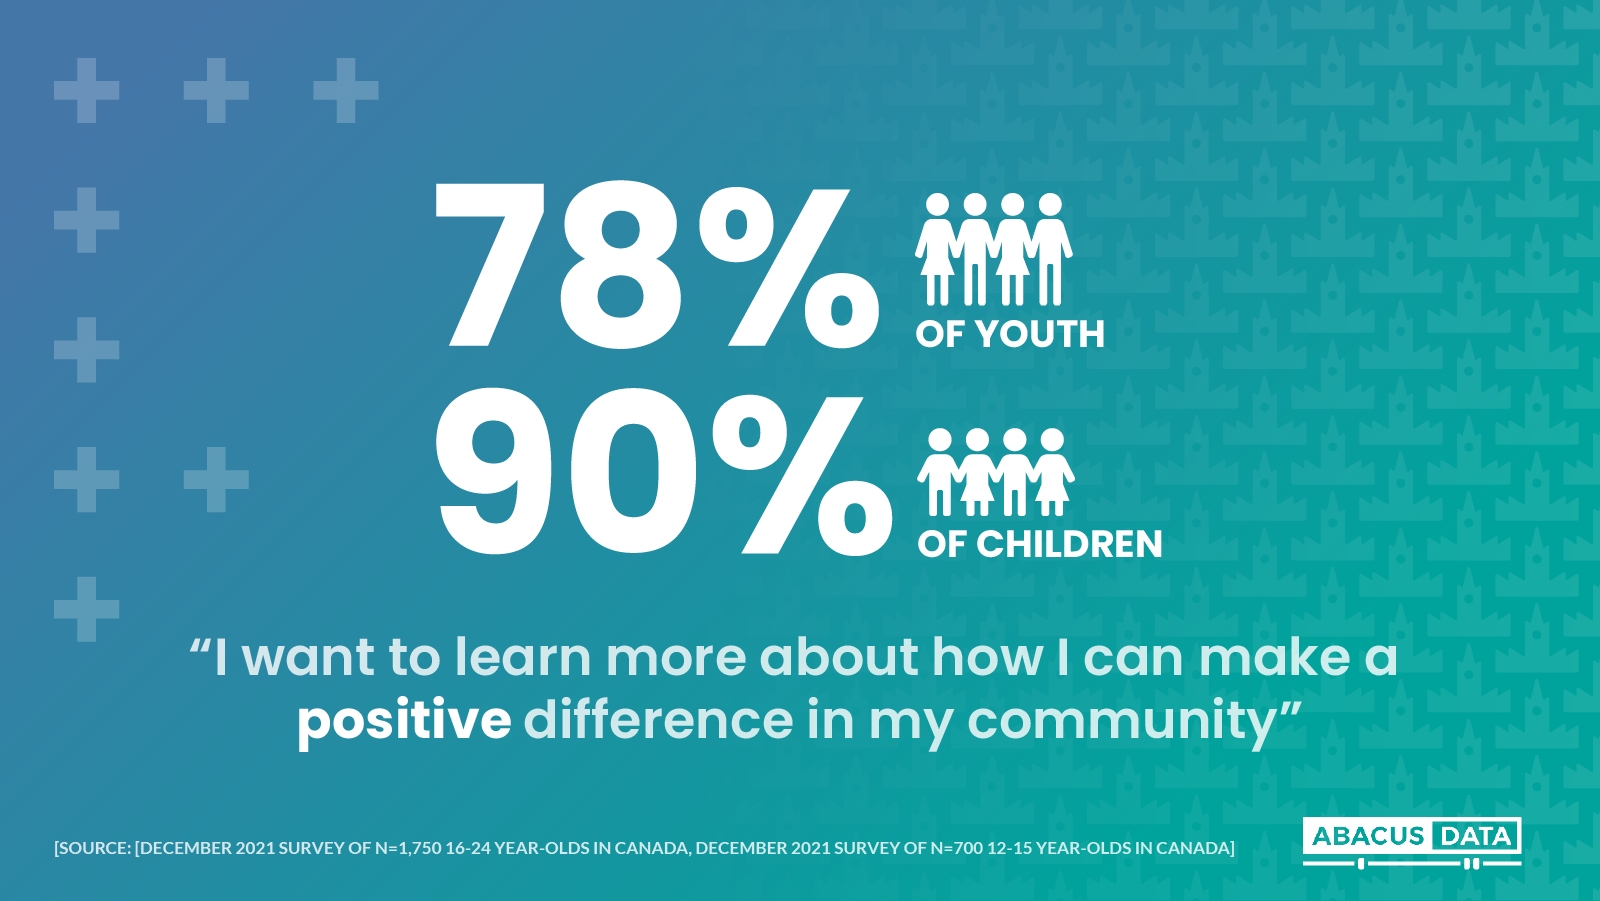
The majority of youth and children in Canada feel it is important to be active members of their community. 74% of youth and 87% of children feel it is important for them to be active in solving problems in their community.
Not only are young Canadians recognizing the importance of taking action, they are ready to put in the work themselves to become more involved. 78% of youth and 90% of children want to learn more about how they can make a positive difference in their community.
When converting their interest to engagement, language is key.
Despite most young people being interested in the ‘concept’ of civic engagement, framing the invitation to participate is critical. They do want to engage but if the invitation seems ingenuine, inaccessible, or unfamiliar they aren’t as interested in participating.
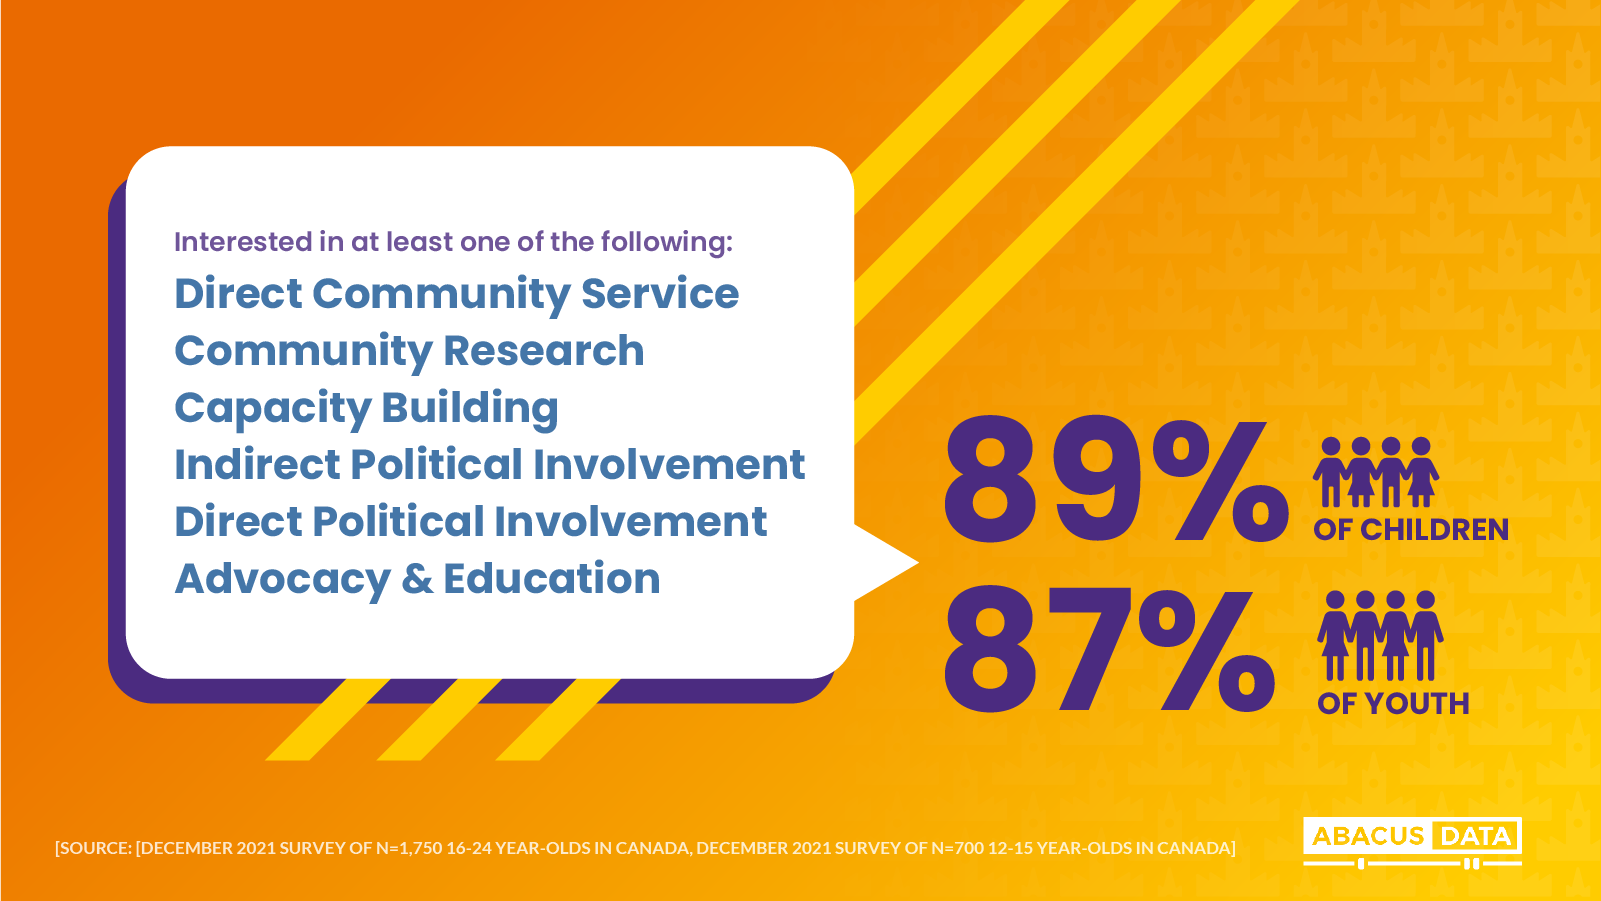
The phrase ‘civic engagement’ itself is a great example of just how much language matters. When given a list of 6 specific types of civic engagement options (community service, indirect and direct political involvement, etc.) 87% of youth and 89% of children are interested in at least one.
However, when we asked if they are interested in ‘civic engagement’ only 69% of youth say ‘yes’ and 42% of children (12- to 15-year-olds) say they do not know what the phrase ‘civic engagement’ means.
Whether the phrase ‘civic engagement’ has less positive connotations, or is just simply not part of their vocabulary, inviting young people to participate works best when they are provided with details about the specific kind of involvement, or the invitation is framed as a way that will lead to solving problems and making a difference in their communities.
Not all young people in Canada have an opportunity to participate in civic engagement, even at a local level and even if they feel it is important.
Interest in civic engagement opportunities is strong, but less than half of youth are currently involved (42%). Interestingly, involvement among children is higher, closer to two-thirds, suggesting that involvement wavers as youth pass through high school.
It’s likely that, as young people grow older, time and cost pressures (the two biggest barriers to involvement) become more of a factor, as youth may need to find a part time job to cover expenses at home, save for post-secondary education, or have other responsibilities that occupy their time.
Another barrier that seems to grow as young people get older is related to confidence. Three quarters of youth (and two thirds of children) say they don’t feel qualified for opportunities they’ve heard of or know about. 63% of youth (and 51% of children) don’t feel welcome to participate in civic engagement activities.
Combatting these perceptions (as well as cost and time barriers) will be important steps to increasing the number of youth who become civically engaged.
Given the gap between the number of young people who are interested vs. those who are currently involved, there is a clear opportunity for growth within the youth civic engagement programming space.
One area with growth potential is showcasing the connection between grassroots organizations and institutions.
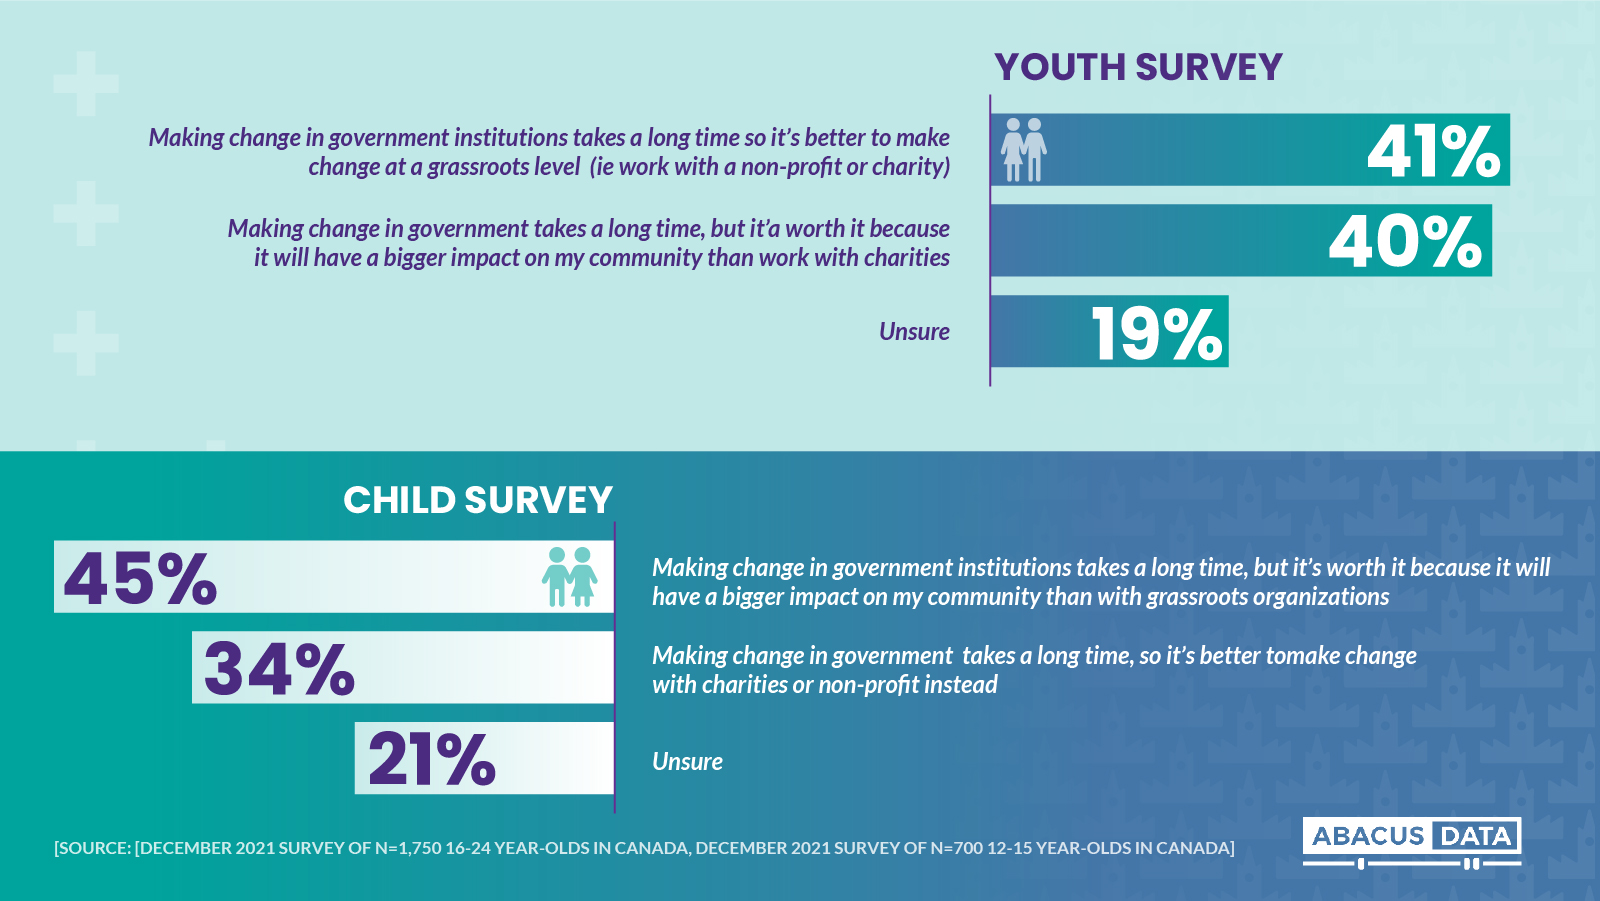
Young people tend to gravitate towards grassroots involvement, like volunteering in their community or getting involved with a non-profit, rather than other forms of civic involvement such as pushing for new legislation or changes in government policy. When youth are given the choice between these two types, grassroots involvement wins out two to one.
Young people perceive grassroots involvement as more “accessible”, “flexible” and “less encumbered by rules”, making it easier to see the impact of their service.
As one young person put it, “I think that a big motivating factor of wanting to change the world or impact the world is actually seeing that change or impact take place. Institutionally, even once a person can get to a point where they are able to make a difference or enact change, they may not be able to see the impact firsthand.”
But ask a young person which option is more effective at making change and the options are tied.
In the words of young people themselves, “both categories are important and are co-dependent. Without the grassroots, the institution does not have the advocacy and without the institution, the grassroots does not have the scale or reach”.
Young Canadians are intrigued by making change within institutions and see the value in this participation but are not yet gravitating towards it. Opportunities and programs that increase the accessibility of this type of engagement and expose young people to these avenues for change will be met with a welcome interest. This is a great path to explore when looking for ways to engage more young people in civic engagement.
Finally, to gain experience on the path to becoming civically engaged, young people are seeking an in-person, hands-on experience where they can begin to see the positive consequences of their actions.
68% of youth (55% of children) are interested in a project or initiative that would make a difference in their community. 61% of youth (44% of children) are interested in a multi-day conference or workshop offered once per year56% of youth (48% of children) are interested in a national peer-to-peer network.
Within any of these programs, youth are looking for in-person opportunities that allow them to engage in hands-on and up close and personal opportunities that bring young people together.
As said by a young person with civic engagement experience, “In-person allows for a more immersive and hands-on learning experience. In general, community building is better facilitated when participants are able to meet face-to-face.”
The opportunity to practice skills in a supportive setting and learn from mentors and peers is the most effective approach to drawing young people in and allowing them to see their continued civic engagement impact post-program.
THE UPSHOT
The area of youth and child civic engagement is an ever-growing space, and one with lots of future potential. While youth of today have experienced a number of events in the last few years that have increased the need to experience this potential, also it has also exposed them to the limitations of engagement that exist. And it has changed how one can become involved in their community with the rise of new opportunities and the wind down of others.
Through all of this, young people show great promise for the future. This newer generation’s desire to help their community is clear, and they are ready to do the work to learn and get involved.
We need to take advantage of this motivation by working to eliminate barriers, create a welcoming invitation, facilitate learning in a way that supports young people where they are at, and empower them to make a difference long after the experience is over.
Click here to learn more about this work, and other Forum for Young Canadians research.
METHODOLOGY
The Youth Survey was conducted online, from November 26 to December 21, 2021, fielded to n=1,750 Canadian residents aged 16-24. The margin of error for a comparable probability-based random sample of the same size is +/- 2.34%, 19 times out of 20.
The Child Survey was conducted online, from November 26 to December 3, 2021, fielded to n=700 Canadian residents aged 12-15 (through their parents). The margin of error for a comparable probability-based random sample of the same size is +/- 3.7%, 19 times out of 20.
The data were weighted according to census data to ensure that the sample matched Canada’s population according to age, gender, educational attainment, and region. Totals may not add up to 100 due to rounding.
This survey was commissioned by the Rideau Hall Foundation.
ABOUT ABACUS DATA
We are the only research and strategy firm that helps organizations respond to the disruptive risks and opportunities in a world where demographics and technology are changing more quickly than ever.
We are an innovative, fast-growing public opinion and marketing research consultancy. We use the latest technology, sound science, and deep experience to generate top-flight research-based advice to our clients. We offer global research capacity with a strong focus on customer service, attention to detail, and exceptional value.
We were one of the most accurate pollsters conducting research during the 2021 Canadian election following up on our outstanding record in 2019.
On behalf of the Canadian Life and Health Insurance Association, Abacus Data conducted research among a national sample of adult Canadians, including 709 people who had experience with segregated funds and 782 who had experience with mutual funds. This research was conducted between September 4th and October 3, 2022. Here are the key findings.
• 22% of Canadians have used segregated funds, and 52% have used mutual funds.
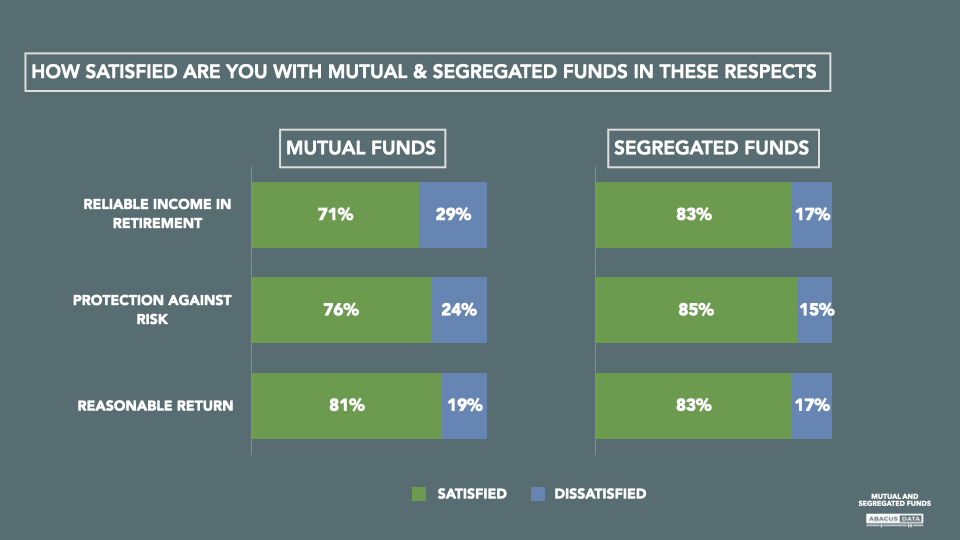
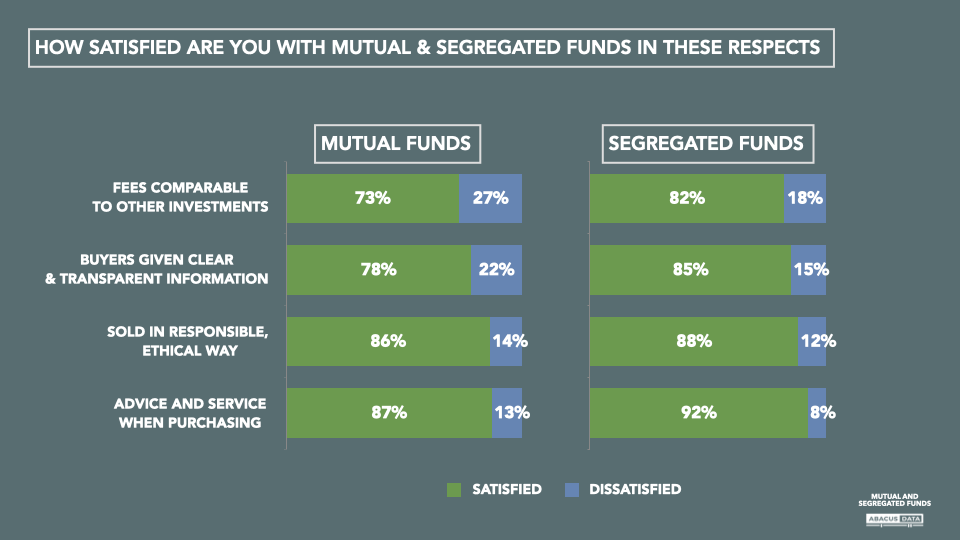
• Satisfaction levels with both investment product is high. Segregated funds enjoy stronger satisfaction levels compared to mutual funds especially when it comes to “protection against risk” and “reliable income in retirement”.
• In terms of the fees charged for the two products satisfaction levels are high, and somewhat higher for segregated funds. For segregated funds, 82% are satisfied that the “fees are comparable to other investments”, 9 points higher than for mutual funds.
• 85% are satisfied buyers are “given clear and transparent information” when they are sold segregated funds, compared to 78% for mutual funds.
• 88% of those with experience with segregated funds are satisfied they are “sold in an ethical and responsible way”.
We examined for regional, generational, or affluence-based differences of opinion. These differences were marginal: opinions were largely consistent across the country and different walks of life.
UPSHOT
The large majority of consumers who have invested in segregated funds feel they have been dealt with fairly, with transparency, and were charged fees that were comparable to other investment choices. When compared to results among those who have used mutual funds, satisfaction levels with segregated funds are higher across several criteria.
METHODOLOGY
Abacus Data conducted research among a national sample of adult Canadians, including 709 people who had experience with segregated funds and 782 who had experience with mutual funds. This research was conducted between September 4th and October 3, 2022. The survey was conducted online.
The survey was weighted to match the Canadian adult population by age, gender, region, education, and official language.
The research was paid for by the Canadian Life and Health Insurance Association.
ABOUT ABACUS DATA
We are the only research and strategy firm that helps organizations respond to the disruptive risks and opportunities in a world where demographics and technology are changing more quickly than ever.
We are an innovative, fast-growing public opinion and marketing research consultancy. We use the latest technology, sound science, and deep experience to generate top-flight research-based advice to our clients. We offer global research capacity with a strong focus on customer service, attention to detail, and exceptional value.
We were one of the most accurate pollsters conducting research during the 2021 Canadian election following up on our outstanding record in 2019.
On November 4th and 5th, we conducted a province-wide survey of 1,000 adults to explore initial public reaction to the labour dispute between the Ontario government and the province’s education workers who were set to strike on Friday.
The survey finds:
1. There is widespread awareness and significant attention being paid to the issue by the public.
2. More Ontarians blame the provincial government for school closures than education workers.
3. Half would support more unions walking off the job to protest with education workers.
4. 71% want the provincial government to negotiate a fair deal with education workers rather than continue with its current approach.
5. The political impact on the PCs has been limited thus far. They would win easily again if an election was held today.
Here are the detailed results:
ATTENTION AND AWARENESS OF THE LABOUR DISPUTE
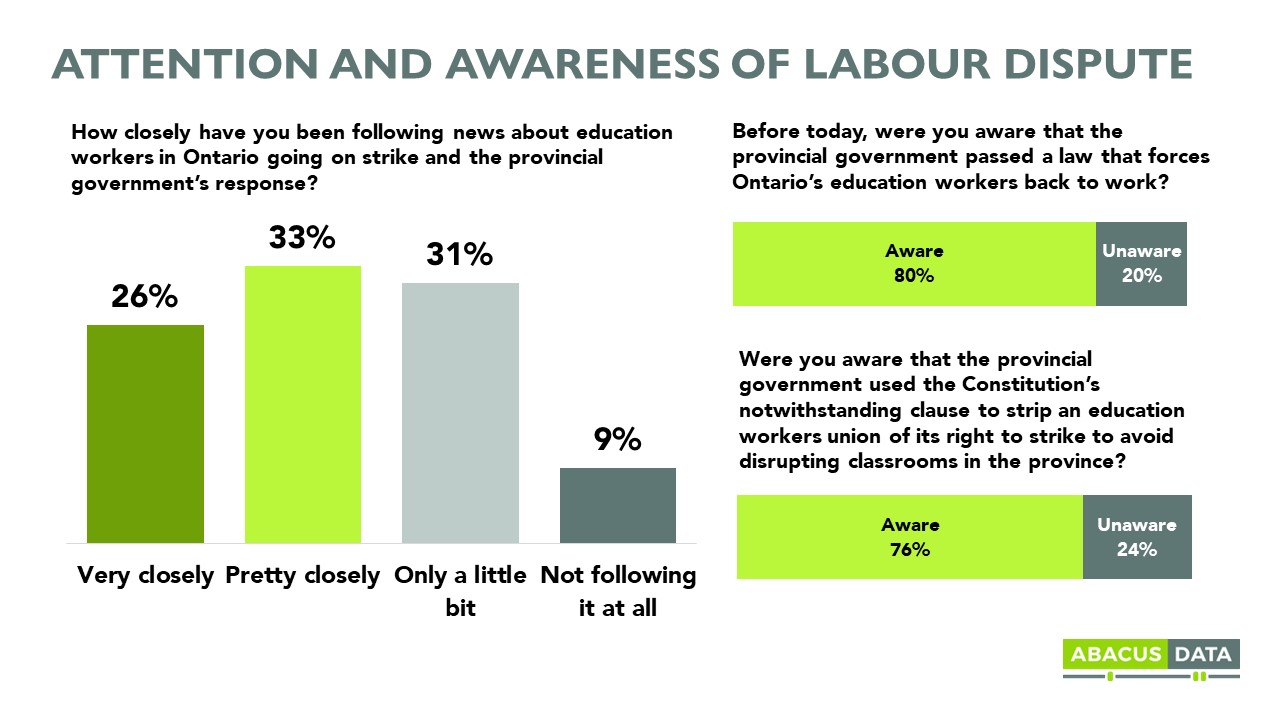
Millions of Ontarians are paying attention and following news about education workers in Ontario going into a strike position and the provincial government’s response. 59% are following it very or pretty closely and over 80% are aware that the provincial government passed a law that forces workers back to work. 76% are aware that the provincial government invoked the notwithstanding clause.
Not surprisingly, parents of school-aged children are following the issue more closely. 36% are following very closely while 32% are following it pretty closely.
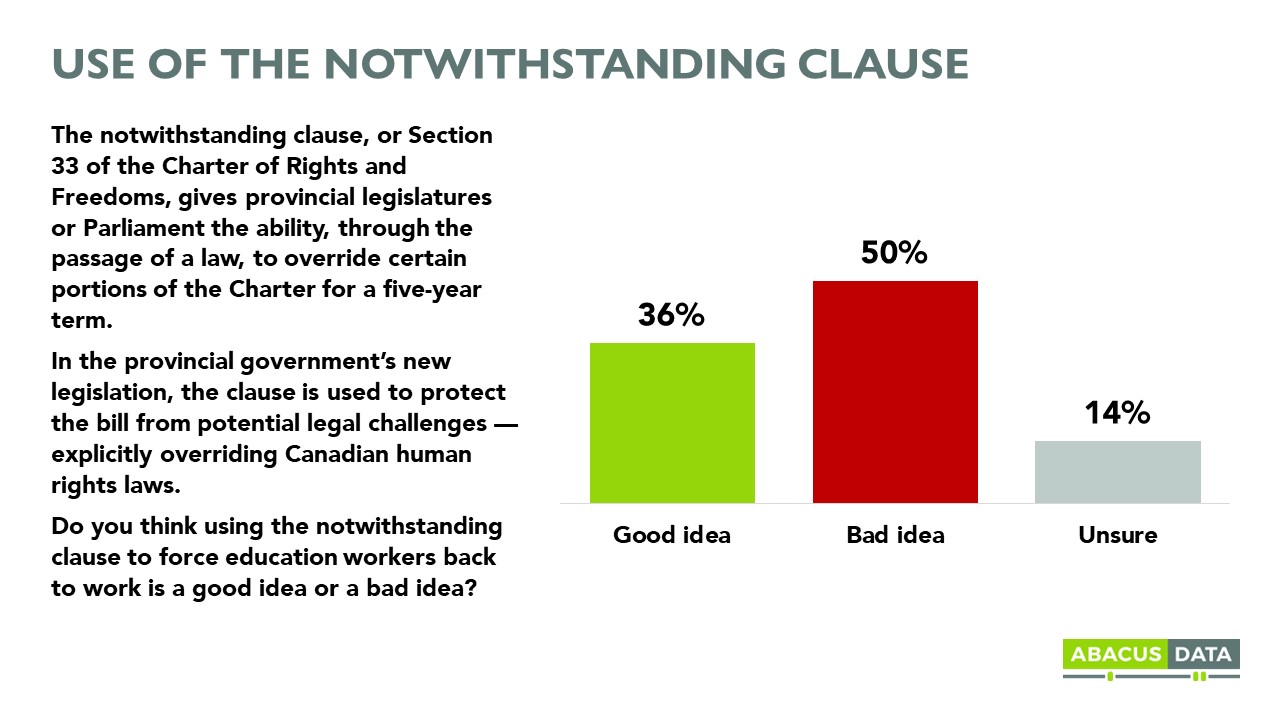
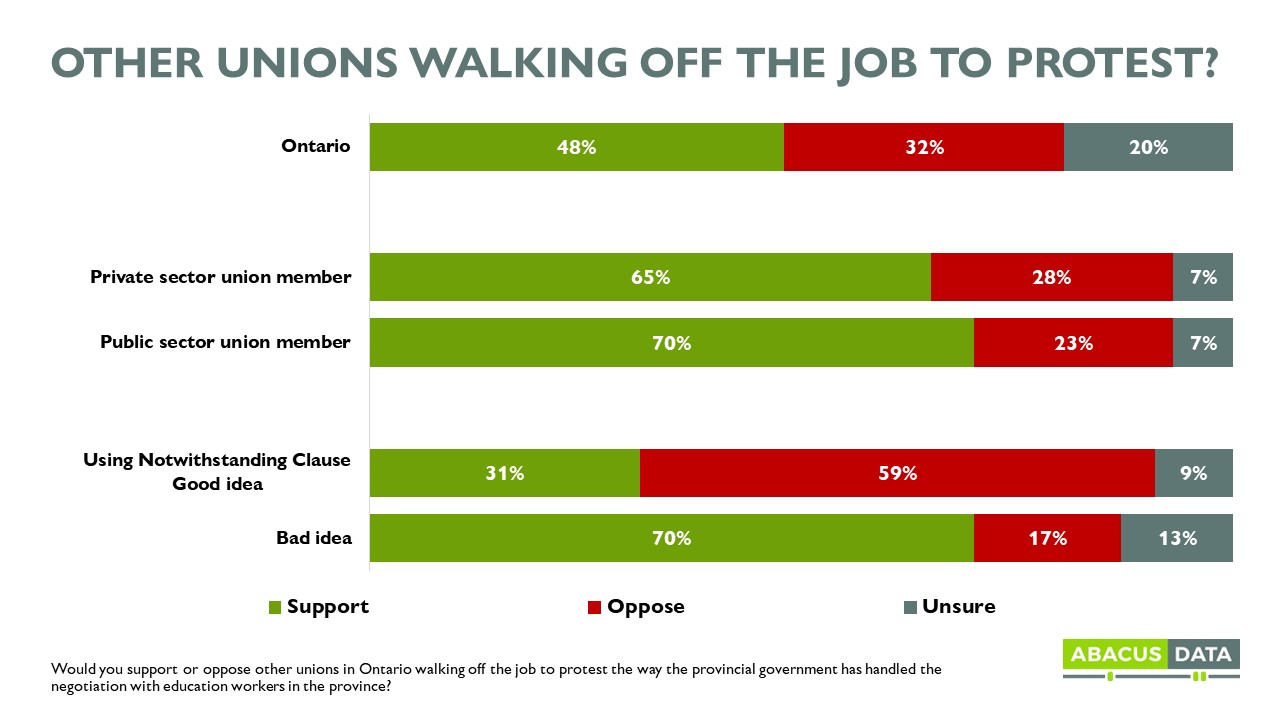
USE OF THE NOTWITHSTANDING CLAUSE
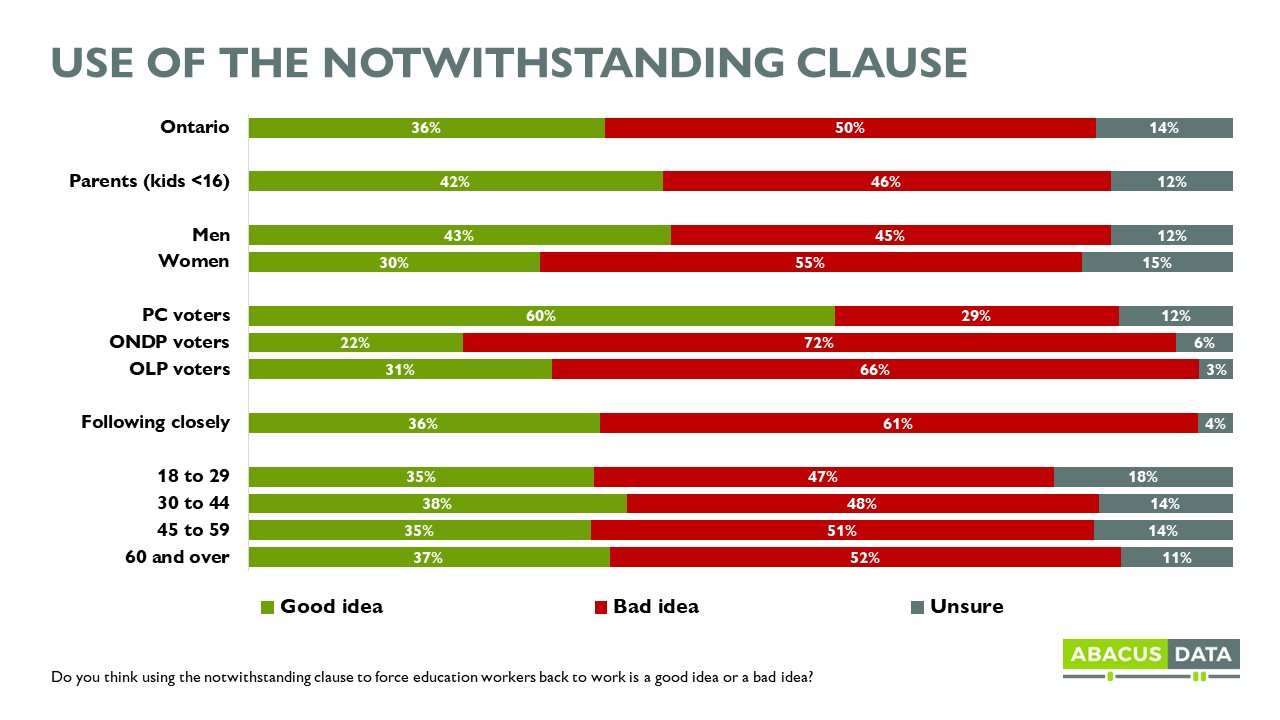
Half of Ontarians think it is a bad idea to use the notwithstanding clause to force education workers back to work while about 1 in 3 think it is a good idea.
Parents are more divided than Ontarians generally. 42% think it’s a good idea while 46% think it’s a bad idea. Among PC voters, 60% approve while about 3 in 10 disapprove of using the notwithstanding clause. Men are also 13-points more likely to think it’s a good idea to invoke the clause than women.
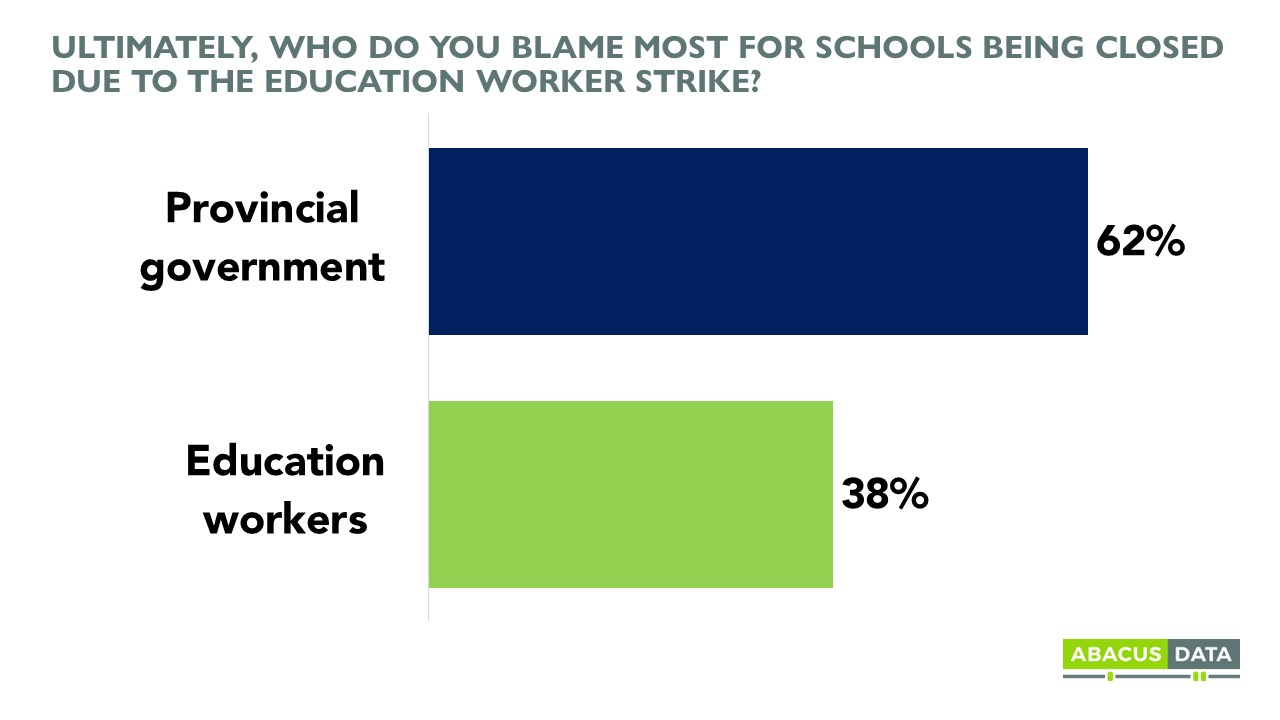
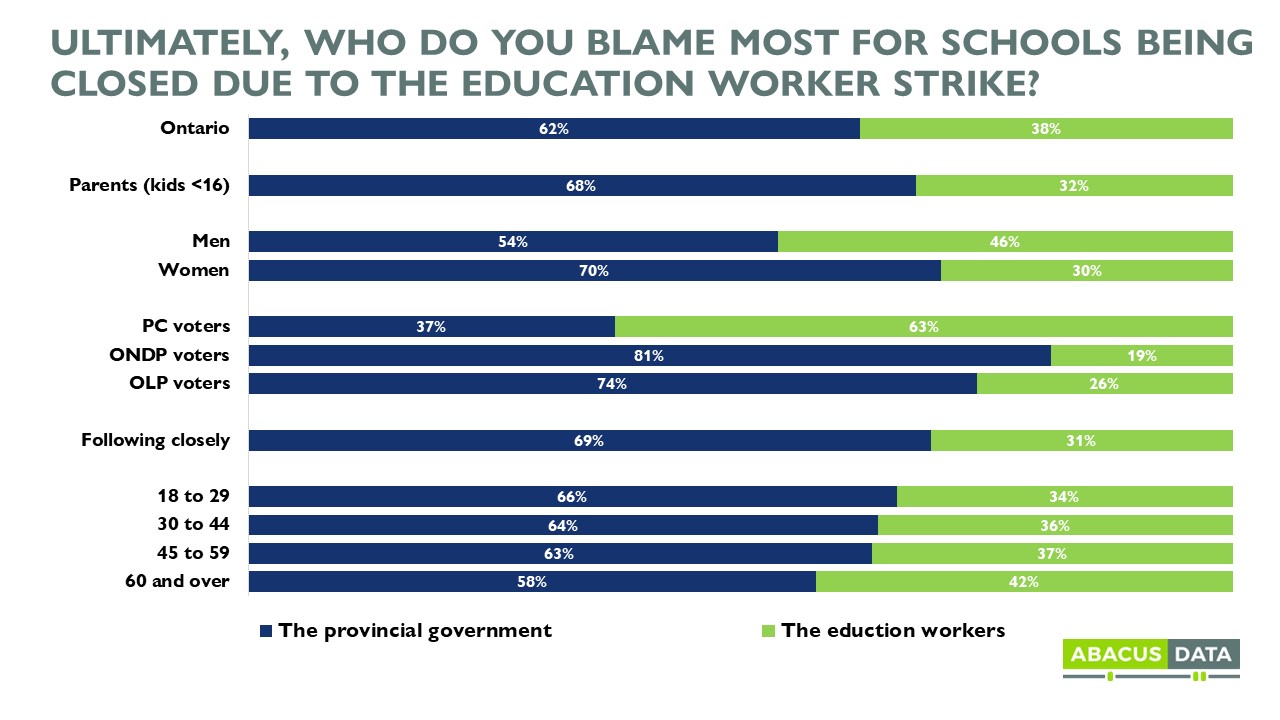
WHO IS TO BLAME FOR SCHOOLS BEING CLOSED?
More than 6 in 10 Ontarians blame the provincial government most for schools being closed while 4 in 10 blame education workers the most.
68% of parents of school-aged children blame the provincial government most, as do 70% of women, 69% of those following the issue closely, and 37% of 2022 PC voters.
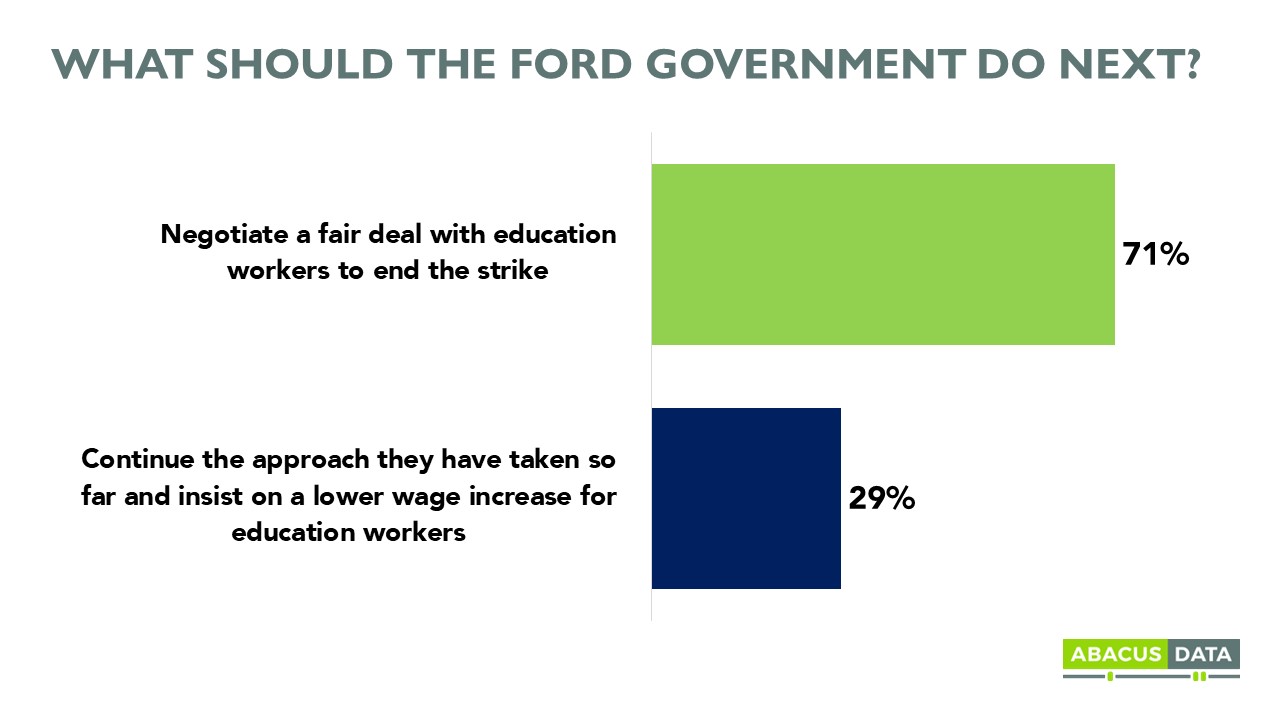
WHAT SHOULD THE FORD GOVERNMENT DO NEXT?
More than 7 in 10 Ontarians want the Ford government to negotiate a fair deal with education workers to end the strike rather than continue the approach they have taken so far and insist on a lower wage increase for education workers. 29% prefer if the government continues its approach.
69% of parents and 56% of PC voters want the government to negotiate a fair deal.
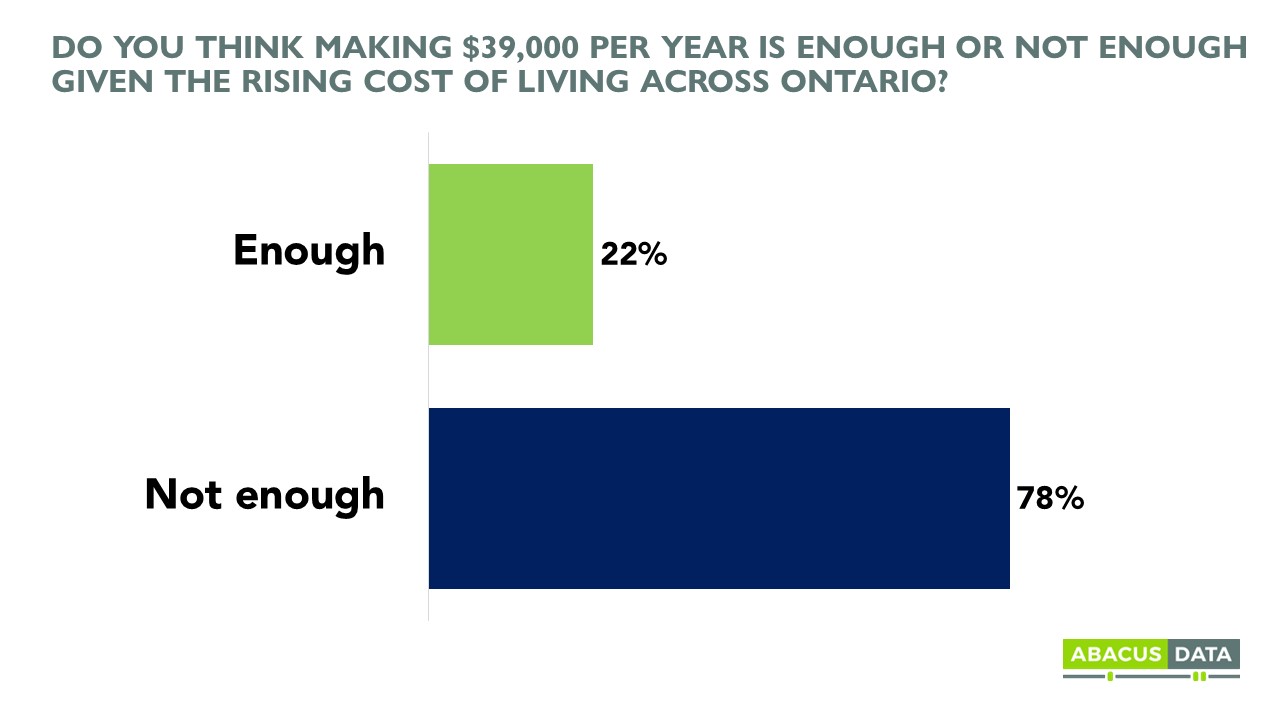
One reason why Ontarians want the provincial government to negotiate a fair deal with education workers is because about half think they don’t make enough money. When asked whether non-teaching staff in schools make too much, not enough, or about the right amount, 50% say don’t make enough, 28% feel they make the right amount, while 7% say they make too much.
In fact, when we ask – “Do you think making $39,000 per year is enough or not enough given the rising cost of living across Ontario?”- 78% of Ontarians say that salary is not enough given the rising cost of living.
SHOULD OTHER UNIONS PROTEST WITH CUPE?
Almost half of Ontarians (48%) support other unions in Ontario walking off the job to protest the way the provincial government has handled the negotiation with education workers in the province. 33% are opposed while 20% are unsure.
51% of parents, 29% of PC voters, and 65% of those following the issue closely support other unions protesting with education workers.
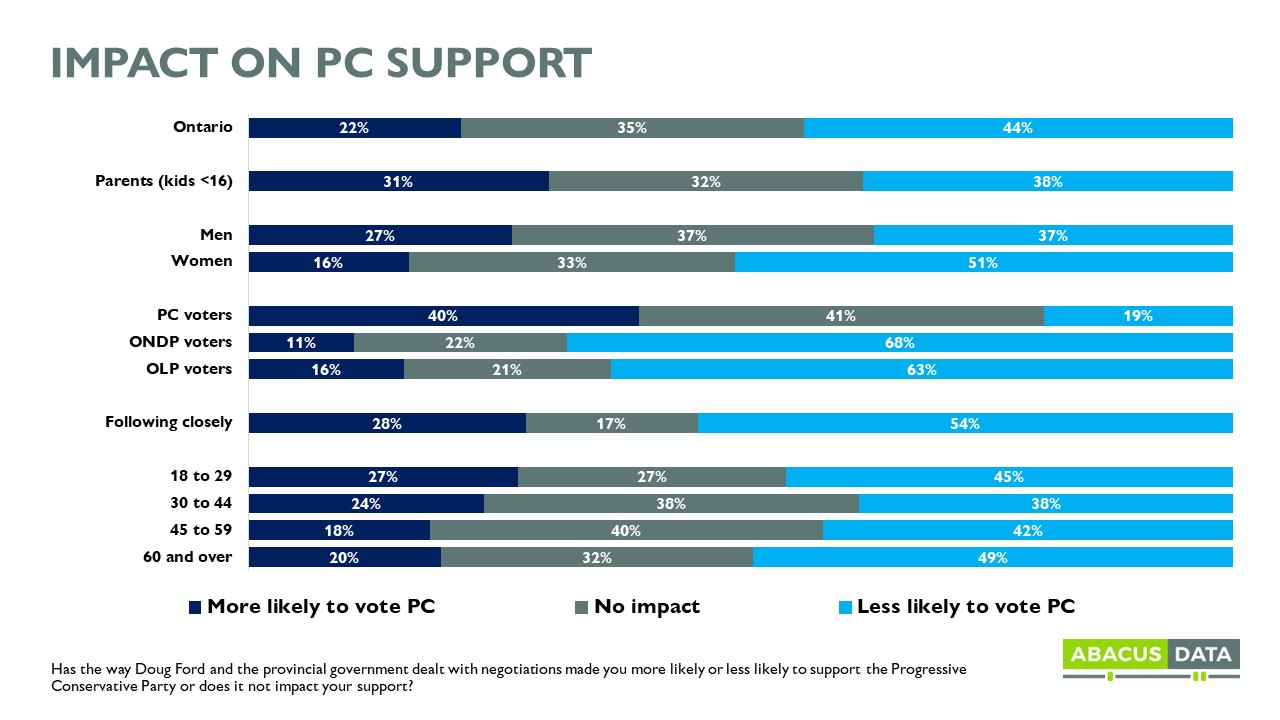
THE POTENTIAL POLITICAL CONSEQUENCES
By a 2 to 1 margin, Ontarians say the way Doug Ford and the provincial government has dealt with negotiations makes them less likely to vote PC than more likely to vote PC. But, at this point, it doesn’t look like the issue is hurting the Ford government.
For example, while 1 in 5 past PC voters say they are less likely to vote PC, about 1 in 10 NDP and Liberal voters say they are more likely to vote PC because of it.
Parents of school-aged children are split at this point. 31% say they are more likely to vote PC while 38% say they are less likely to.
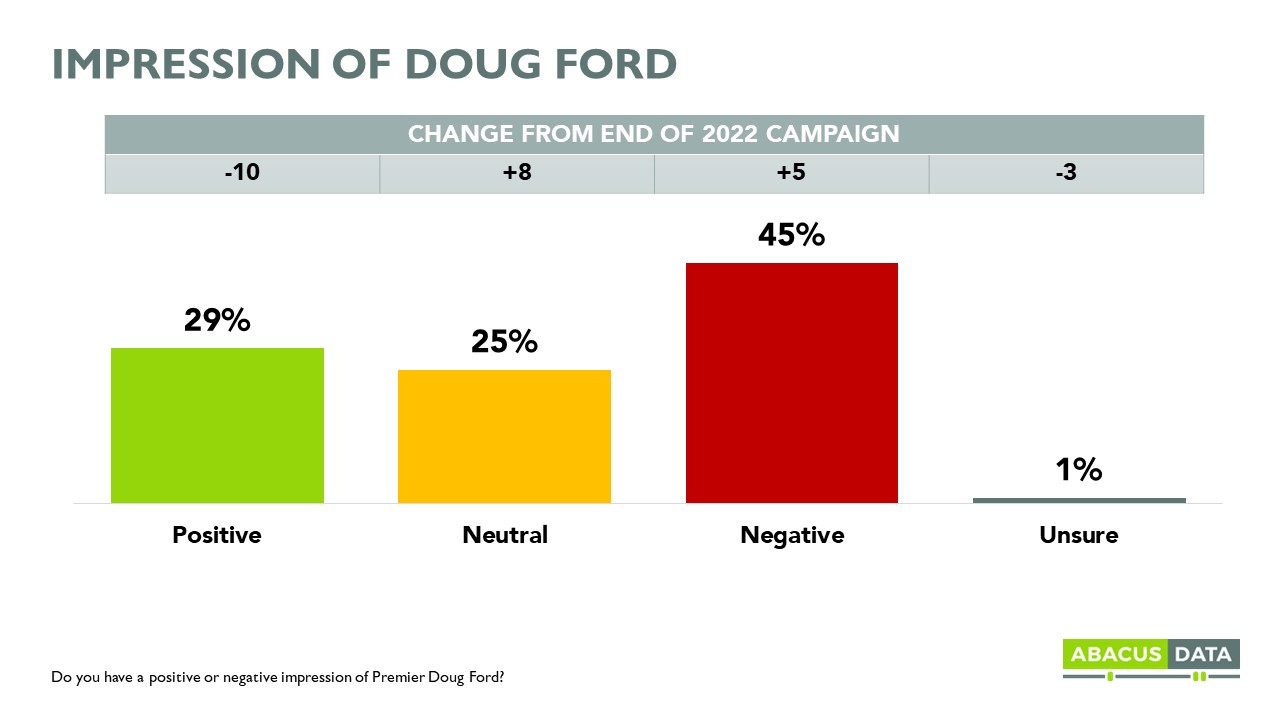
IMPRESSIONS OF PREMIER FORD & MINISTER LECCE
Since the June provincial election, Premier Ford’s personal image has become less positive and more negative. Today, 29% have a positive impression of the Premier (down 10 points) while 45% have a negative view (up 5 points).
When we asked about Education Minister Stephen Lecce, 15% have a positive view of him compared with 42% who have a negative view.
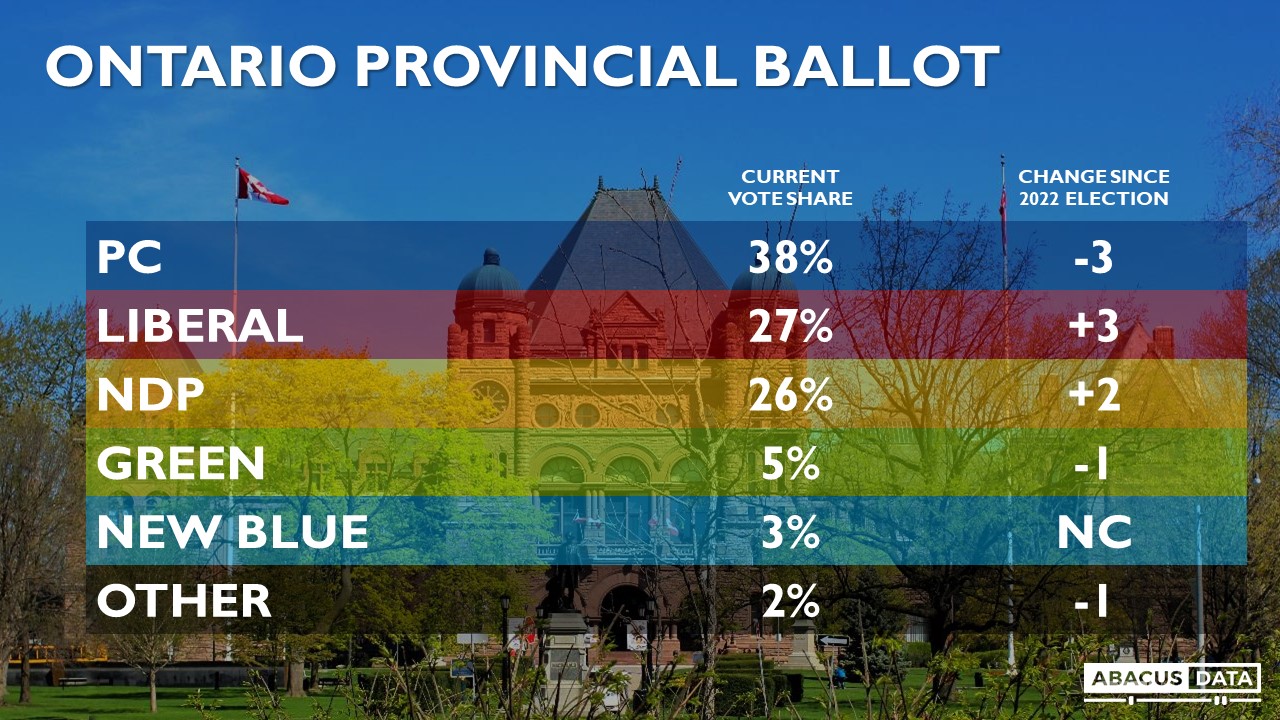
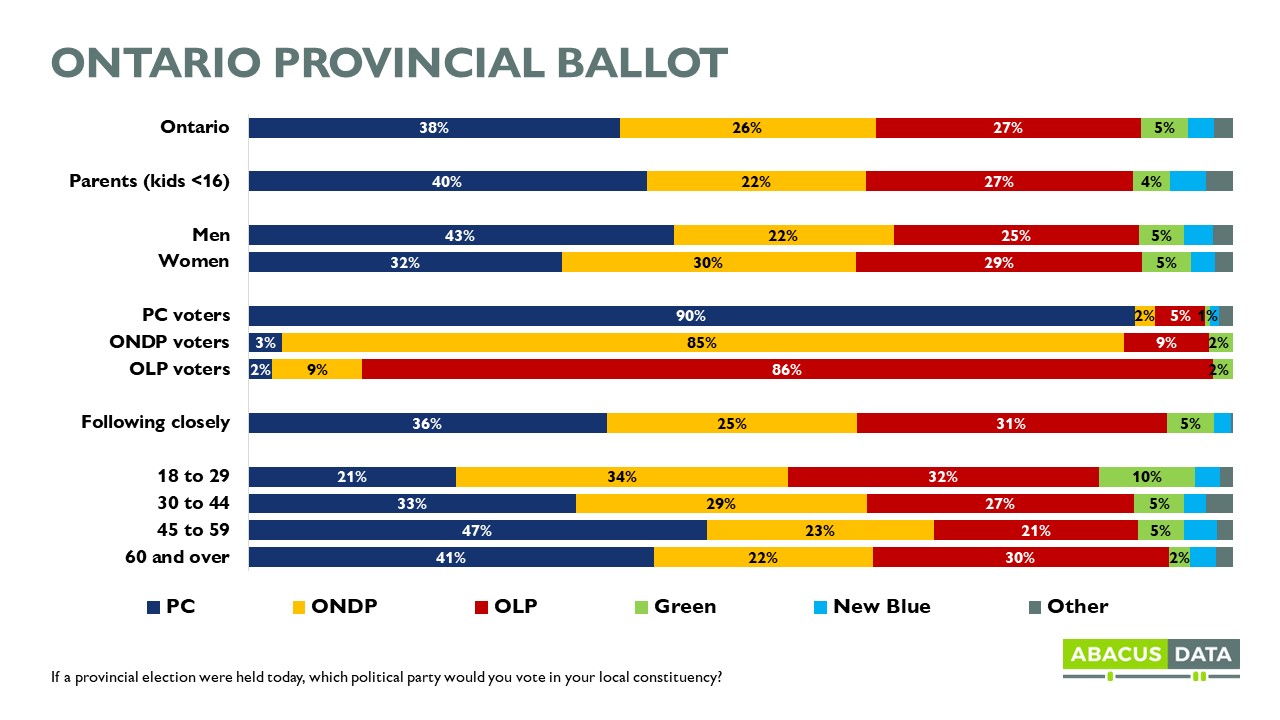
PROVINCIAL VOTE INTENTION
If an election was held at the time of the survey, the PCs would easily win another majority. 38% would vote PC, down 3 from the June election results. The Ontario Liberals and NDP are basically tied for second at 27% and 26% respectively. Both are up slightly from the results of the spring election.
The PCs have a wide lead among men, and among those over the age of 45 while being competitive among women and those aged 30 to 44. Of note, parents with children aged 15 or younger are slightly more likely to say they would vote PC than the province as a whole (40% vs. 38%). Among those parents, the PCs lead the Liberals by 13-points.
UPSHOT
This initial survey of public opinion in Ontario finds that many people are following this issue closely and are aware of the provincial government’s actions thus far. By a 2 to 1 margin, Ontarians blame the provincial government for schools being closed rather than education workers and about 7 in 10 want the provincial government to negotiate a fair deal with workers rather than continue with its current approach. We also find fairly wide support for other unions joining education workers in protesting the government’s approach to dealing with the labour dispute – especially among other unionized workers in both the private and public sectors.
Despite all of this, the Ford government hasn’t been hurt politically. While Doug Ford’s personal numbers are more negative than when the election campaign ended in June, the PCs would easily be re-elected today if an election was held at the time of the survey. Furthermore, while more say they would be less likely to vote PC than more likely to vote PC because of how the government has handled this issue, the proportion of those moving away from the PCs isn’t large enough to worry the Tories and the next election isn’t for more than 3 years from now.
But this is the starting point and views can shift over time depending on what happens next. We’ll continue to monitor public opinion and reactions.
METHODOLOGY
The survey was conducted with 1,000 Ontario residents aged 18 and over on November 4 to 5, 2022.
A random sample of panelists were invited to complete the survey from a set of partner panels based on the Lucid exchange platform. These partners are typically double opt-in survey panels, blended to manage out potential skews in the data from a single source.
The margin of error for a comparable probability-based random sample of the same size is +/- 3.1%, 19 times out of 20.
The data were weighted according to census data to ensure that the sample matched Ontario’s population according to age, gender, education, and region. Totals may not add up to 100 due to rounding.
This study was paid for by Abacus Data Inc.
ABOUT ABACUS DATA
We are the only research and strategy firm that helps organizations respond to the disruptive risks and opportunities in a world where demographics and technology are changing more quickly than ever.
We are an innovative, fast-growing public opinion and marketing research consultancy. We use the latest technology, sound science, and deep experience to generate top-flight research-based advice to our clients. We offer global research capacity with a strong focus on customer service, attention to detail, and exceptional value.
We were one of the most accurate pollsters conducting research during the 2021 Canadian election following up on our outstanding record in 2019.
About 1 in 5 people (16%) say they have been following the commission hearings closely, and another 50% “a little” while 34% are not following it at all.
Conservative (21%), Liberal (20%), and NDP (16%) voters are about as likely to be following the Commission closely.
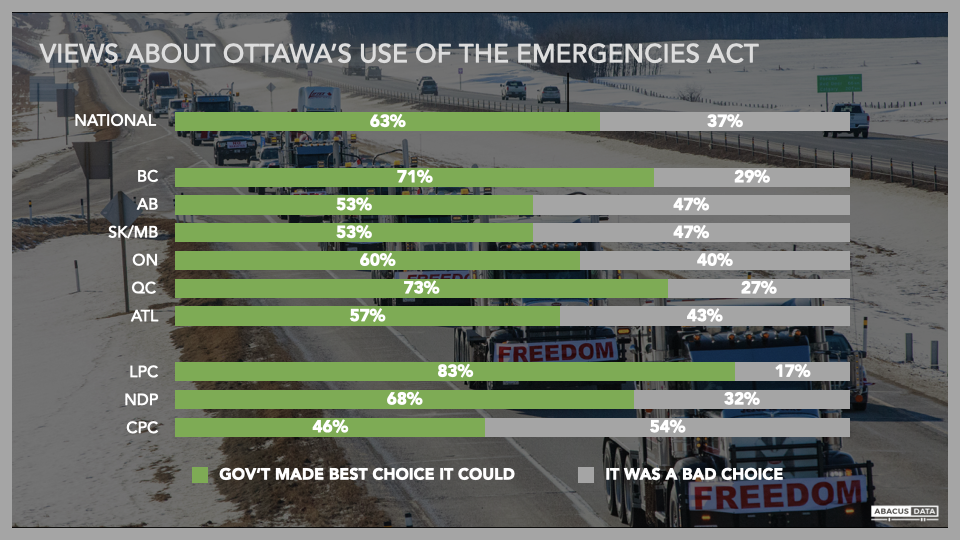
DID OTTAWA MAKE THE RIGHT DECISION IN USING THE EMERGENCIES ACT
The majority (63%) believe the federal government “made the best choice it could in the circumstances, to use that law to deal with the situation” with the Ottawa convoy occupation.
A majority in every province think it was the best choice possible, although the majority was slim at 53%-47% in the three prairie provinces. Large majorities of NDP (68%) and Liberal voters (83%) feel it was the best available choice while Conservative Party voters are split (46% best choice -54% bad choice).
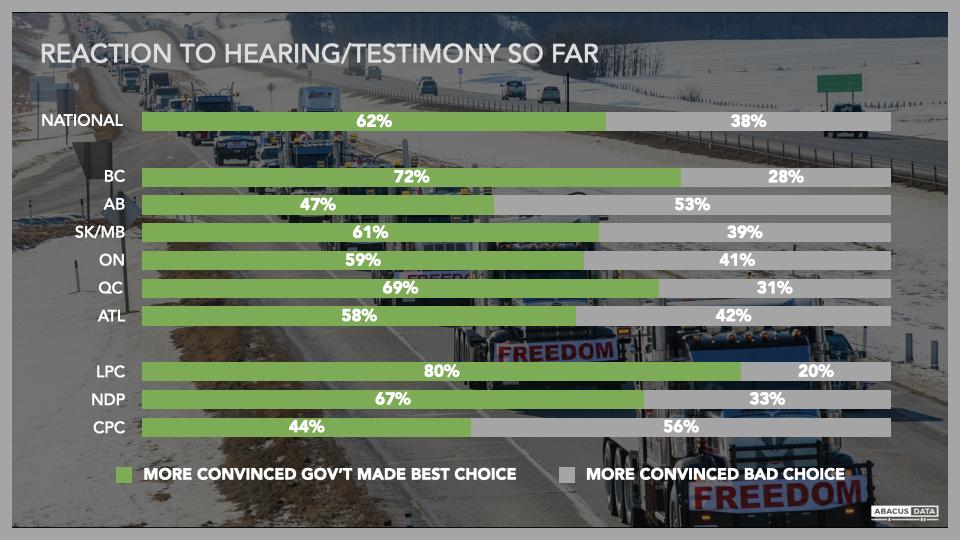
REACTION TO EMERGENCIES ACT HEARINGS
Based on what they are seeing or hearing from the hearings and the testimony, 62% say they are becoming more inclined to think the government had no better choice, while 38% say they are becoming more inclined to think the government made the wrong choice. The patterns suggest that few minds are being changed – original views are being reinforced.
The testimony heard at the committee thus far doesn’t seem to be moving many people from their original perspective on the use of the Emergencies Act although it may be moving more people toward accepting the use of the Act than rejecting its use.
Of those who think the federal government made the best choice it could in the circumstances, 88% said the inquiry has made them more inclined to think the government had no better choice but to use the law while 12% are more inclined to think the government made the wrong choice.
In contrast, among those who felt the government made a bad choice to use the Emergencies Act, 18% say they are now more inclined to think the government had no better choice but to use that law while 82% are more inclined to think the government made the wrong choice.
UPSHOT
Just as the Convoy generated a lot of attention last February, so too are the hearings about the use of the Emergencies Act that have attracted a lot of attention. So far, to this point in the proceedings (October 26th), the public assessment is not changing – most people supported the use of the Emergencies Act last winter and continue to think it was the best choice available.
METHODOLOGY
The survey was conducted with 1,500 Canadian adults from October 22 to 26, 2022. A random sample of panelists were invited to complete the survey from a set of partner panels based on the Lucid exchange platform. These partners are typically double opt-in survey panels, blended to manage out potential skews in the data from a single source.
The margin of error for a comparable probability-based random sample of the same size is +/- 2.1%, 19 times out of 20.
The data were weighted according to census data to ensure that the sample matched Canada’s population according to age, gender, educational attainment, and region. Totals may not add up to 100 due to rounding.
We are the only research and strategy firm that helps organizations respond to the disruptive risks and opportunities in a world where demographics and technology are changing more quickly than ever.
We are an innovative, fast-growing public opinion and marketing research consultancy. We use the latest technology, sound science, and deep experience to generate top-flight research-based advice to our clients. We offer global research capacity with a strong focus on customer service, attention to detail, and exceptional value.
We were one of the most accurate pollsters conducting research during the 2021 Canadian election following up on our outstanding record in 2019.
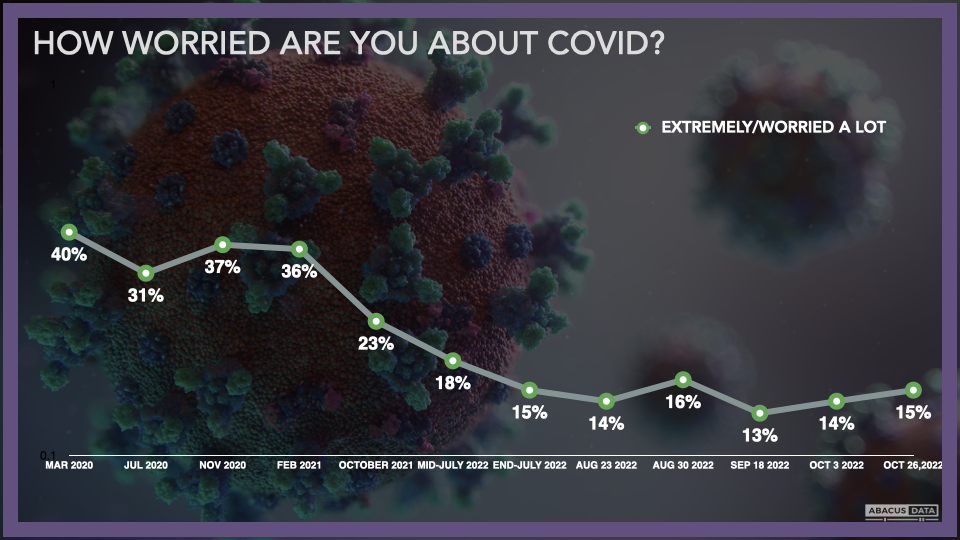
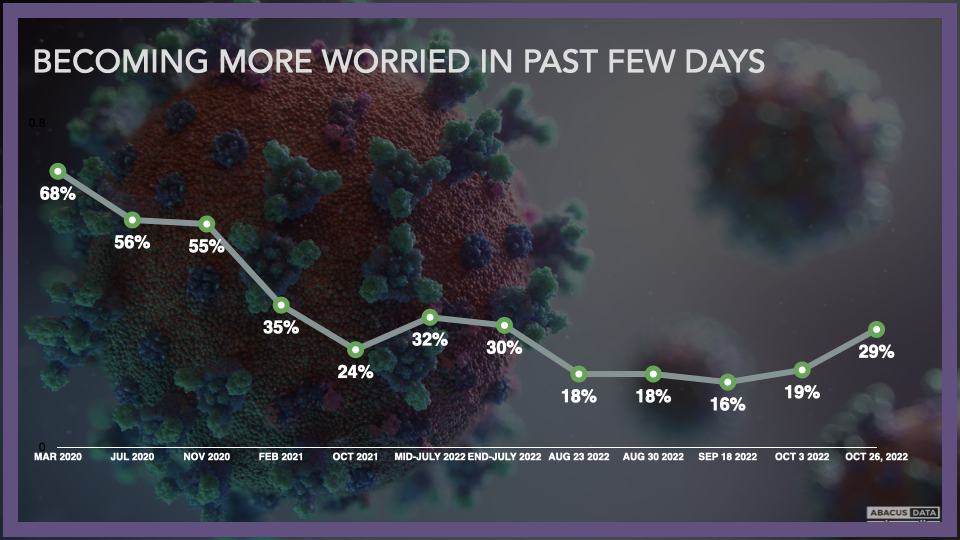
5% are “extremely worried” or “worried a lot” about Covid19, which is only a marginal change from our last wave, but 29% say their level of concern has increased recently, which is up 10 points. The degree of worry hasn’t intensified, but awareness of growing risk is up.
INFECTION RATES, AND SYMPTOM REPORTS UNCHANGED
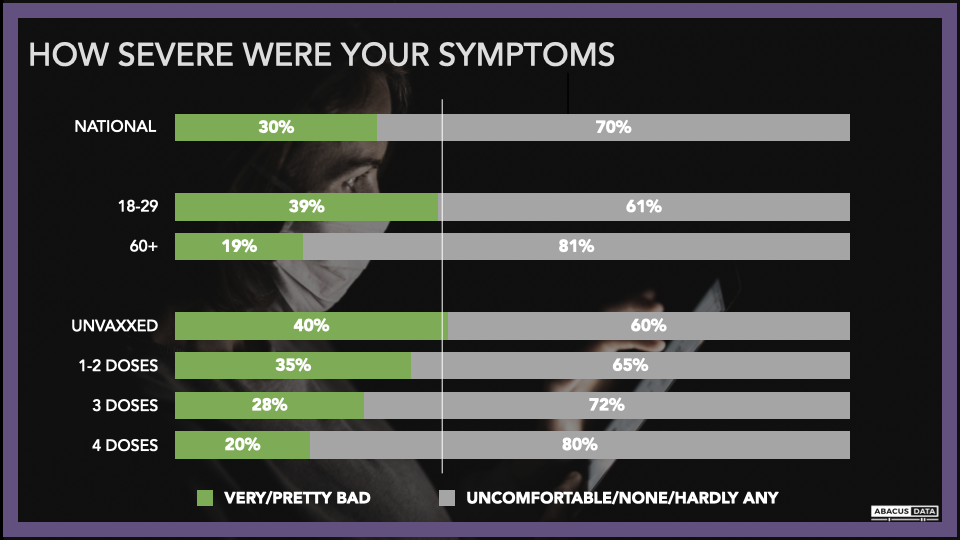
A total of 44% say they are sure they had or probably had Covid, up 4 points. 70% of those who believe they were infected say that their symptoms were “uncomfortable but not bad” or had hardly any symptoms. Older people and those with more doses of vaccine reported less severe symptoms.
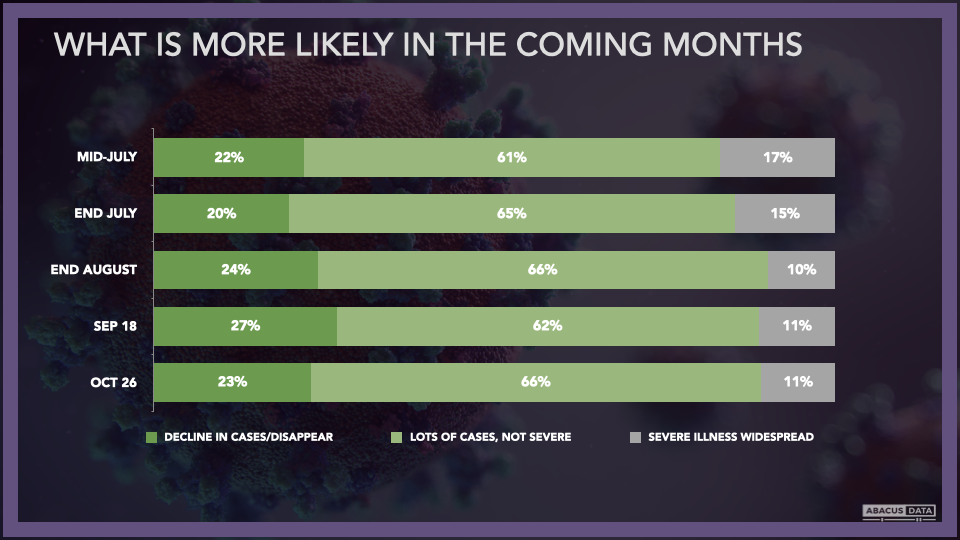
LARGE MAJORITY EXPECT MILD OR DISAPPEARING COVID THIS FALL
Just 11% anticipate that there will be a lot of severe illness and hospitalizations from Covid this fall, unchanged over the month. The majority expects a lot of cases, but mild symptoms (66%) or that “fewer and fewer will get Covid and eventually it will disappear” (23%).
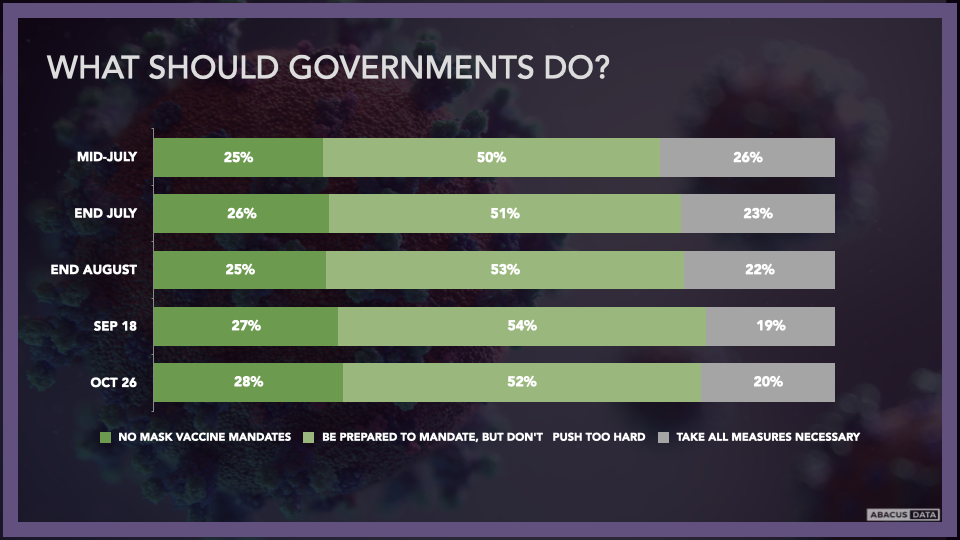
MOST WANT GOVERNMENT TO BE VIGILANT BUT RESTRAINED
Most (52%) want government is to be prepared to introduce measures if things worsen, “but not to push too hard”. About a quarter (28%) say under no circumstances should government put in mask, vaccine or other rules. One in five (20%) say government should take all possible measures to reduce the spread of the disease. These numbers are relatively stable.
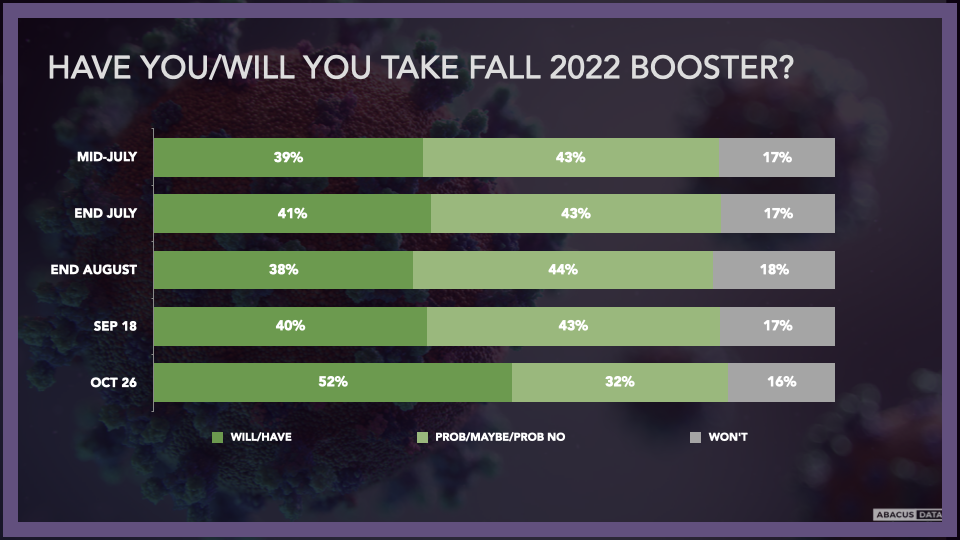
RISING NUMBERS GETTING BOOSTED, BUT HESITANCY STILL ELEVATED.
While 90% of the adults surveyed have had some vaccination against Covid, but not all of those are willing to take a booster this fall. We have seen a significant uptick in the number who report that they either already have or will take a booster this fall (totalling 52%) and 16% say they will not take one. The total persuadable but hesitant group is now 32%.
Two out of three (69%) think it is certain or probably that the high vaccination rate for Covid in Canada helped save lives compared to what would have happened if fewer people had been vaccinated. Another 18% say this may be the case, while 13% are doubtful or reject the value of the vaccinations.
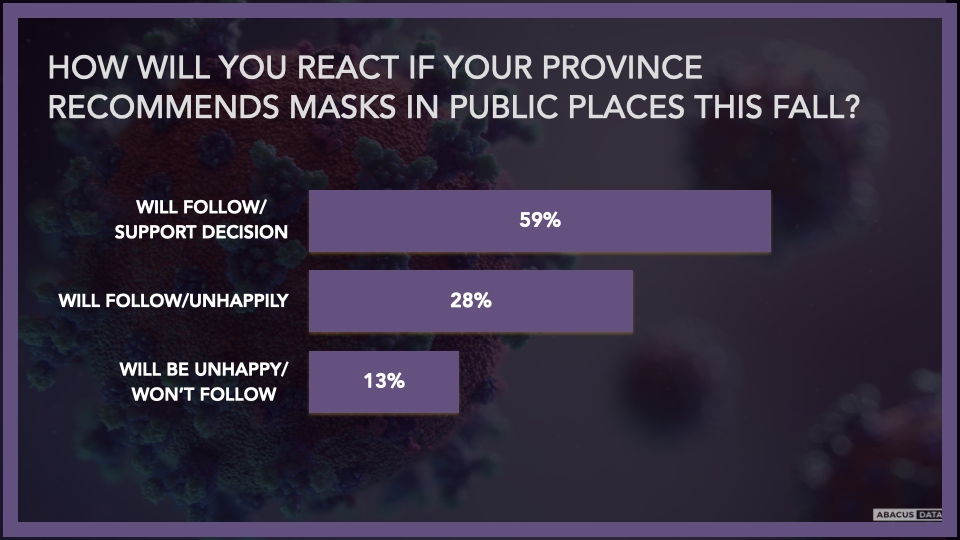
MASK MANDATES: MOST WOULD FOLLOW, BUT NOT ALL HAPPILY
If their provincial government mandated wearing masks in public places, 59% would support and follow that guidance, while 28% say they would follow the guidance but be unhappy about that decision by government. 13% say they would dislike the decision and ignore it.
UPSHOT
Anxiety levels of Covid are up slightly, but people remain broadly of the view that the severity will be moderate and hospitalizations relatively few. While more people are taking the recommended fall boosters, a significant proportion of those who have been vaccinated in the past is holding off getting another shot. People are not wanting governments to abandon vigilance but they do want public policy that errs on the side of restraint when it comes to additional actions, unless and until they become more aware and worried about what is happening with the virus.
METHODOLOGY
The survey was conducted with 1,500 Canadian adults from October 22 to 26, 2022. A random sample of panelists were invited to complete the survey from a set of partner panels based on the Lucid exchange platform. These partners are typically double opt-in survey panels, blended to manage out potential skews in the data from a single source.
The margin of error for a comparable probability-based random sample of the same size is +/- 2.1%, 19 times out of 20.
The data were weighted according to census data to ensure that the sample matched Canada’s population according to age, gender, educational attainment, and region. Totals may not add up to 100 due to rounding.
We are the only research and strategy firm that helps organizations respond to the disruptive risks and opportunities in a world where demographics and technology are changing more quickly than ever.
We are an innovative, fast-growing public opinion and marketing research consultancy. We use the latest technology, sound science, and deep experience to generate top-flight research-based advice to our clients. We offer global research capacity with a strong focus on customer service, attention to detail, and exceptional value.
We were one of the most accurate pollsters conducting research during the 2021 Canadian election following up on our outstanding record in 2019.
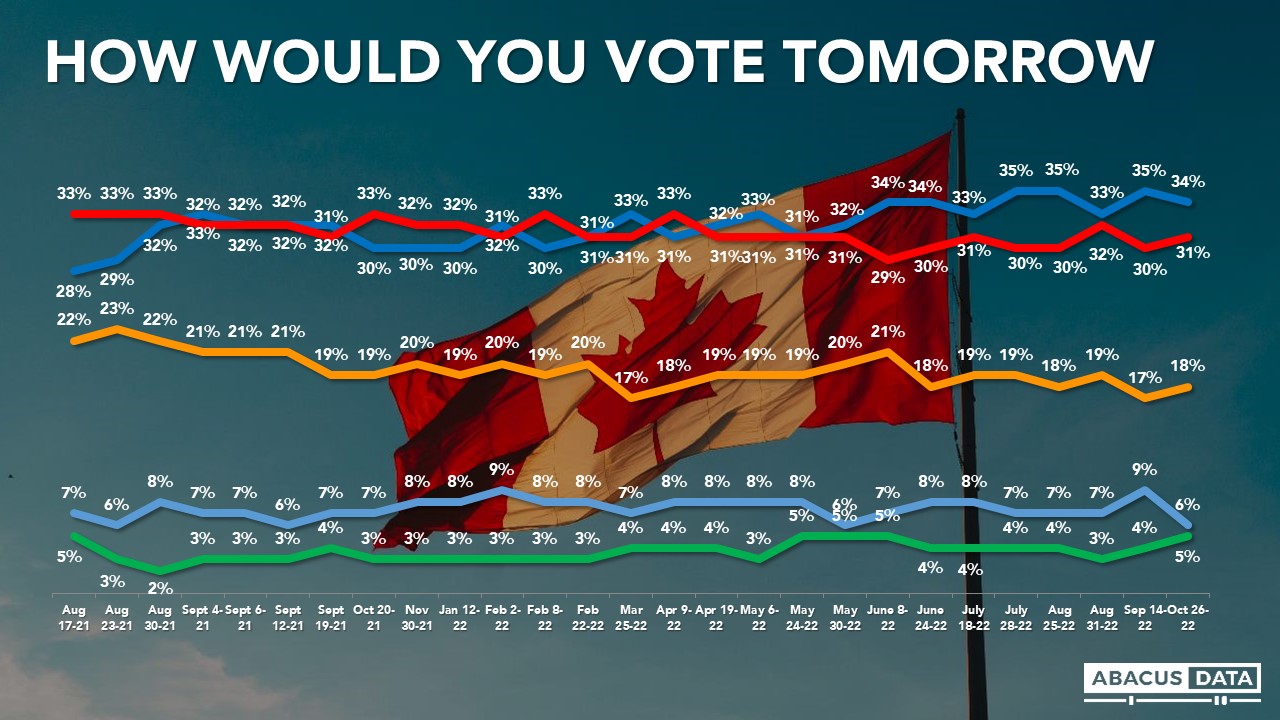
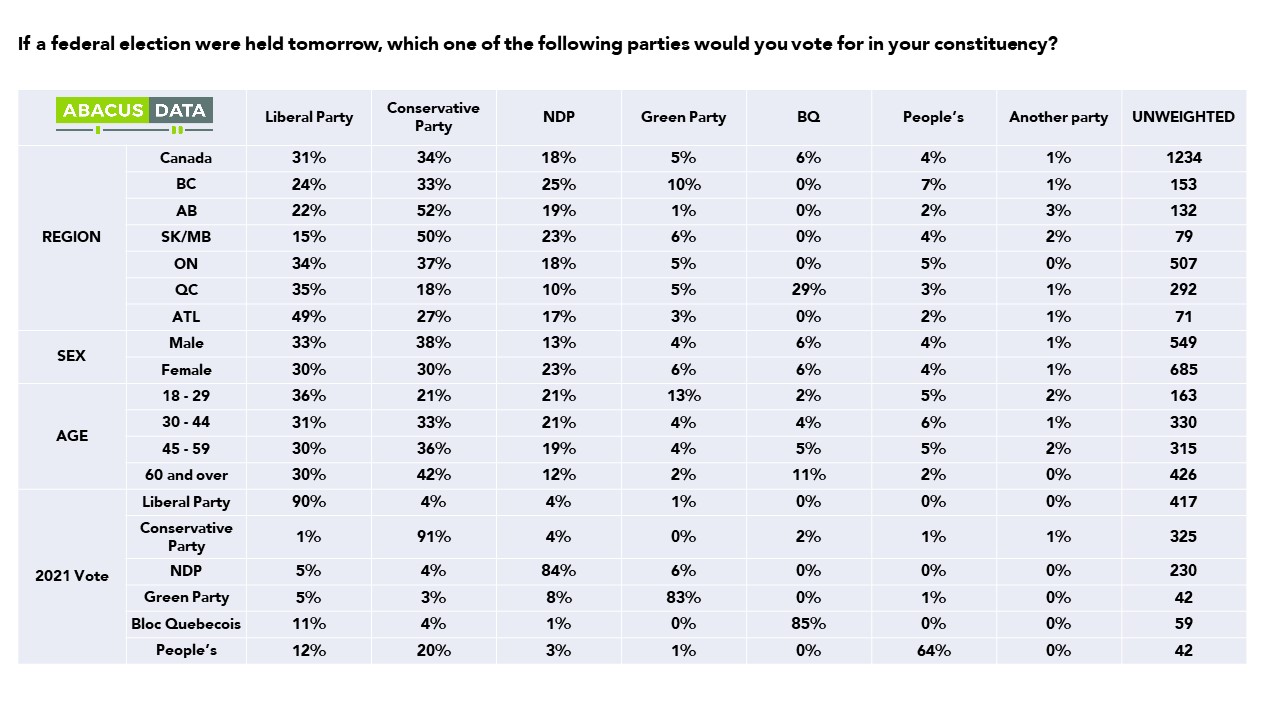
If an election were held today, 34% would vote for the Conservative Party, 31% for the Liberal Party, 18% for the NDP and 6% for the BQ.
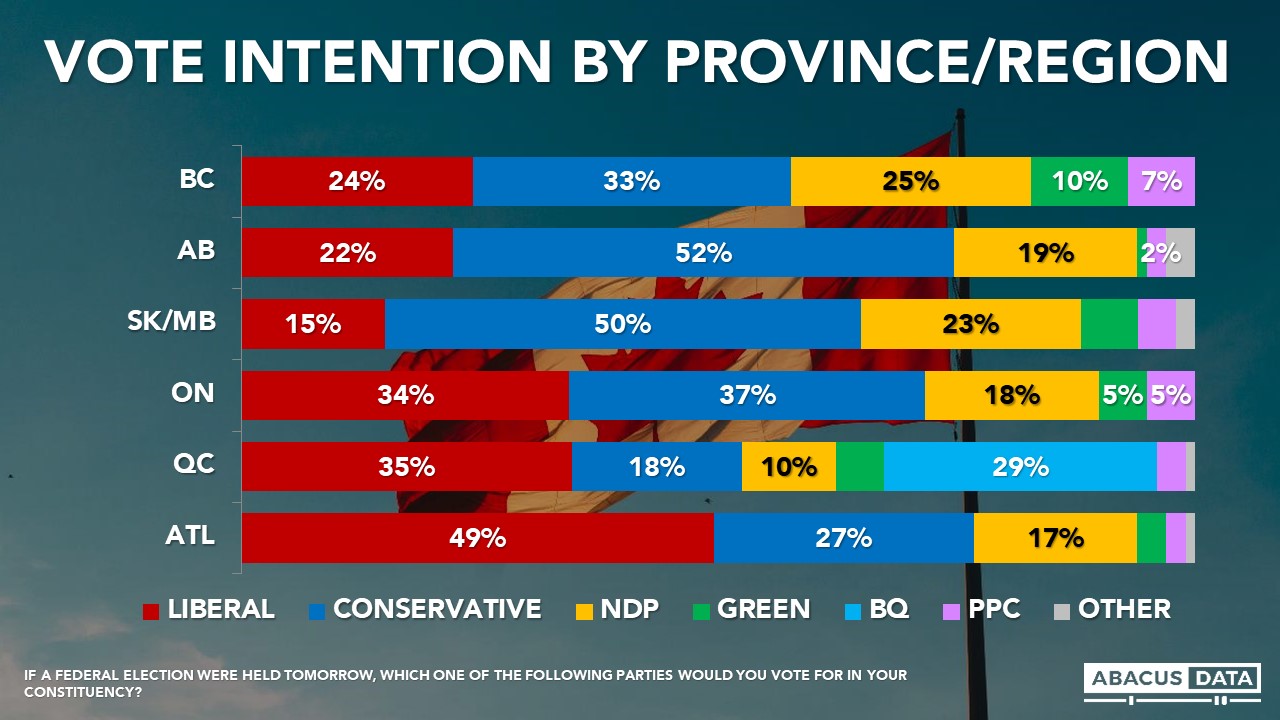
The Conservatives are ahead in British Columbia, Alberta, Saskatchewan and Manitoba. The Conservatives also have a small 3-point advantage in Ontario. In Quebec, the Liberals lead the BQ by 6 points while the Liberals are well ahead in Atlantic Canada.
The Conservatives have been numerically ahead of the Liberals since June in our tracking.
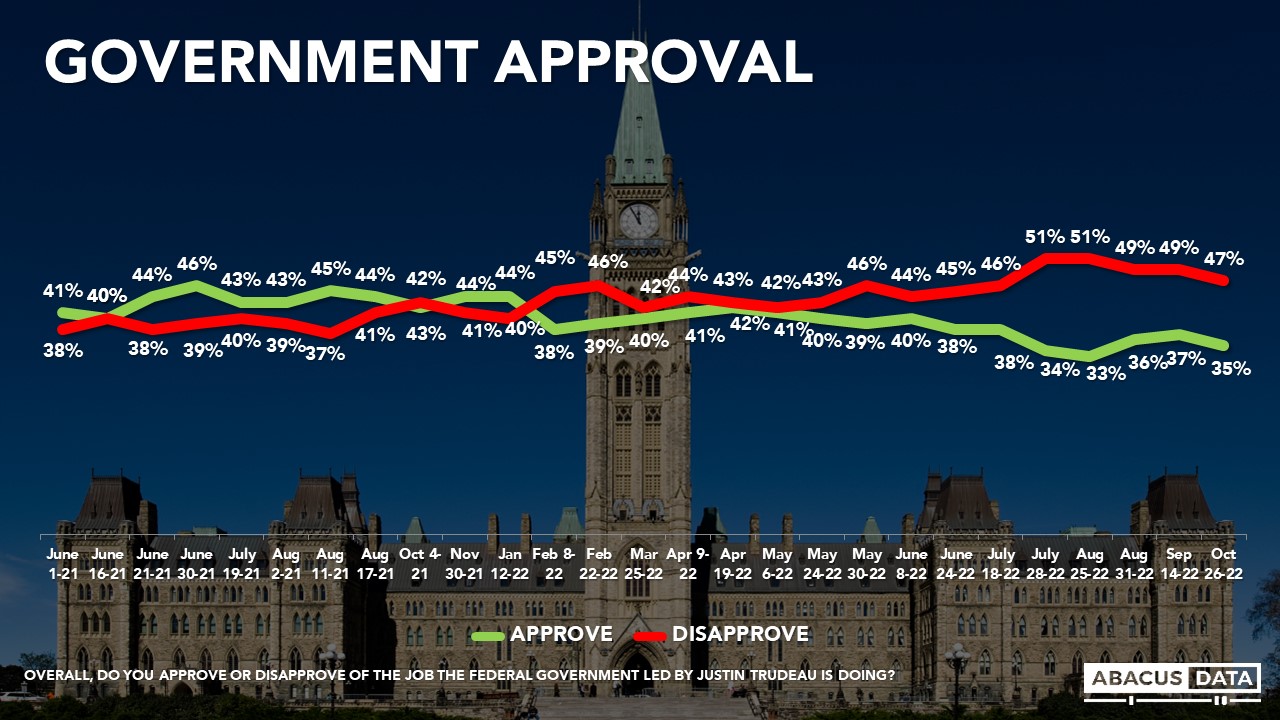
SATISFACTION WITH FEDERAL GOVERNMENT LARGELY UNCHANGED
Today, 35% approve, and 47% disapprove of the performance of the federal government, a two point drop in both measures since mid-September.
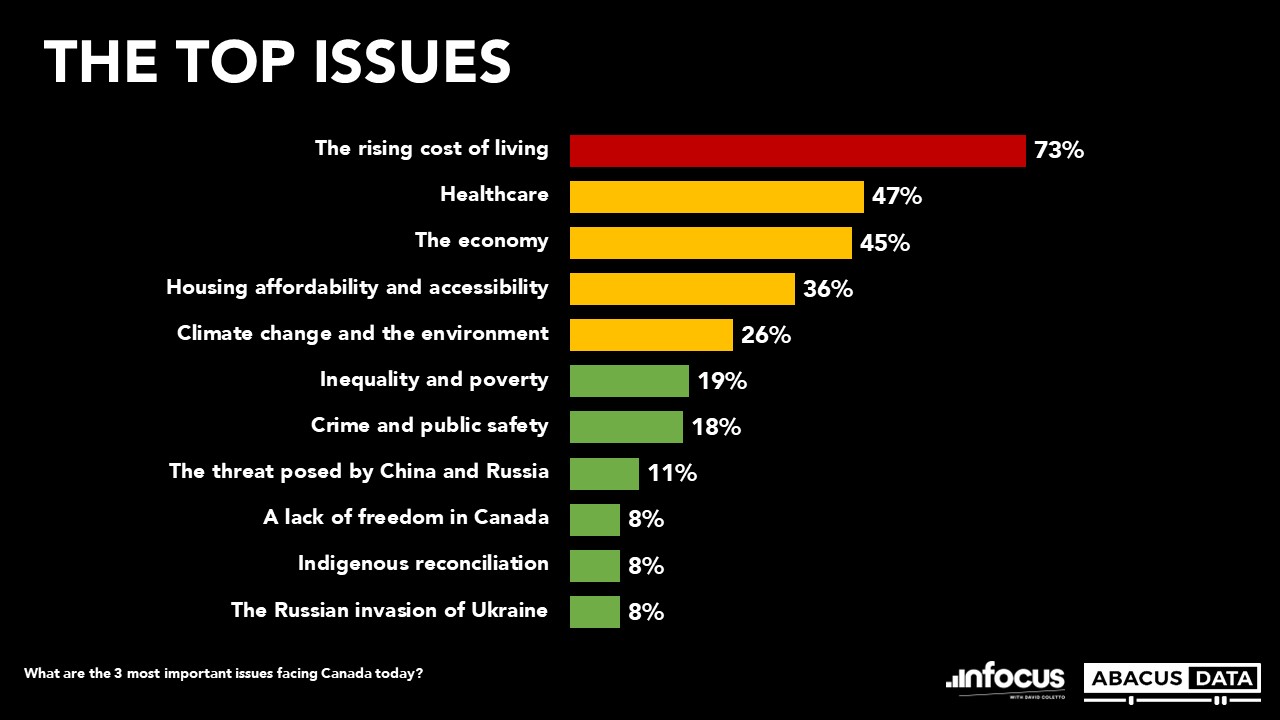
THE RISING COST OF LIVING IS THE TOP ISSUE
When asked to select the three most important issues facing Canada today, 3 in 4 selected the rising cost of living, followed by healthcare (47%), the economy (45%), housing affordability (36%), and climate change and the environment (19%).
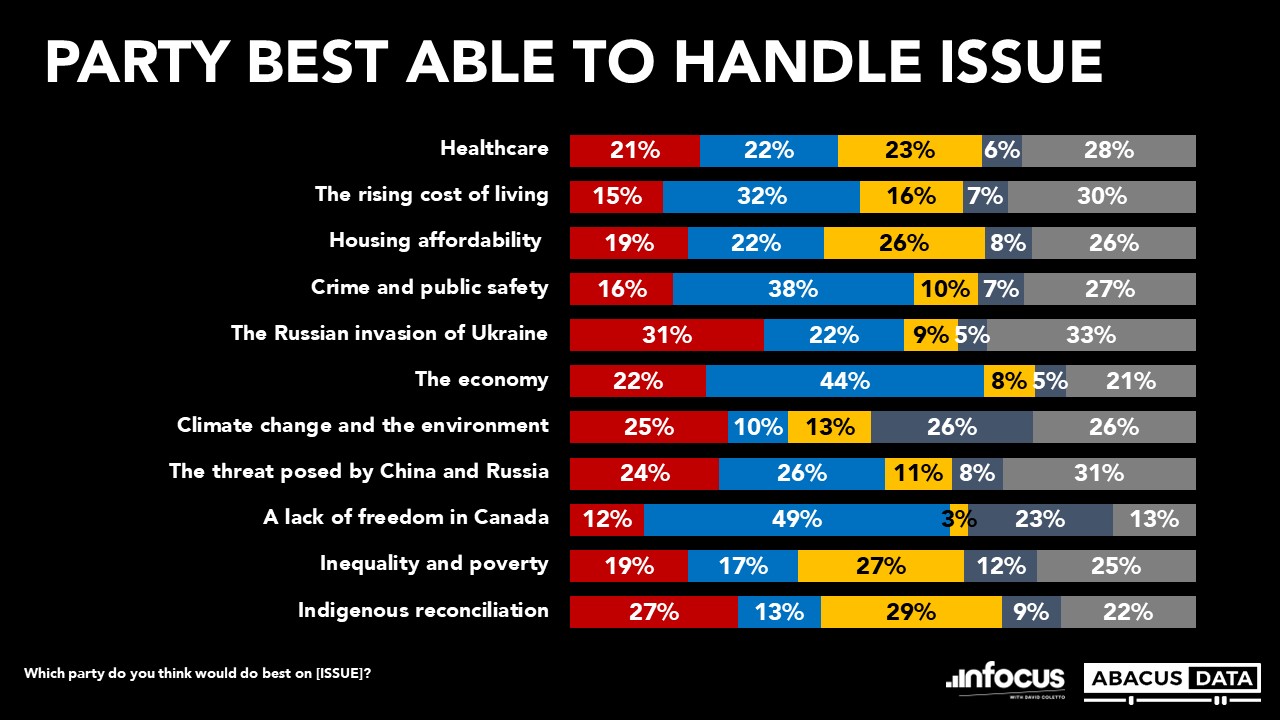
When asked which party would do the best on the issues they selected, the Conservatives lead on the economy, lack of freedom in Canada, crime and public safety. The Liberals are slightly ahead of the Greens on climate change and the environment and ahead on the Russian invasion of Ukraine. The NDP leads on housing affordability, inequality, and poverty.
On the top issue of the rising cost of living, the Conservatives have a substantial advantage over the other parties. 32% picked the Conservatives followed by the NDP at 16% and the Liberals at 15%.
The three main parties are within a few points of each other on healthcare while the NDP and Liberals are basically tied on indigenous reconciliation.
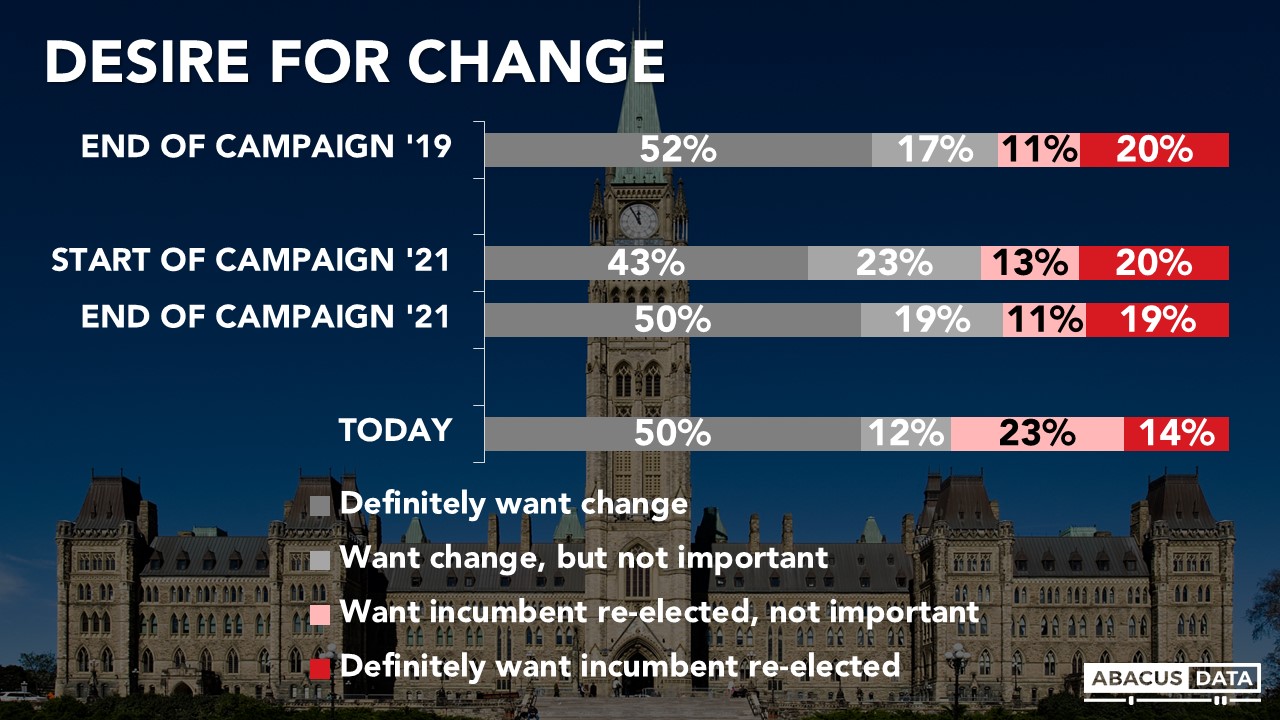
DESIRE FOR CHANGE SIMILAR TO THE END OF THE 2021 ELECTION
Today, 50% of Canadians definitely want to see a change in government while another 12% would like to see change but say it’s not that important to them. In contrast, 37% would like to see the Liberals re-elected but only 14% say they definitely want the Liberals re-elected.
Compared to the end of the 2021 federal election campaign, the intense desire for change is unchanged while those wanting to definitely see the Liberals re-elected is down 5-points.
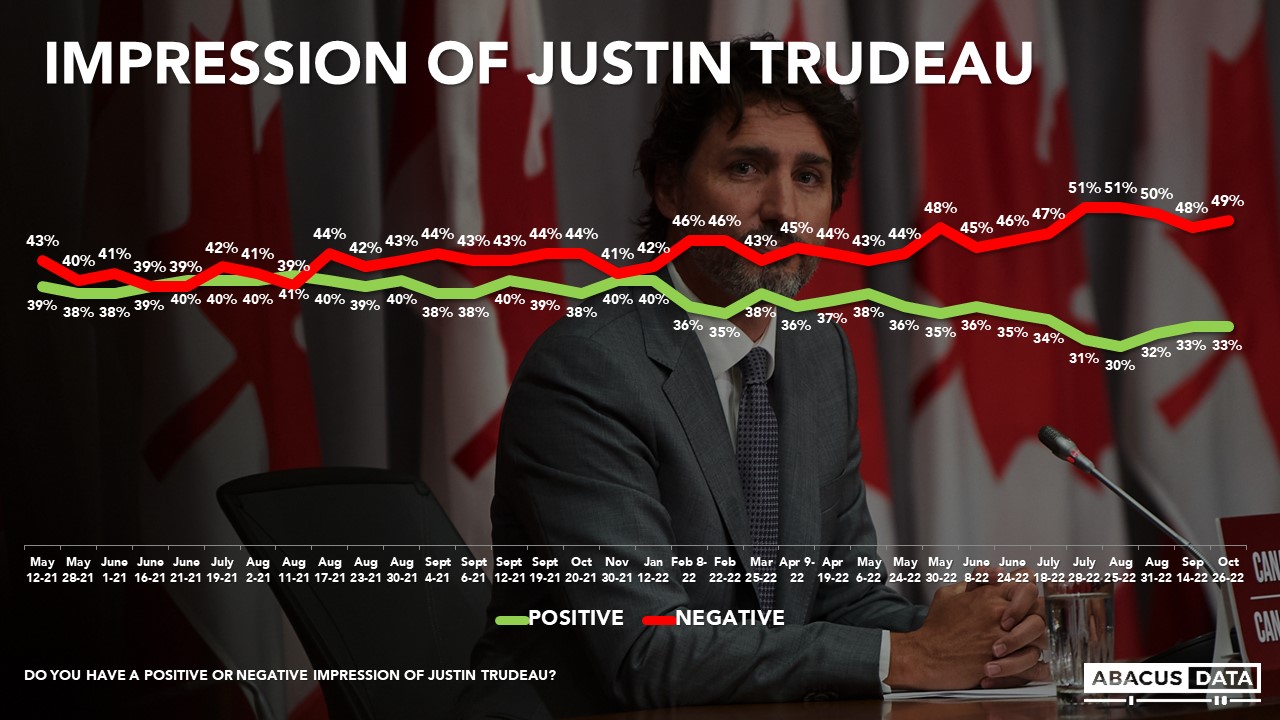
FEELINGS ABOUT THE PM ARE STABLE
Public feelings about Prime Minister Trudeau have stabilized after a rise in negative feelings in the summer. The Prime Minister’s negatives stand at 49% – down from a peak of 51% – and up only a single point from last month.
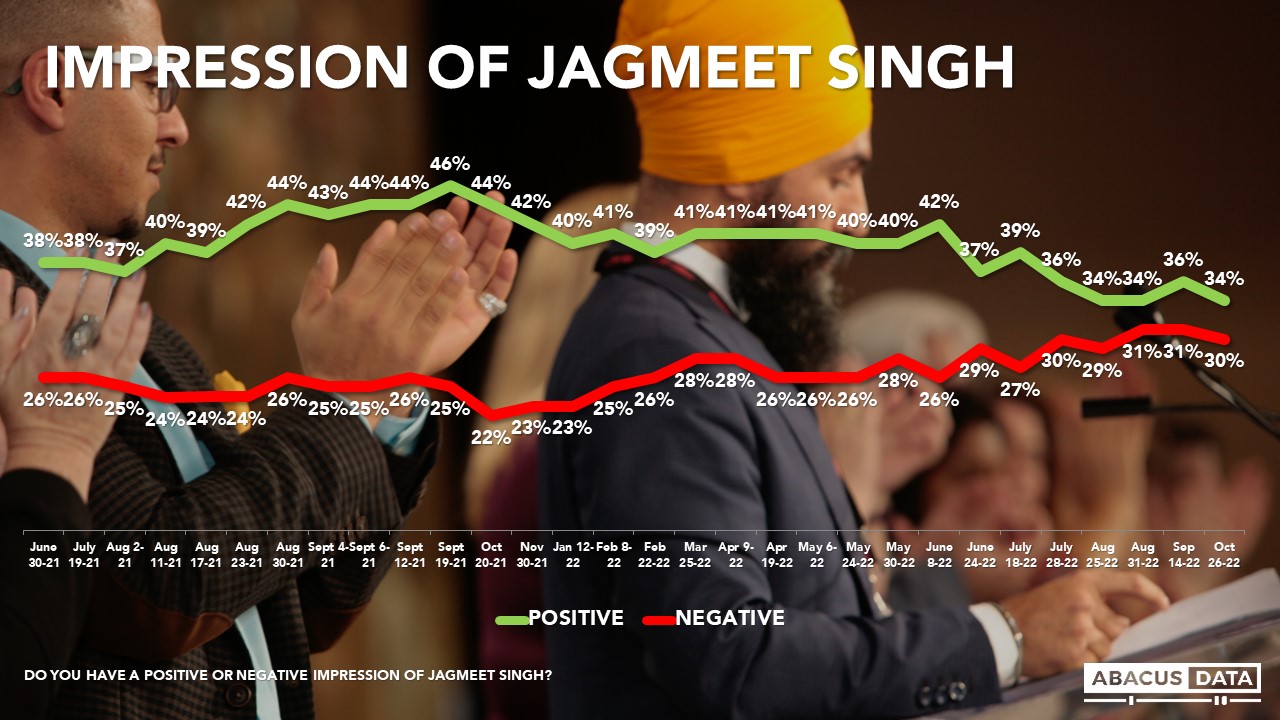
JAGMEET SINGH’S APPROVAL RATING DOWN SLIGHTLY
For the last couple of years, Jagmeet Singh has been the most popular of the federal leaders, at one time his net rating was +21 (46% positive/25% negative). Since then, his positives have slid, and his negatives have risen. This latest result shows no further shift in line with the average since mid-summer.
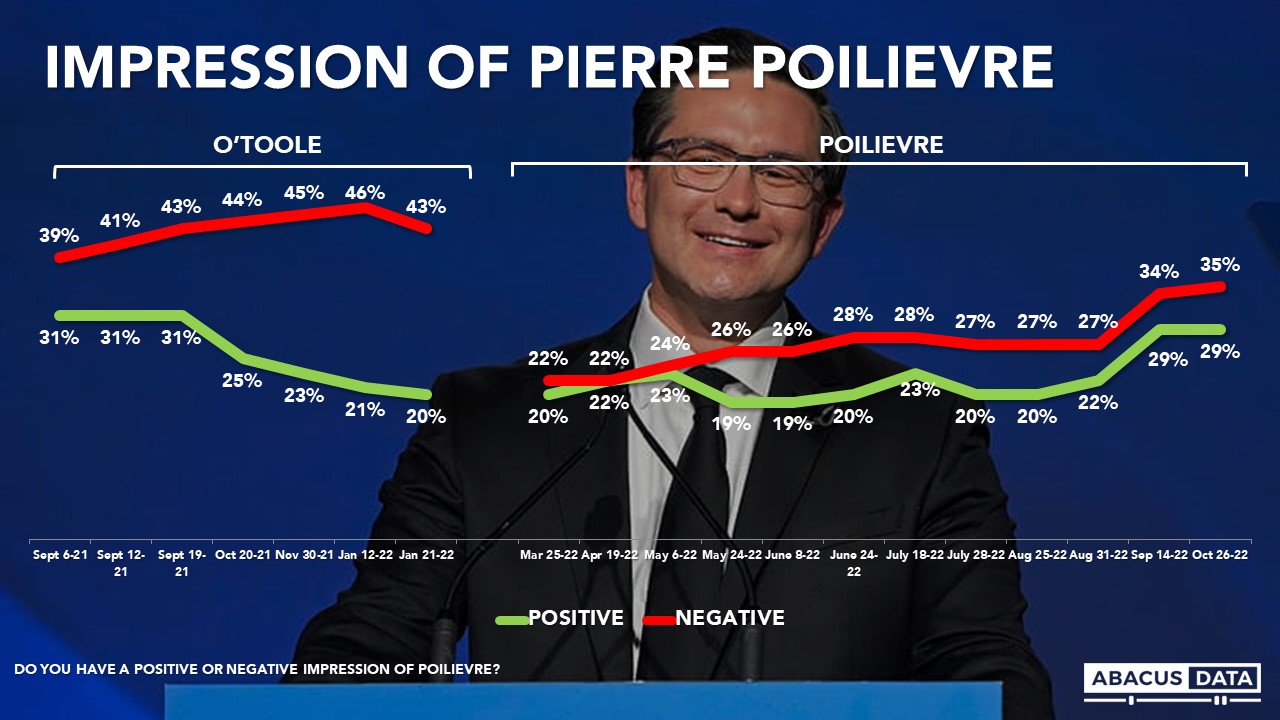
PIERRE POILIEVRE: MANY STILL DON’T HAVE AN OPINION
Over the past month, impressions of Pierre Poilievre have not changed much. His negatives are up a single point to 35% while his positives are steady at 29%.
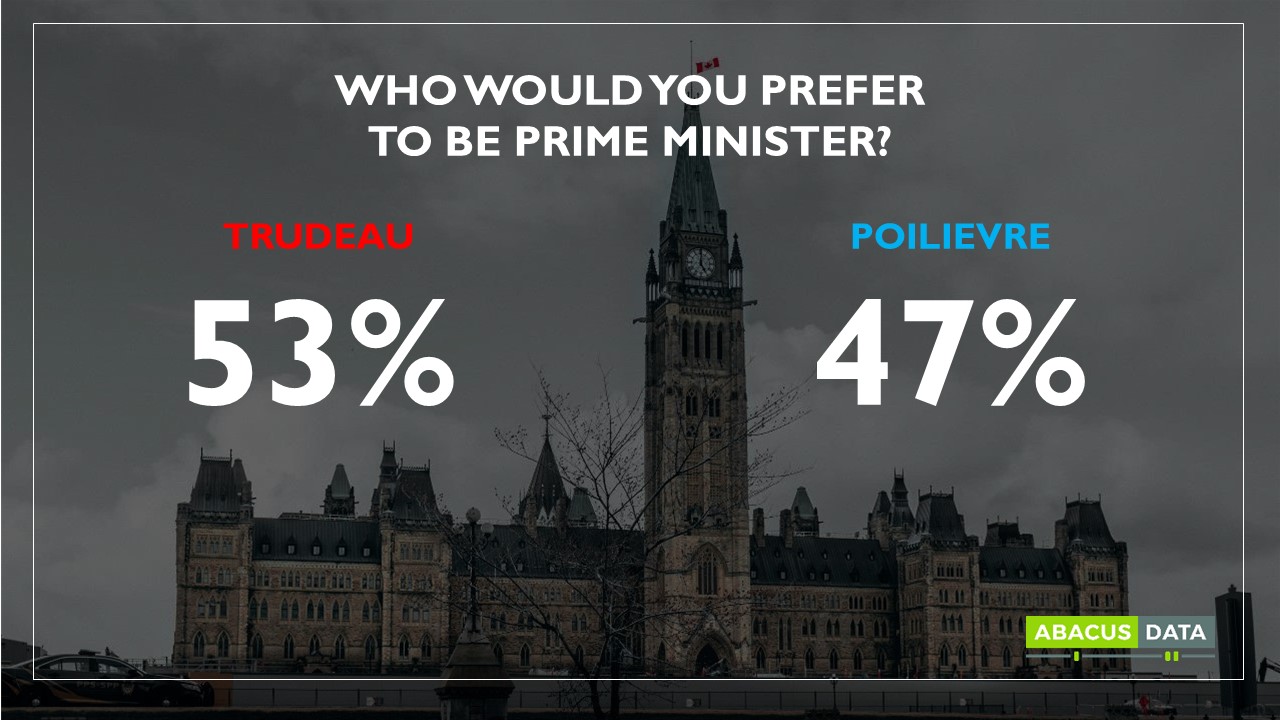
TRUDEAU vs. POILIEVRE
One of the things we are starting to track again is the preference for either Mr. Trudeau or Mr. Poilievre as Prime Minister. Today, 53% of Canadians would prefer Mr. Trudeau as Prime Minister while 47% would prefer Mr. Poilievre.
Regionally, Mr. Trudeau is the preferred choice of half or more in Ontario (52%), Quebec (66%), and Atlantic Canada (63%). Mr. Poilievre is the preferred choice by half or more in BC (52%), Alberta (57%), and Saskatchewan and Manitoba (61%).
Among current NDP supporters, Trudeau is preferred by a 4 to 1 margin (72% to 28%). Among BQ supporters, Trudeau is preferred 58% to 42% over Poilievre.
UPSHOT
According to Bruce Anderson:“These numbers illustrate that the Liberals are vulnerable and also that support for the Conservatives is somewhat tentative. Neither party sees unqualified good or bad news in this public opinion environment. For the Liberals, trailing badly on economic issues is a major risk but one that hasn’t yet translated into a clear voting preference for the Conservatives.
Liberals will also note that public opinion about NDP Leader Singh is quite a bit weaker than it has been in recent years, and NDP voter preference for Trudeau over Poilievre is wide. But the numbers of voters restless for change is at a level that is hazardous for the Liberals, and Mr. Trudeau’s personal numbers are among the lowest he has seen. Conservatives see opportunity but voters aren’t flocking to them, Liberals see risk but not insurmountable challenges.”
According to David Coletto: “The political opinion environment has been fairly steady since the early summer. The Conservatives hold a slight national lead over the Liberals. Views of the Prime Minister and his government have stabilized while impressions of Mr. Poilievre and Mr. Singh have held steady.
As Minister Freeland gets set to release the Fall financial update, the Liberals should be worried about their standing on two key issues: the cost of living and the economy. For Canadians who care about those issues, the Liberals trail the Conservatives quite badly on which party people think will do the best job.”
METHODOLOGY
The survey was conducted with 1,500 Canadian adults from October 22 to 26, 2022. A random sample of panelists were invited to complete the survey from a set of partner panels based on the Lucid exchange platform. These partners are typically double opt-in survey panels, blended to manage out potential skews in the data from a single source.
The margin of error for a comparable probability-based random sample of the same size is +/- 2.1%, 19 times out of 20.
The data were weighted according to census data to ensure that the sample matched Canada’s population according to age, gender, educational attainment, and region. Totals may not add up to 100 due to rounding.
We are the only research and strategy firm that helps organizations respond to the disruptive risks and opportunities in a world where demographics and technology are changing more quickly than ever.
We are an innovative, fast-growing public opinion and marketing research consultancy. We use the latest technology, sound science, and deep experience to generate top-flight research-based advice to our clients. We offer global research capacity with a strong focus on customer service, attention to detail, and exceptional value.
We were one of the most accurate pollsters conducting research during the 2021 Canadian election following up on our outstanding record in 2019.
Over the last several months we’ve been measuring how Canadians are reacting to the higher rate of inflation and rising interest rates today. Here’s what we found in our latest tracking.
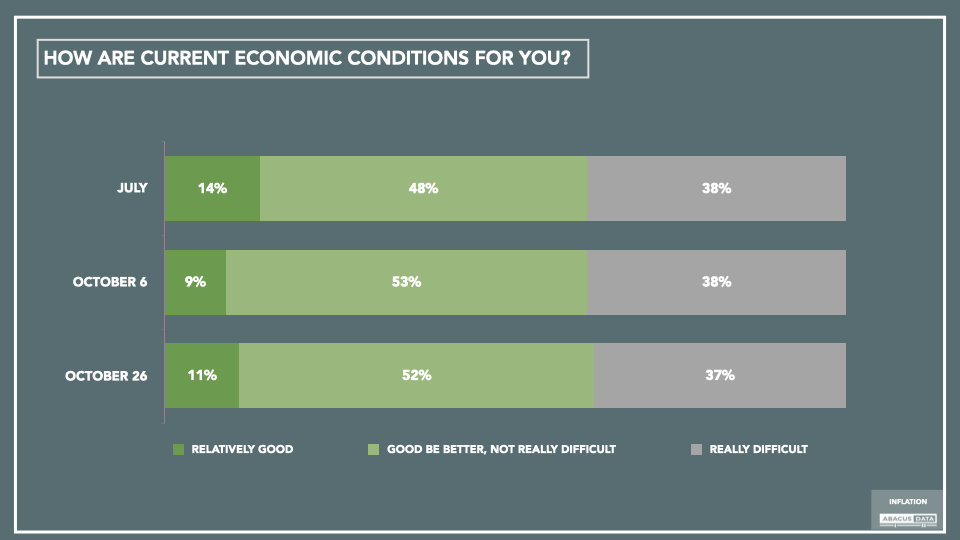
CURRENT PERSONAL ECONOMIC CONDITIONS
Today, 11% say the economic conditions for them personally are relatively good, while 52% things “could be better but are not really difficult.” Just over a third (37%) say things are really difficult for them. The proportion who says things are really difficult for them is unchanged over the last four months.
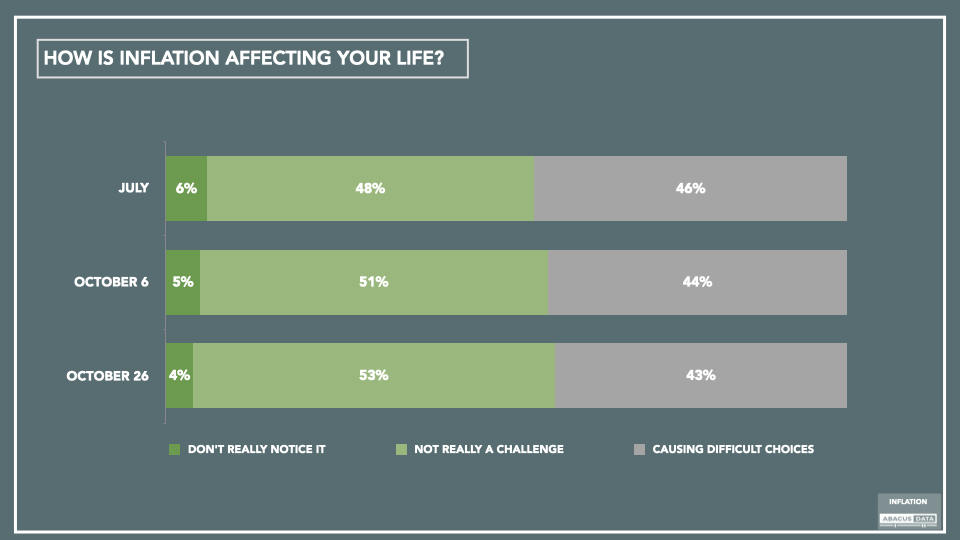
PERSONAL IMPACT OF INFLATION
Almost half (43%) say inflation has caused them to consider difficult choices to make ends meet, compared to 44% at the beginning of October and 46% in July. A bare majority – 53% – says “I notice it, but it hasn’t really been a challenge to live my life as I normally do.”
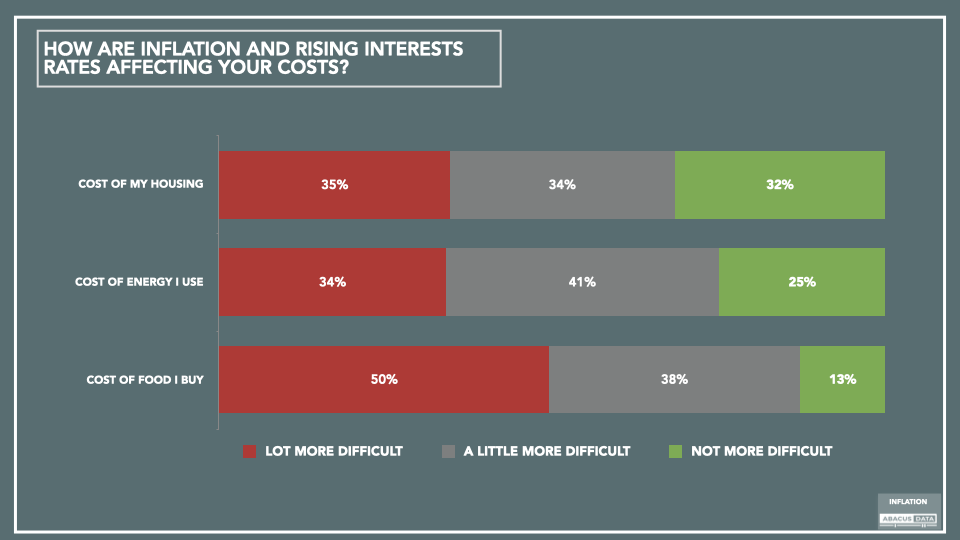
FOOD, ENERGY, & HOUSING COSTS
The biggest impact of rising inflation and interest rates is felt in the cost of food, with half of those interviewed saying things are a lot more difficult. A third say the same thing about housing and energy costs.
IS CANADA WORSE OFF WHEN IT COMES TO INFLATION?
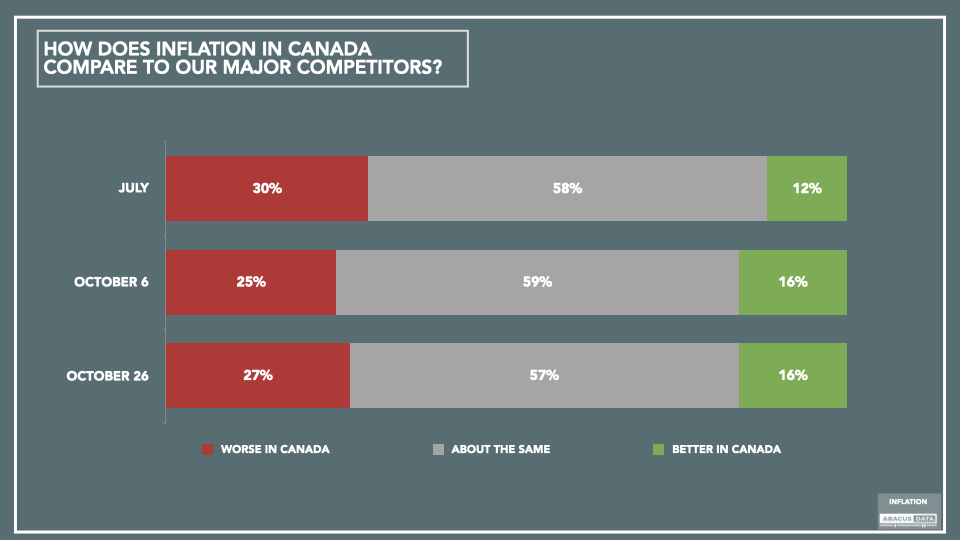
When asked how Canada is faring compared to our major competitor countries, one in four (27%) think inflation is worse here, while 57% say things are about the same, and 16% say things are worse in other places. Marginal change in these views.
IMPACT OF FEDERAL POLICIES ON INFLATION
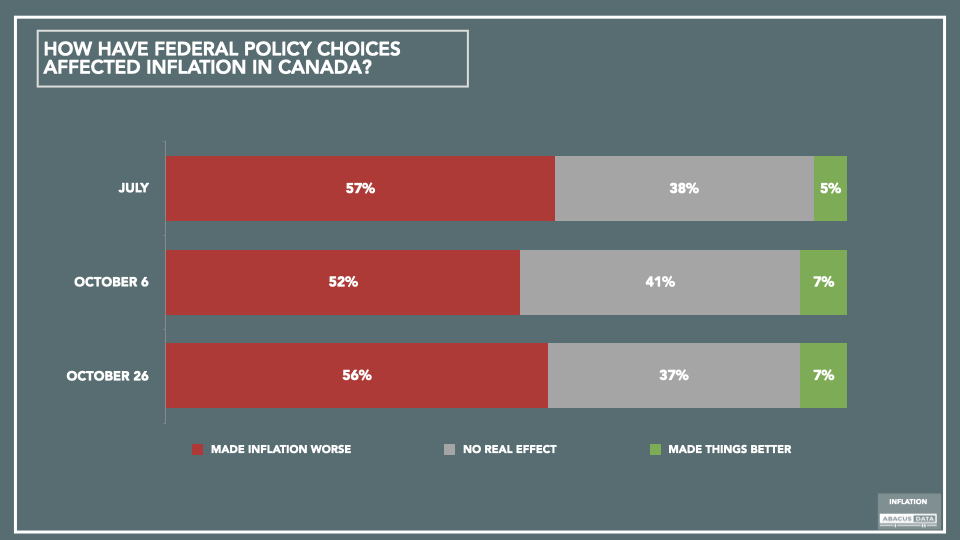
A majority of those polled (56%)) believe decisions made by the federal government in the last couple of years have made inflation worse than it would otherwise be, while 37% and 7% think Ottawa’s moves have lessened inflation.
WILL HIGH INFLATION ENDURE?
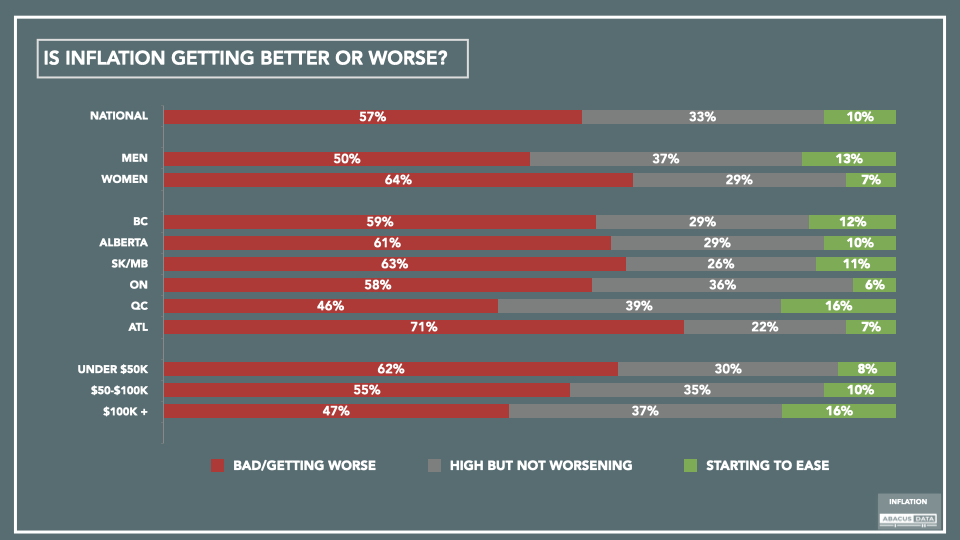
Over half (57%) believe “inflation is getting worse, and the future seems bad” while 33% think “inflation is high but is not getting worse” and 10% think “inflation is starting to ease, and things are starting to look better”.
UPSHOT
“Inflation is making life difficult for millions and is the number one political issue in the country. The biggest impacts are felt in food, but millions are also finding it difficult to cope with their energy and housing costs. At this point, most people see Canada as suffering the consequences of a global problem, but also tend to believe that federal policies have caused more harm than relief. This is likely because of concerns about the size of public expenditures in recent years, and whether those have helped fuel the inflation that is being experienced today. Pessimism is a bit stronger than optimism right now, in terms of how things will work out, and the political consequences surrounding this issue are very significant.”
METHODOLOGY
The survey was conducted with 1,500 adult Canadians, between October 22 to 26, 2022. A random sample of panelists were invited to complete the survey from a set of partner panels based on the Lucid exchange platform. These partners are typically double opt-in survey panels, blended to manage out potential skews in the data from a single source.
The margin of error for a comparable probability-based random sample of the same size is +/- 2.6%, 19 times out of 20.
The data were weighted according to census data to ensure that the sample matched Canada’s population according to age, gender, educational attainment, and region. Totals may not add up to 100 due to rounding.
ABOUT ABACUS DATA
We are the only research and strategy firm that helps organizations respond to the disruptive risks and opportunities in a world where demographics and technology are changing more quickly than ever.
We are an innovative, fast-growing public opinion and marketing research consultancy. We use the latest technology, sound science, and deep experience to generate top-flight research-based advice to our clients. We offer global research capacity with a strong focus on customer service, attention to detail, and exceptional value.
We were one of the most accurate pollsters conducting research during the 2021 Canadian election following up on our outstanding record in 2019.
Almost 6.5 million Canadian workers suffer mental health distress from work
Inflexible, unsupportive workplaces, unrewarding work and jobs that don’t pay the bills are leading factors in causing mental health distress for one in three working Canadians, who also say the problem is getting worse. Overall, almost half of Canadian workers say their mental health is less than good.
Last month, the Douglas Caldwell Layton Foundation commissioned Abacus Data to conduct a national survey of 2,000 working Canadians to explore the impact that working conditions and personal finances have on mental health. The survey explored how Canadians feel about their own mental health, what workplace factors most impact self-assessed mental health, and the role unions play in mitigating negative workplace experiences.
This is the first release from the large dataset and reports the extent to which Canadian workers are experiencing negative mental health and how work contributes to mental health distress. It finds:
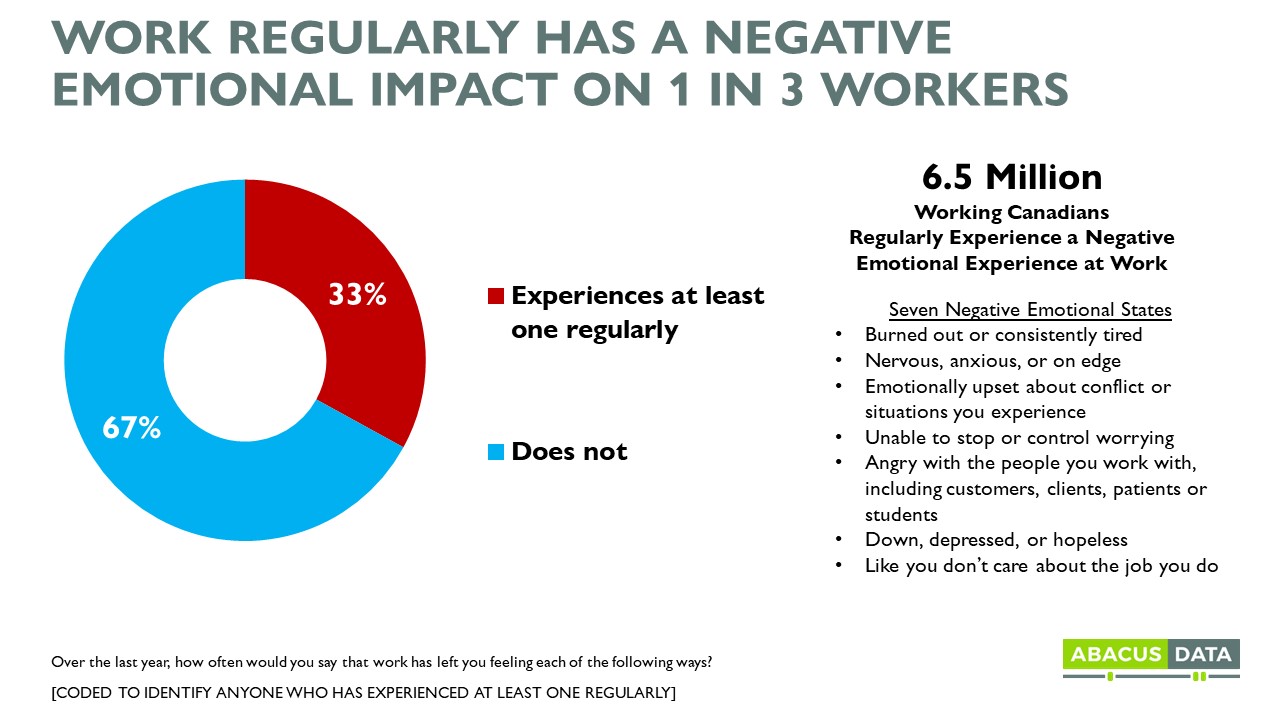
Work is a regular source of mental health distress for 1 in 3 workers, about 6.5 million working Canadians. This includes burnout, anxiety, nervousness, depression, and anger with co-workers or customers/patients/students.
Twice as many say things are getting worse than say believe they are getting better. 4 in 10 workers say negative emotions caused by their workplace are increasing.
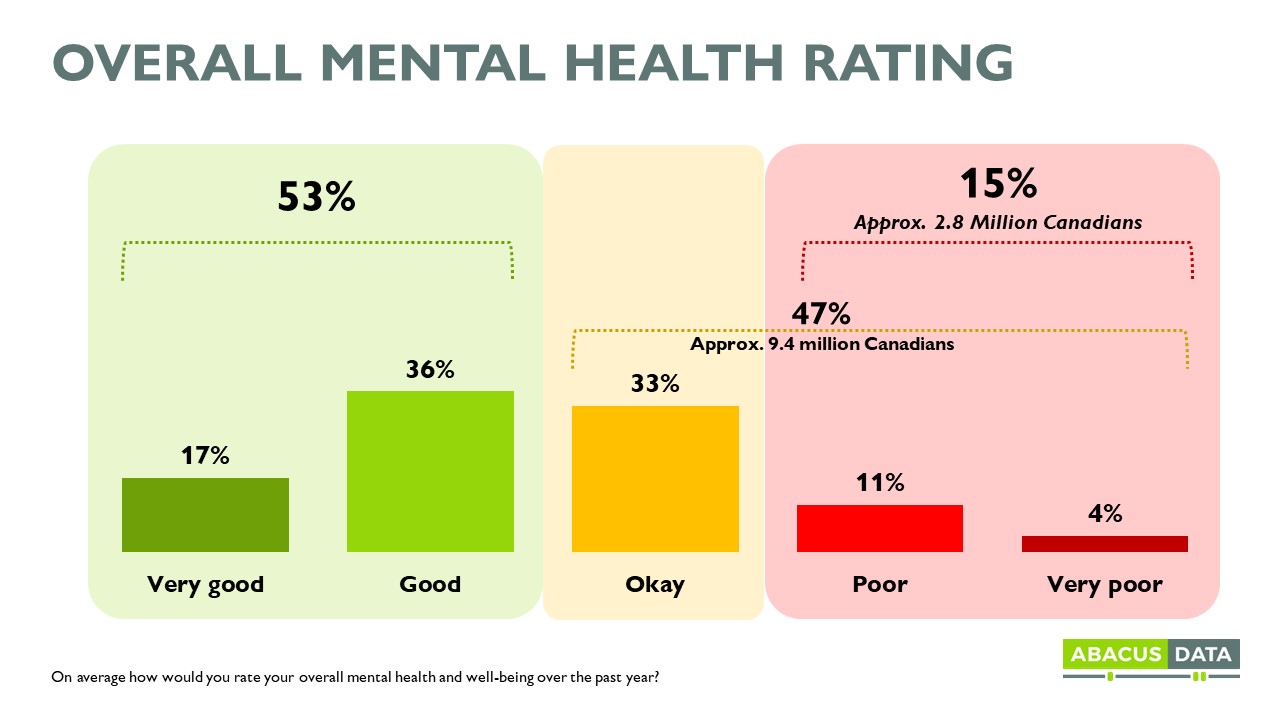
Almost half of working Canadians are facing mental health challenges. Approximately 9.4 million working Canadians describe their mental health as less than good (47% of working Canadians).
WHAT WORKPLACE FACTORS IMPACT REPORTED MENTAL HEALTH?
We asked a wide range of questions about possible causes of mental health distress at work, checking factors ranging from physical workplace conditions, work relations, and the demands of work. A multivariate regression analysis found that all else being equal, the leading predictors of poorer mental health from work include:
Inflexible and unsupportive workplaces.
Work that doesn’t provide much meaning or fulfilment.
Jobs that leave workers no further ahead financially and anxious.
Office workers were significantly more likely to report poorer mental health than front-line workers who work directly with students, patients, customers or clients, or on-site workers in jobs such as construction or manufacturing, all else being equal.[1]
WORK AND MENTAL HEALTH
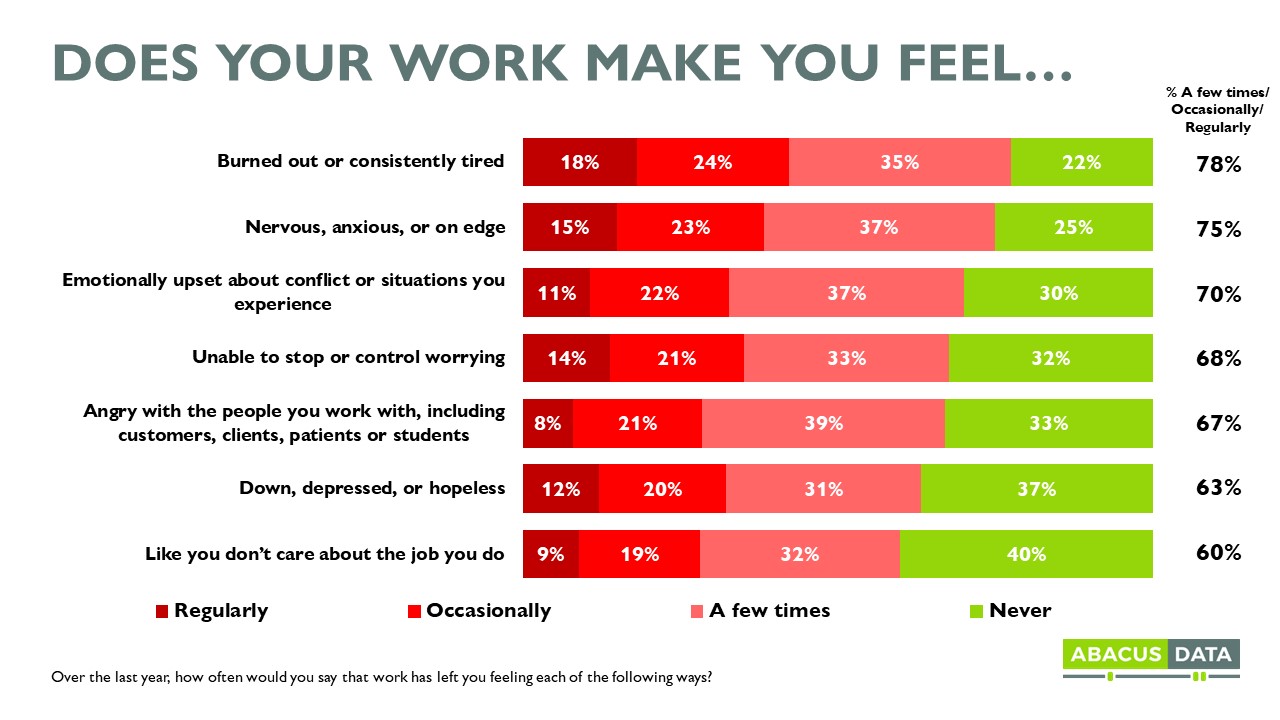
Workers were asked how often their work has left them feeling several different emotions. Almost all working Canadians have experienced some negative emotions caused by work but some are more frequent than others.
For example:
42% of workers say work regularly or occasionally makes them feel burned out or consistently tired.
38% say their work leaves feeling nervous, anxious, or on edge occasionally or regularly.
35% say they can’t stop or control worrying because of their work occasionally or regularly
32% say work leaves them feeling down, depressed, or hopeless.
29% say they occasionally or regularly are angry with the people they work with, including customers, clients, patients, or students.
When we aggregate this data, we find that work regularly has a negative emotional impact on 1 in 3 or approximately 6.5 million Canadians workers.
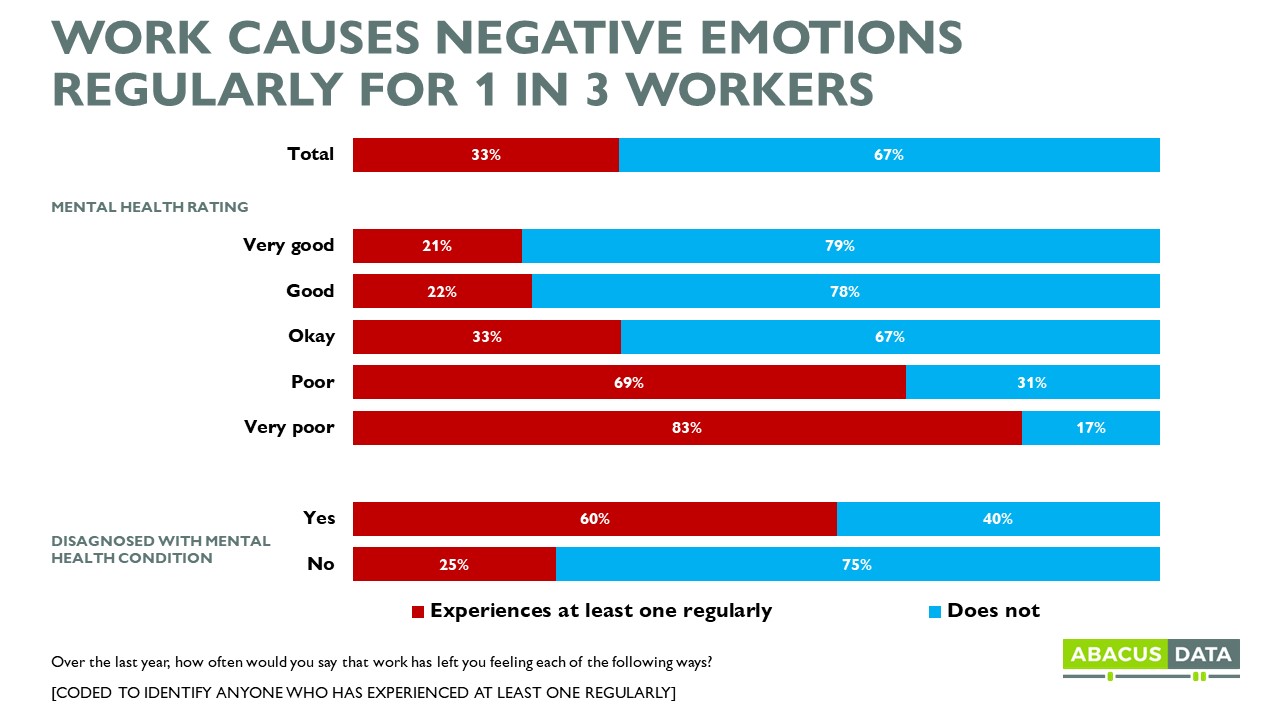
And there is a direct relationship between working causing negative emotions and one’s reported mental health. For example:
83% of those who say their mental health is very poor report regularly experience at least one negative emotion because of work.
69% of those who say their mental health is poor report regularly experience at least one negative emotion because of work.
33% of those who say their mental health is okay report regularly experience at least one negative emotion because of work.
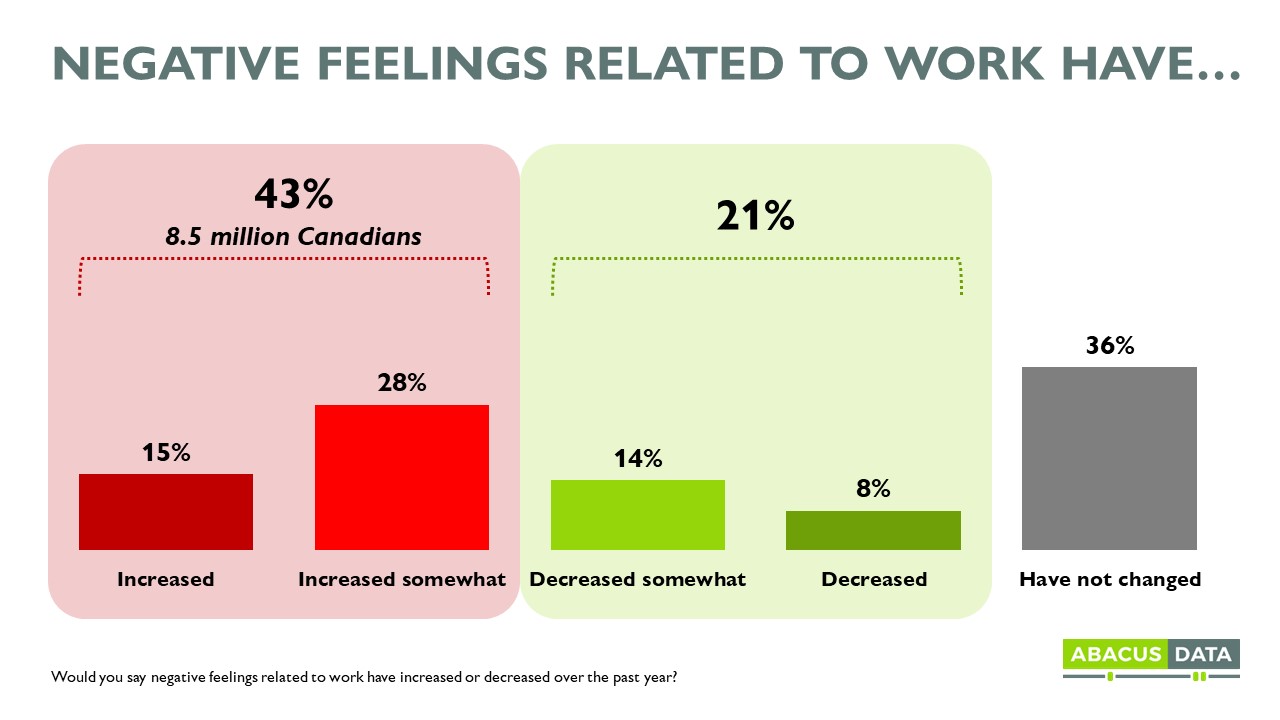
And despite the widespread incidence of poor mental health, 43% of workers say negative feelings related to work have increased over the past year.
ALMOST HALF OF WORKING CANADIANS SAY THEIR MENTAL HEALTH ISN’T GOOD. 2.8 MILLION SAY THEIR MENTAL HEALTH IS POOR.
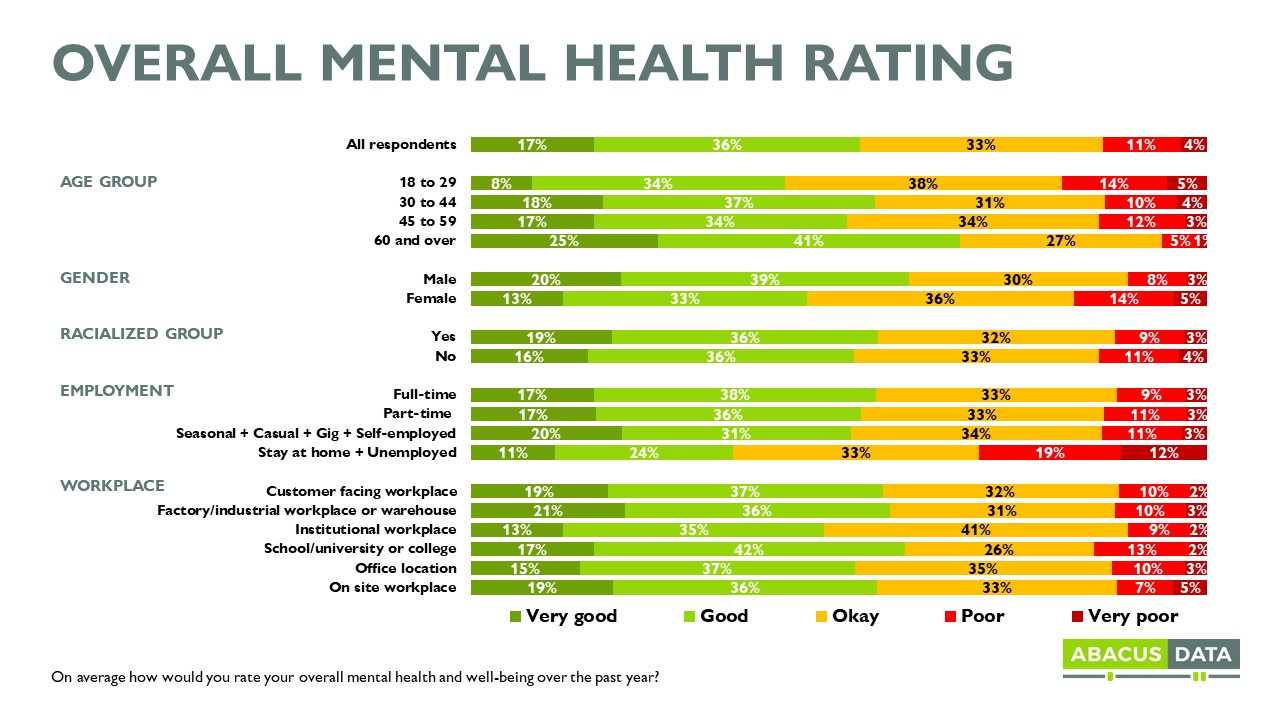
Approximately 9.4 million working Canadians describe their mental health as less than good. 33% say it is okay while 15% say it is poor or very poor.
Younger workers, female workers, and those who are currently unemployed or stay at home (not working) report worse negative mental health than others.
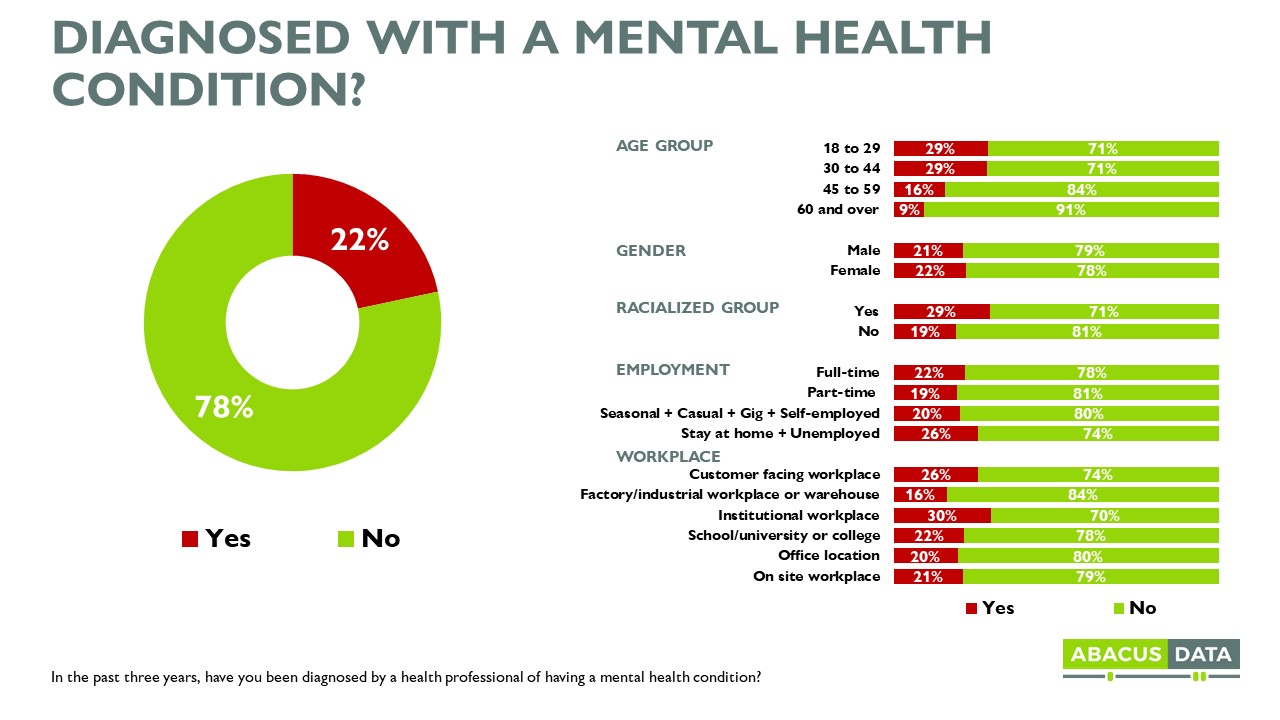
1 IN 5 WORKING CANADIANS SAY THEY HAVE BEEN DIAGNOSED WITH A MENTAL HEALTH CONDITION
22% of working Canadians say they have been diagnosed with a mental health condition.
Those under 45 years of age are more than twice as likely to say they have been diagnosed with a mental health condition than older workers. The incidence of mental health diagnoses is similar among men and women, and across different employment situations.
Of note, those working in an institution like a hospital or school or those working in a customer-facing workplace (like retail) are more likely to report being diagnosed with a mental health condition than others.
UPSHOT
Millions of Canadian workers describe their mental health as poor or very poor. Millions more are simply “okay”. This survey shows how widespread the mental health crisis has expanded throughout the Canadian labour force.
Worse, the results suggest things are only getting worse, before they get better as millions of workers say that work has caused them to feel burned out, down, depressed, anxious, and disengaged.
When we look at how work might be contributing to poorer mental health, the leading factors are inflexible work, unsupportive workplaces, and financial insecurity.
METHODOLOGY
Our survey was conducted online with 2,000 working Canadians aged 18 and over from September 6 to 13, 2022. A random sample of panellists was invited to complete the survey from a set of partner panels based on the Lucid exchange platform. These partners are double opt-in survey panels, blended to manage out potential skews in the data from a single source.
The margin of error for a comparable probability-based random sample of the same size is +/- 2.2%, 19 times out of 20. The data were weighted according to census data to ensure that the sample matched Canada’s working-age population according to age, gender, educational attainment, and region. Totals may not add up to 100 due to rounding.
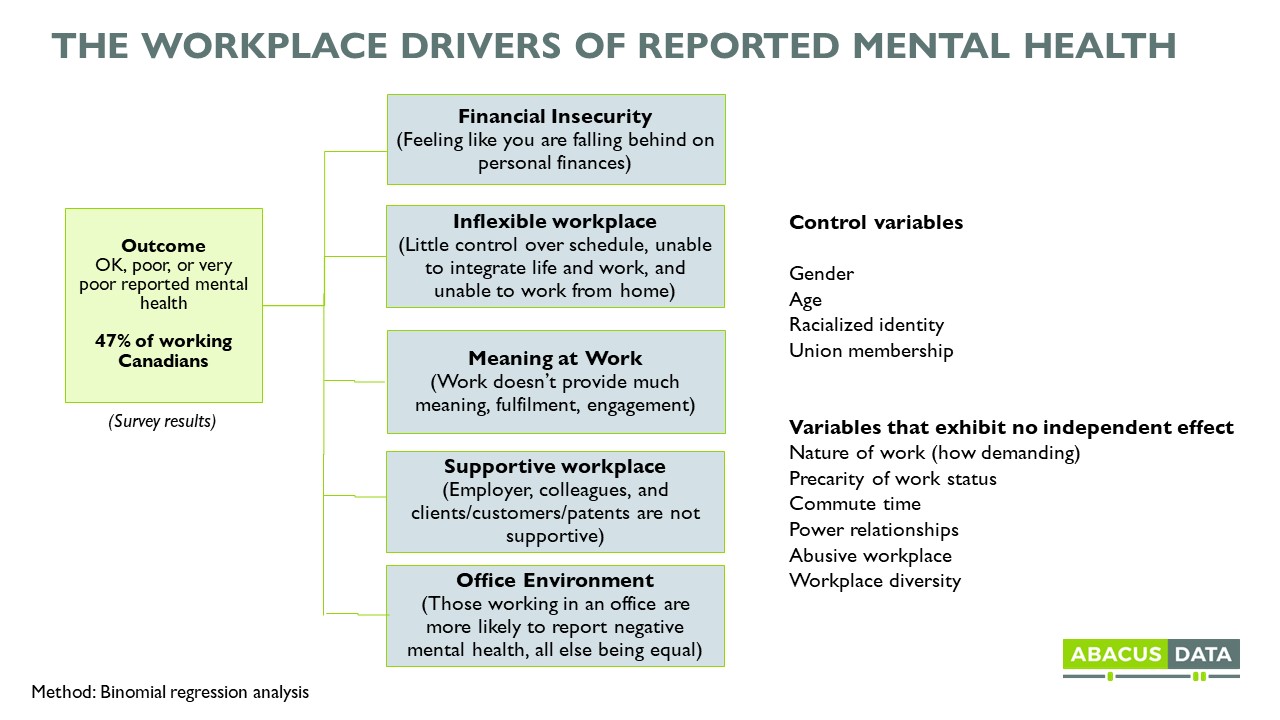
Research Objective: To understand how a person’s work, their working conditions, and financial situation might predict their reported mental health.
Method: We conduct a multivariate analysis using binomial regression. Variables were created based on the responses to several questions in the survey.
How to analyze: The results of the model allow us to isolate the effect of a variable on self-reported mental health, all else being equal.
What predicts negative mental health?
Union members are less likely to report negative mental health, than those not in a unionized workplace, all else being equal.
Financial insecurity is a major predictor of poor mental health. Those who feel they are falling behind financially are much more likely to report negative mental health than those who don’t feel financially insecure, all else being equal.
Perceived job security predicts poor mental health. Those who feel their job is insecure or they would be unable to find another job if they lost their current one are more likely to report negative mental health, all else being equal.
Workplace flexibility is a strong predictor of poor mental health. Those who work in inflexible work environments are more likely to report negative mental health, all else being equal. Being unable to work from home also contributes to poor mental health.
Those who get little meaning from their work are more likely to report negative mental health, all else being equal.
Those who feel their workplace, managers, and colleagues are not supportive are more likely to report negative mental health.
Office-based workers are more likely to report having negative mental health than those working in frontline, factory, on-site, or vehicle delivery jobs, all else being equal.
Demographic variables such as gender and age predict self-reported mental health. Women and younger workers are more likely to report negative mental health than men and older workers, all else being equal.
[1] Multivariate regression analysis allows us to control for a series of variables to understand the independent impact variables might have on reported mental health. This means that we may not find a direct relationship between two variables, but when they are all included in a model, a variable is found to predict the outcome. An example of this is workplace type.
When we compare, for example, where someone works and the incidence of reporting negative mental health, we don’t have a relationship. However, when we control for demographics, financial insecurity, and workplace conditions, we do find that working in an office increases the likelihood that someone will report negative mental health, all else being equal.
ABOUT ABACUS DATA
We are the only research and strategy firm that helps organizations respond to the disruptive risks and opportunities in a world where demographics and technology are changing more quickly than ever.
We are an innovative, fast-growing public opinion and marketing research consultancy. We use the latest technology, sound science, and deep experience to generate top-flight research-based advice to our clients. We offer global research capacity with a strong focus on customer service, attention to detail, and exceptional value.
We were one of the most accurate pollsters conducting research during the 2021 Canadian election following up on our outstanding record in 2019.
Leaves are changing, temperatures are dropping, and the spooky season is officially upon us. While some of us start to pull the long-lost sweaters out from the back of our closets, others are planning the perfect costume for Halloween night. With mask mandates no longer in effect, and Halloween night just around the corner, I was wondering how Canadians were feeling about venturing out and celebrating All Hallows’ Eve this Monday night.
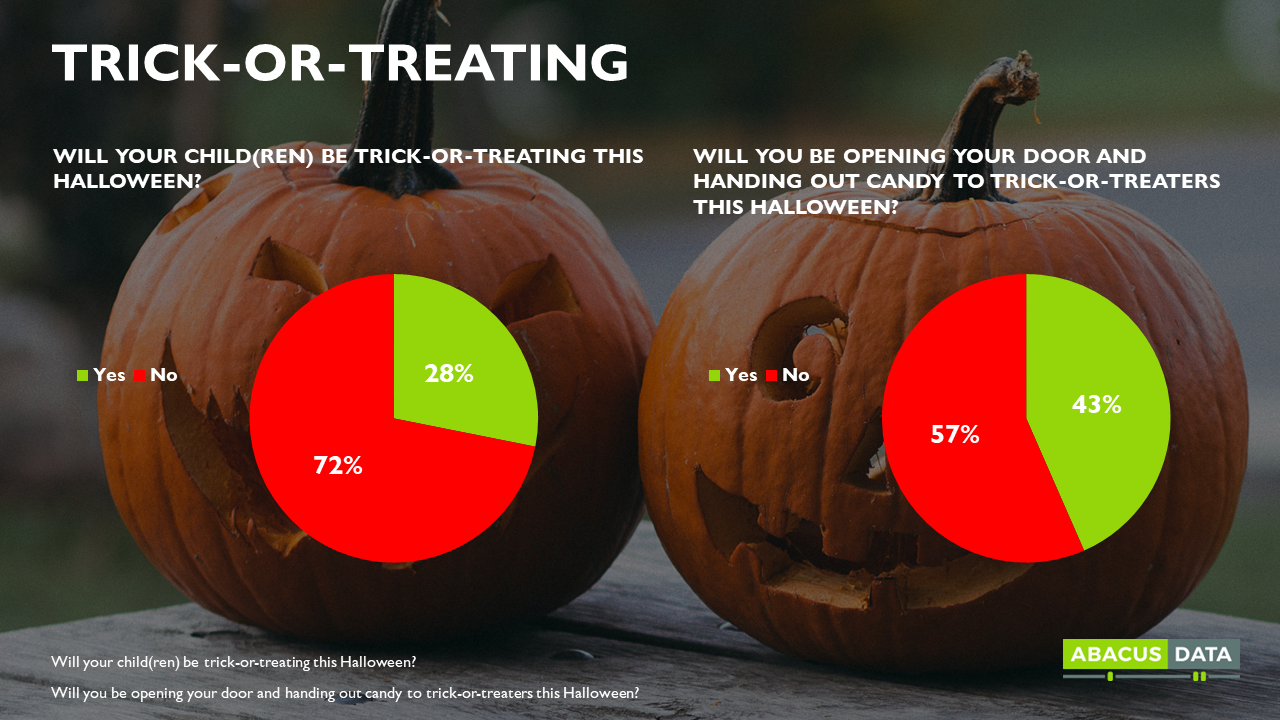
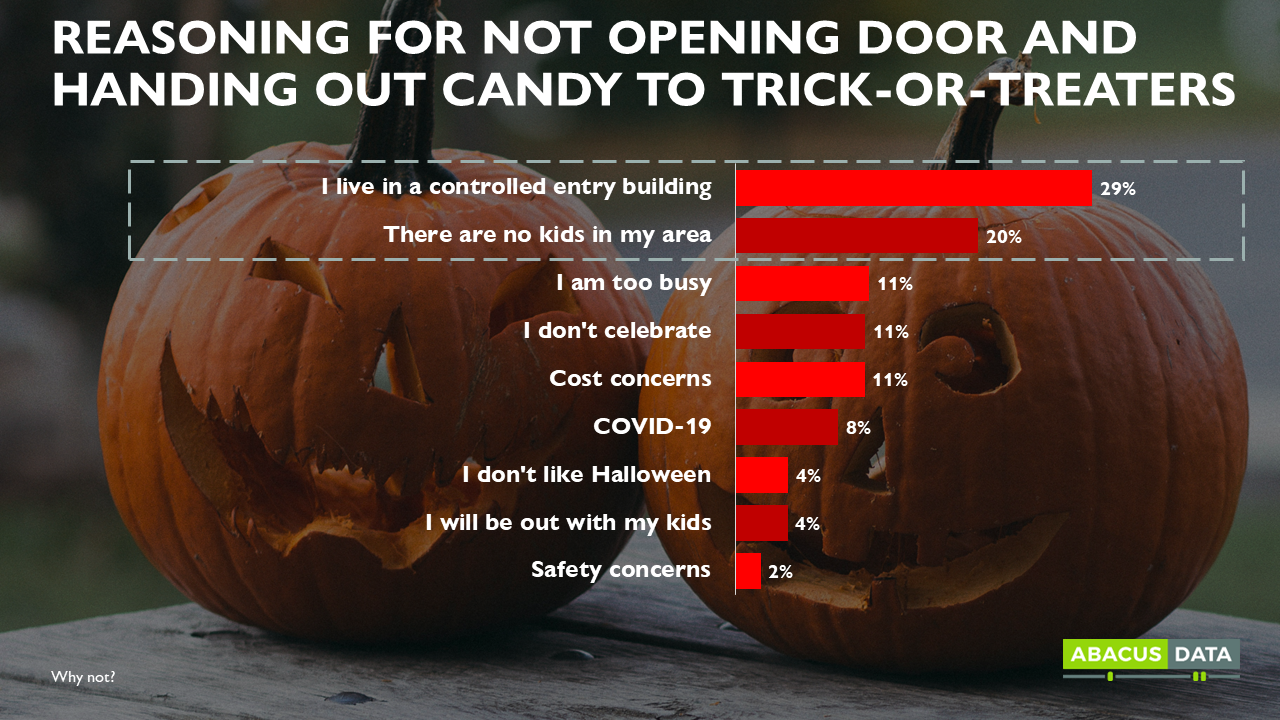
Our survey finds 28% of Canadian parents saying that their child(ren) will be trick-or-treating this Halloween. This number is lowest in SK/MB (8%) and QC (8%), and highest in ON (51%). Furthermore, 43% of adults in Canada will be opening their doors to hand out candy to trick-or-treaters this Halloween. Again, this number is lowest in SK/MB (8%) and highest in ON (43%).
The most common reasons for not handing out candy on Halloween night are living in a controlled entry building (29%) and having a lack of children in the area (20%). These were followed by being busy on Halloween night (11%), not celebrating the holiday (11%), and concerns over the cost of purchasing the candy (11%). Another 8% of Canadians will not be handing out candy due to the risks associated with Covid-19.
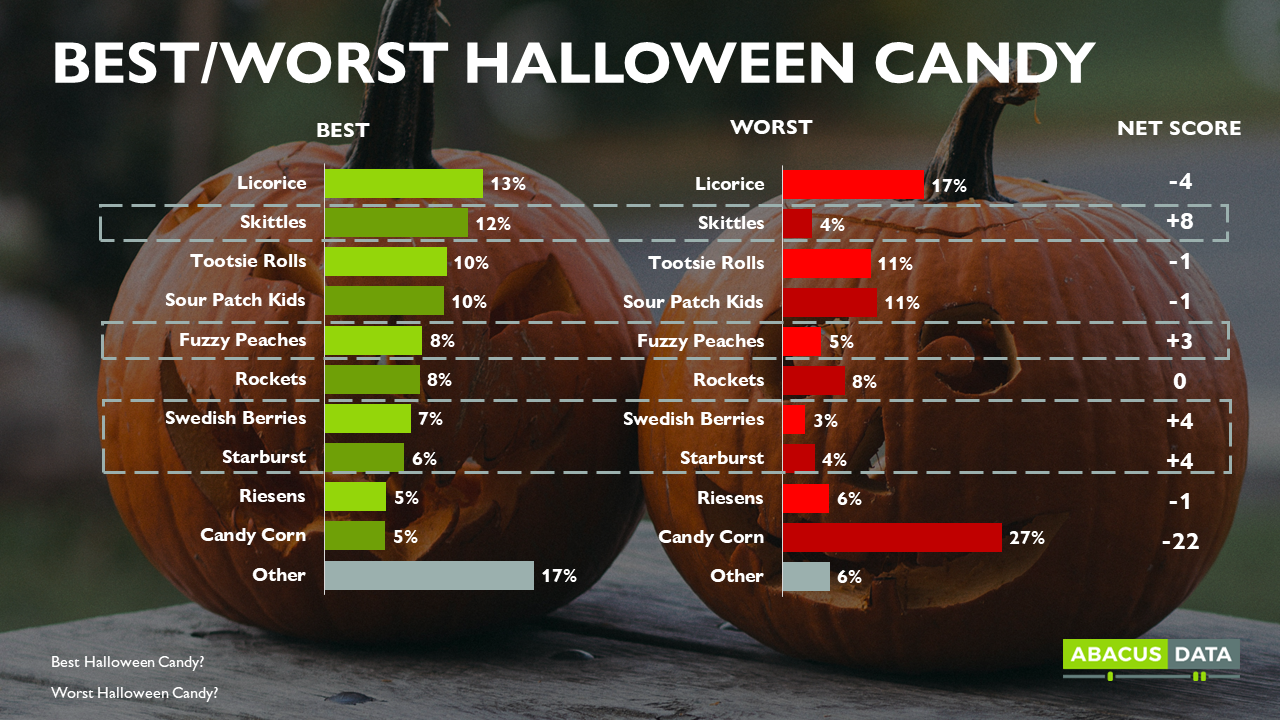
Wondering what to give out this Halloween so everyone leaves your front porch happy? Well, we asked Canadians what the best and worst Halloween candy is and assigned each candy a net promoter score (%Best – %Worst) to see how they compare. Skittles received the best score at +8. This was followed by Swedish Berries (+4), Starburst (+4), and Fuzzy Peaches (+3). The candies that received the lowest scores (and ones you should definitely hold off on handing out) include licorice (-4) and Candy Corn (-22).
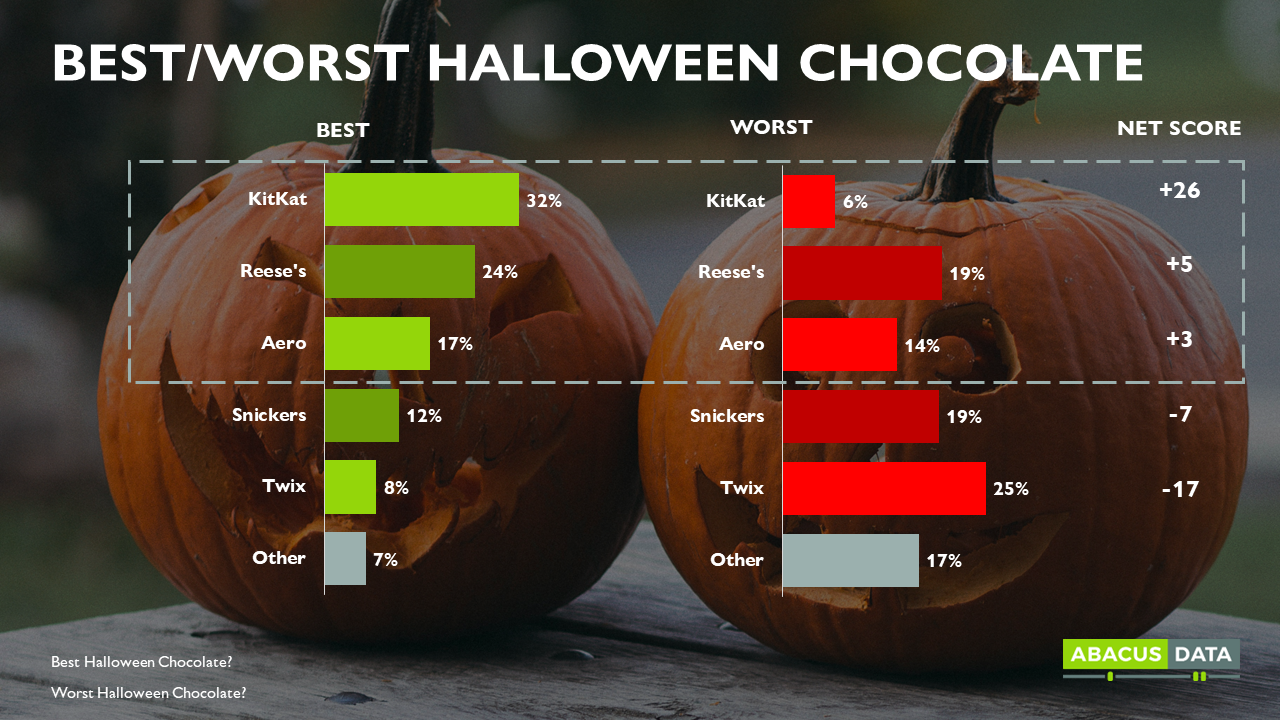
With that said, many of us would much prefer chocolate to candy, so we asked the same question with different chocolate bar options instead and found that Canadians overwhelmingly prefer KitKats to any other chocolate on Halloween night. When looking at their net promoter scores, it is evident that KitKats (+26), Reese’s (+5), and Aeros (+3) are the best options to avoid unhappy trick-or-treaters this Monday night. With that said, Snickers (-7) and Twix (-17) should probably be avoided.
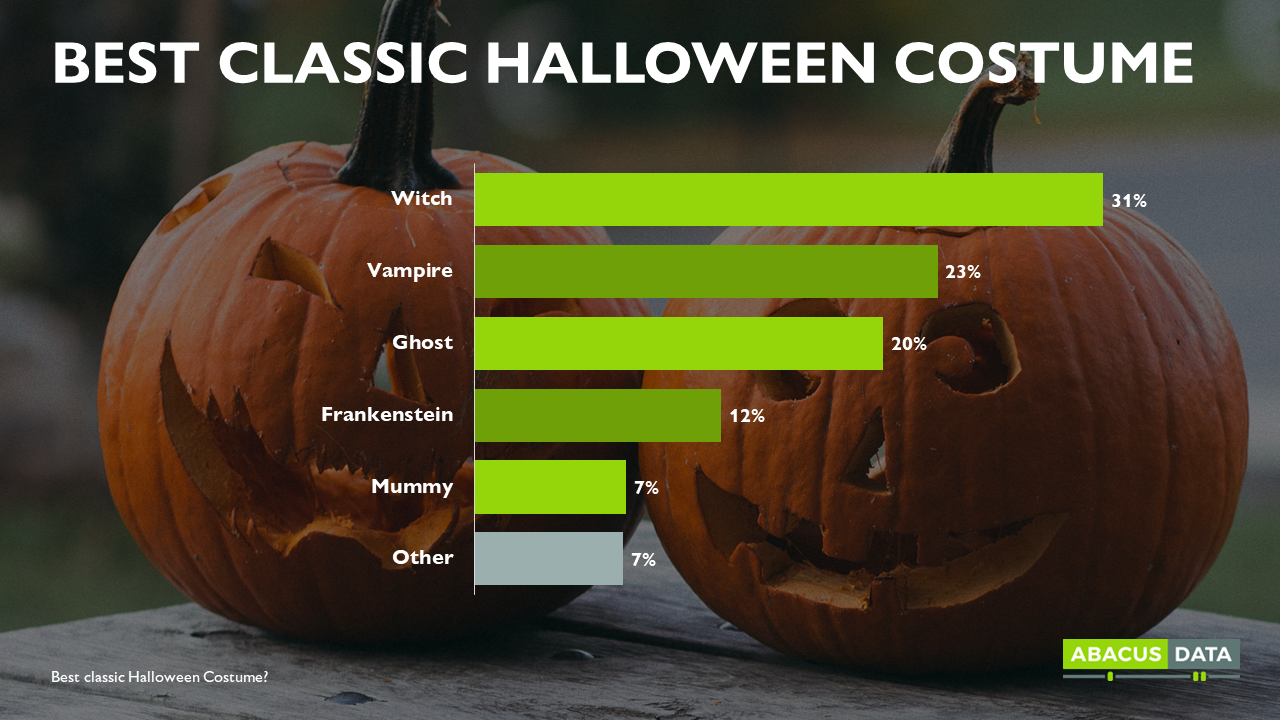
So now that we know what we are handing out, what can we expect to show up at our door? Well, Halloween costumes change so drastically from year to year that I wanted to go back to some of the classic Halloween costumes and see which Canadians felt were best to dress in for the occasion. As it turns out, Canadians believe dressing as a witch to be the best classic Halloween costume (31%). This was followed by a vampire (23%), a ghost (20%), and Frankenstein (12%).
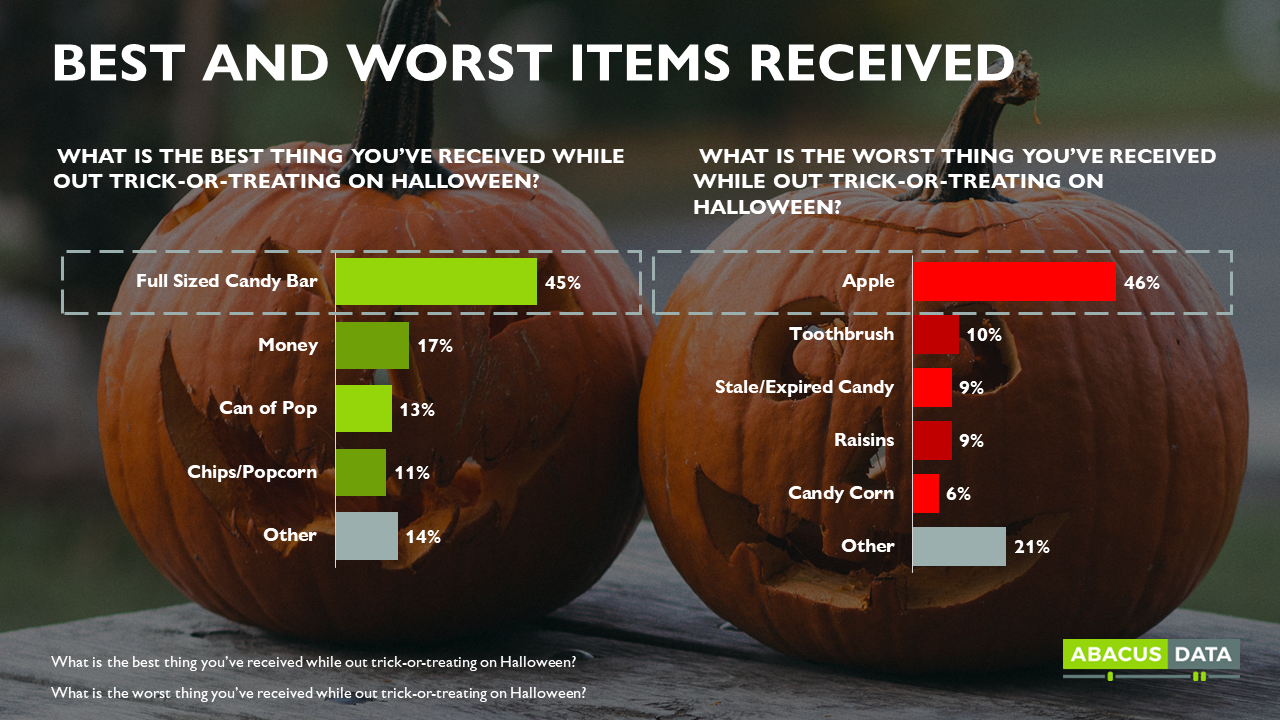
Thinking back on these classic Halloween costumes led me to remember some of the memorable things I had received throughout my years of trick-or-treating. This led me to wonder what other memorable things Canadians have been given on Halloween night. When asked what the best thing they have ever received on Halloween night was, 45% of Canadians said a full-sized chocolate bar. Interestingly, this was followed by 17% who said the best thing they have received was money and 13% who said a can of pop. On the flip side, apples (46%) top the list of worst things received on Halloween night followed by a toothbrush (10%) and stale/expired candy (9%).
METHODOLOGY
The survey was conducted with 1,500 Canadian adults from October 14 to 19, 2022. A random sample of panelists were invited to complete the survey from a set of partner panels based on the Lucid exchange platform. These partners are typically double opt-in survey panels, blended to manage out potential skews in the data from a single source.
The margin of error for a comparable probability-based random sample of the same size is +/- 2.53% 19 times out of 20.
The data were weighted according to census data to ensure that the sample matched Canada’s population according to age, gender, educational attainment, and region. Totals may not add up to 100 due to rounding.
ABOUT ABACUS DATA
We are the only research and strategy firm that helps organizations respond to the disruptive risks and opportunities in a world where demographics and technology are changing more quickly than ever.
We are an innovative, fast-growing public opinion and marketing research consultancy. We use the latest technology, sound science, and deep experience to generate top-flight research-based advice to our clients. We offer global research capacity with a strong focus on customer service, attention to detail, and exceptional value.
We were one of the most accurate pollsters conducting research during the 2021 Canadian election following up on our outstanding record in 2019.
 Although provincial governments and health authorities have not yet suggested any limitations to holiday gatherings this season, there is a sizeable minority concerned about the risks.