Conservatives keep 8-point lead nationally. Liberal support drops in Quebec by 5 points in 3 weeks.
From February 9 to 18, 2023, Abacus Data conducted a nationally representative survey of 4,000 Canadian adults. The survey asked several questions about the political landscape that we track as part of our regular national omnibus surveys.
Here’s what we found:
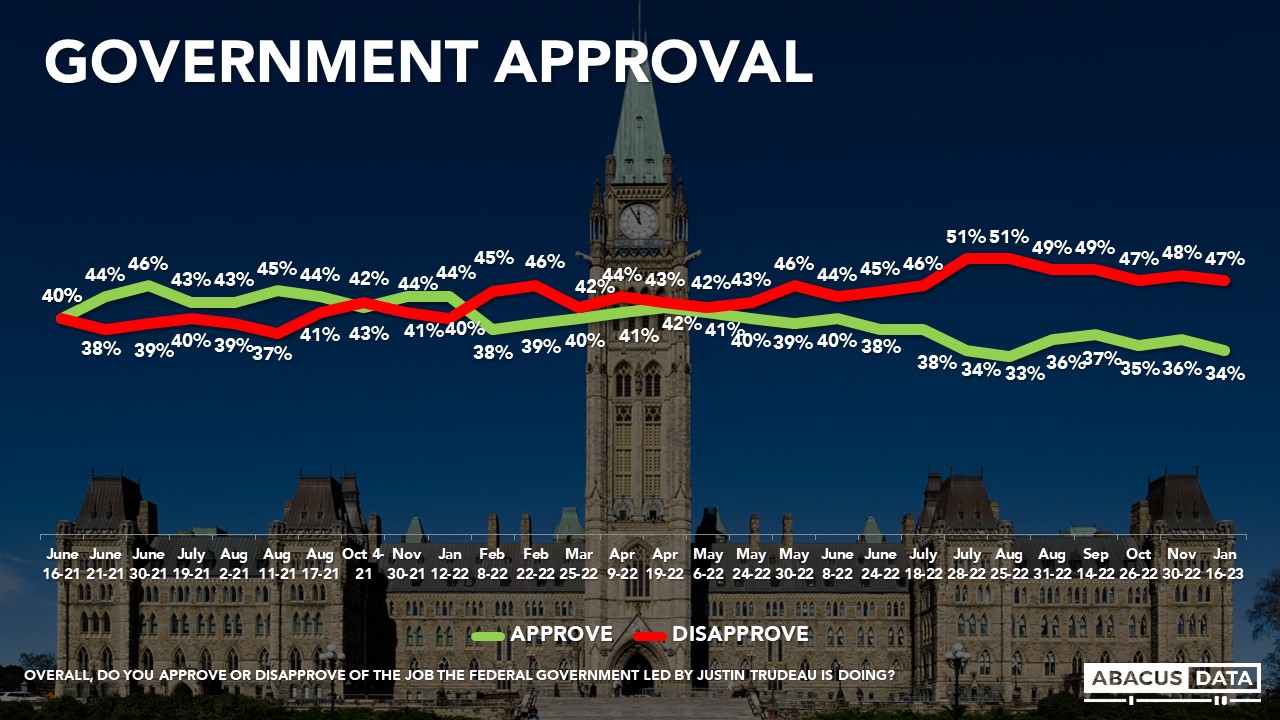
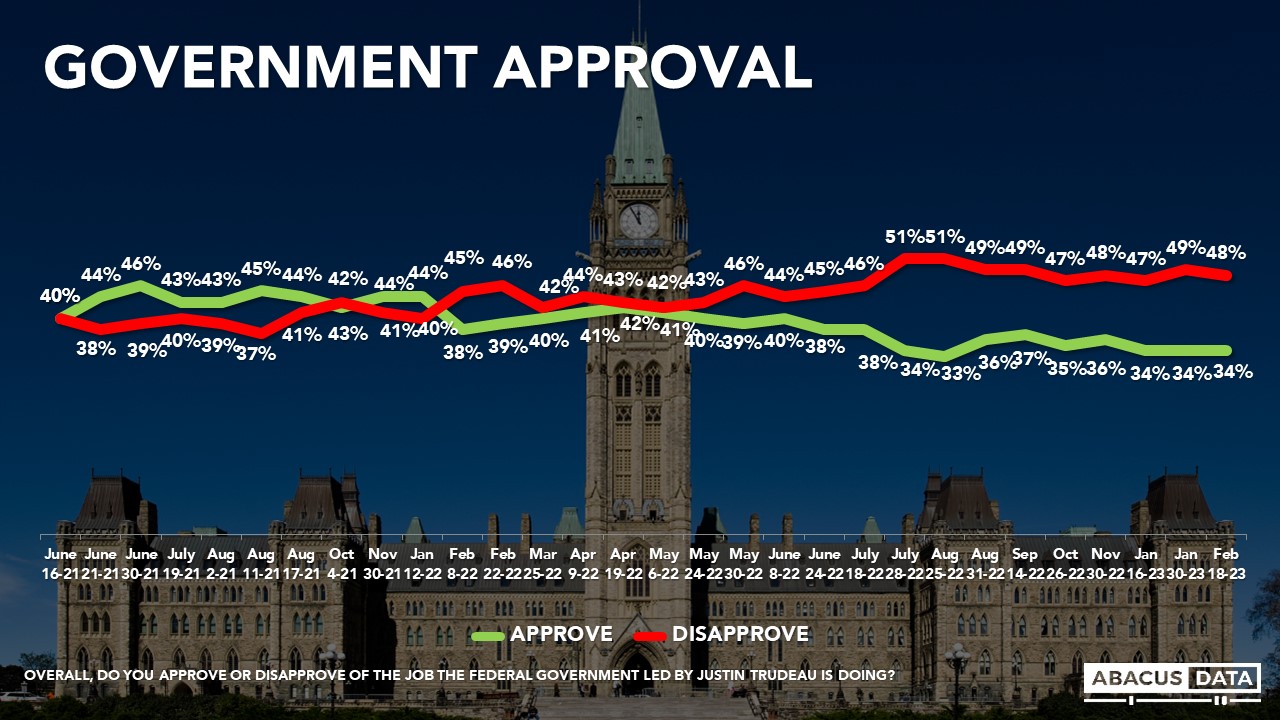
Today, 34% approve, and 49% disapprove of the performance of the federal government, a one-point drop in disapproval since the end of January. Disapporval of the government has hovered between 47% and 51% since the summer of 2022.
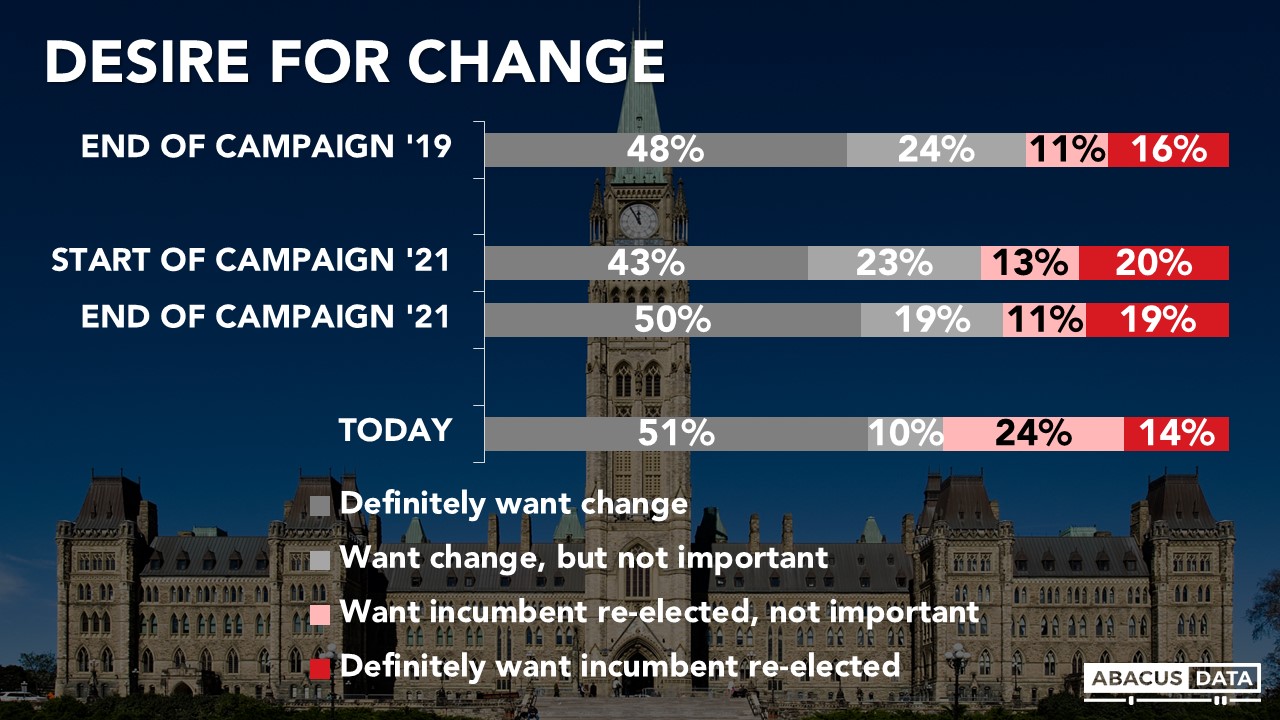
The desire for change is holding steady and is in line with the end of the 2021 campaign, although those wanting to see the Liberals re-elected are down 6 points compared with the end of the 2021 campaign. 51% of Canadians definitely want a change of government while 13% definitely want the Liberals re-elected.

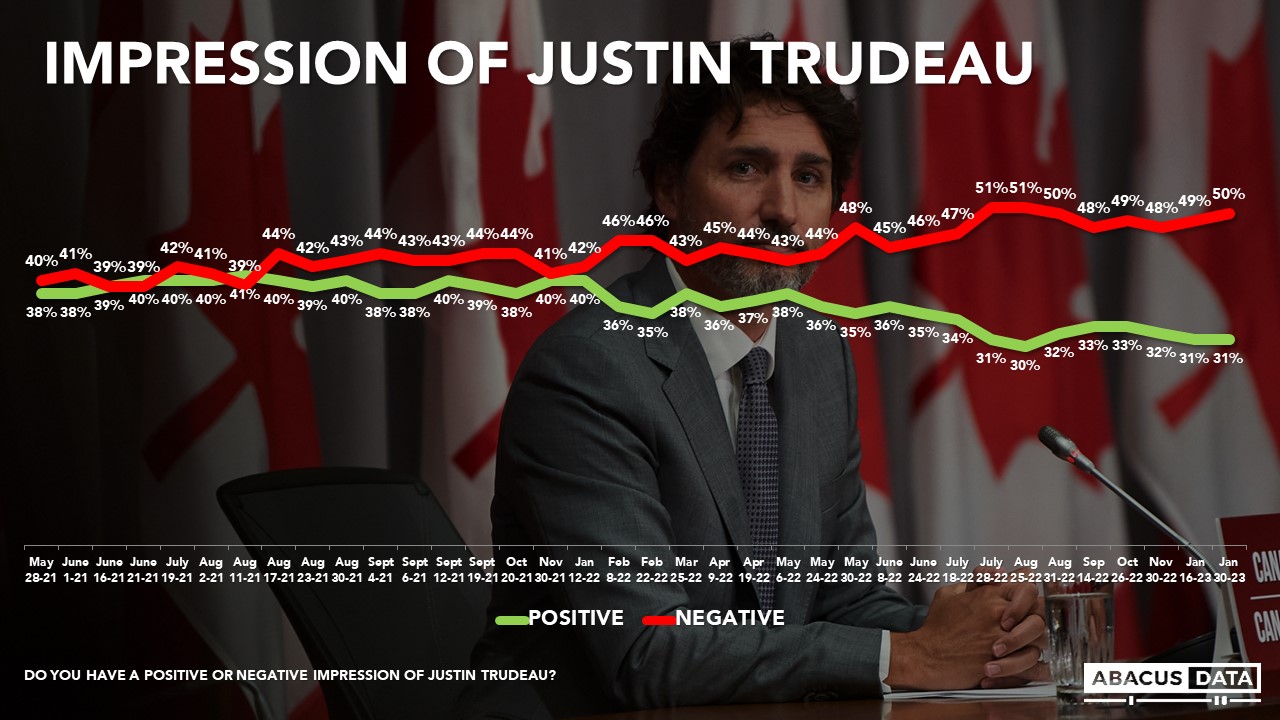
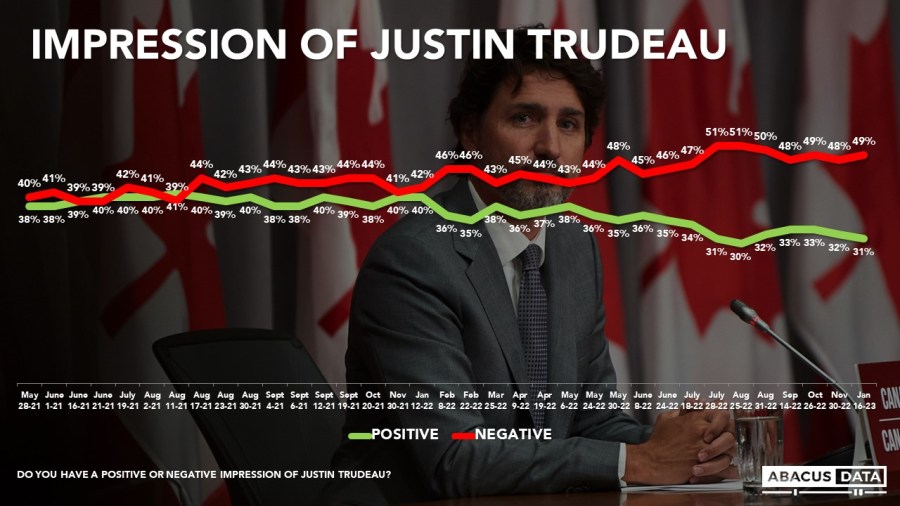
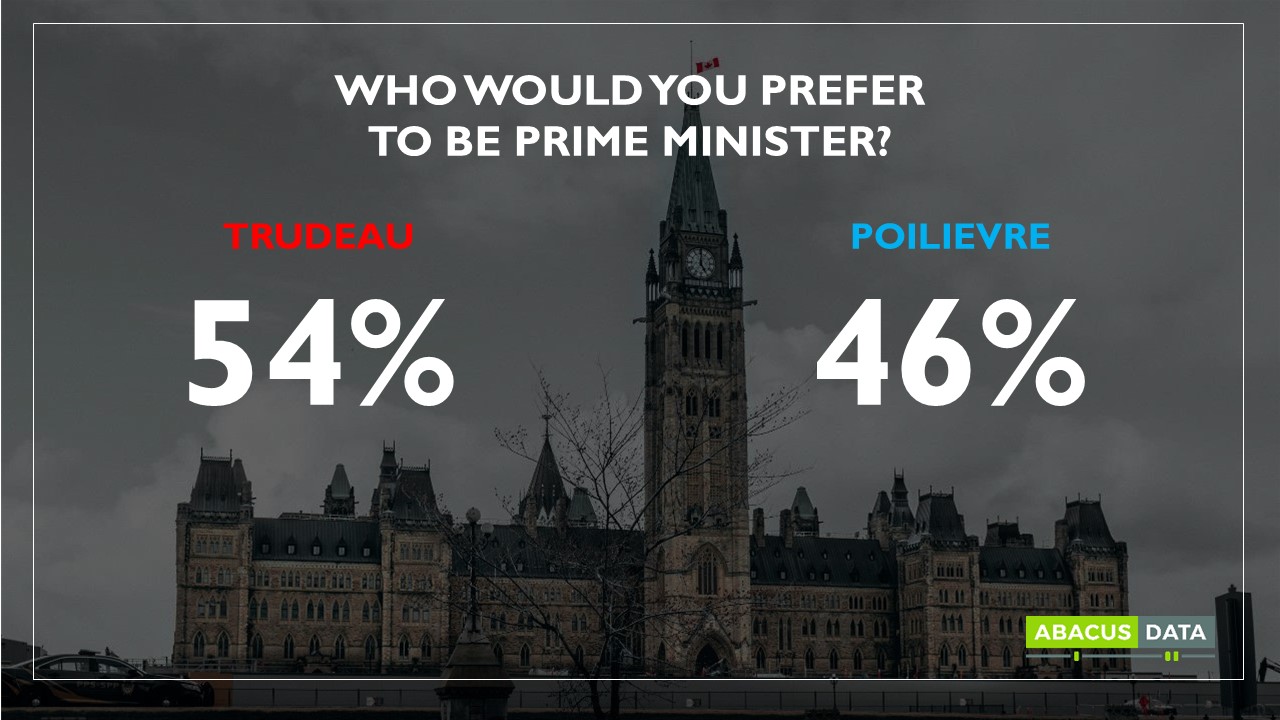
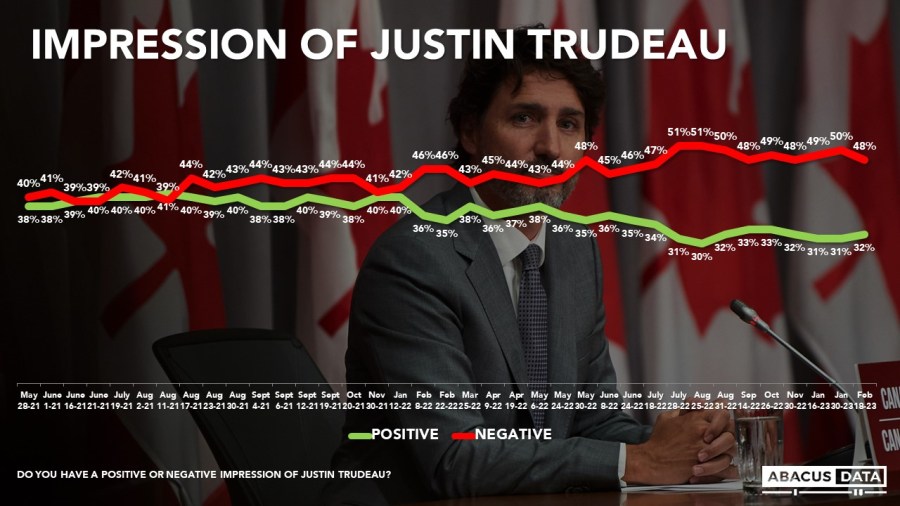
Public feelings about Prime Minister Trudeau have remained relatively stable over the past few months. Today, the Prime Minister’s net favourable rating is -16 with 32% having a positive impression and 48% having a negative impression of him. Among Liberal supporters, his net rating is +73.
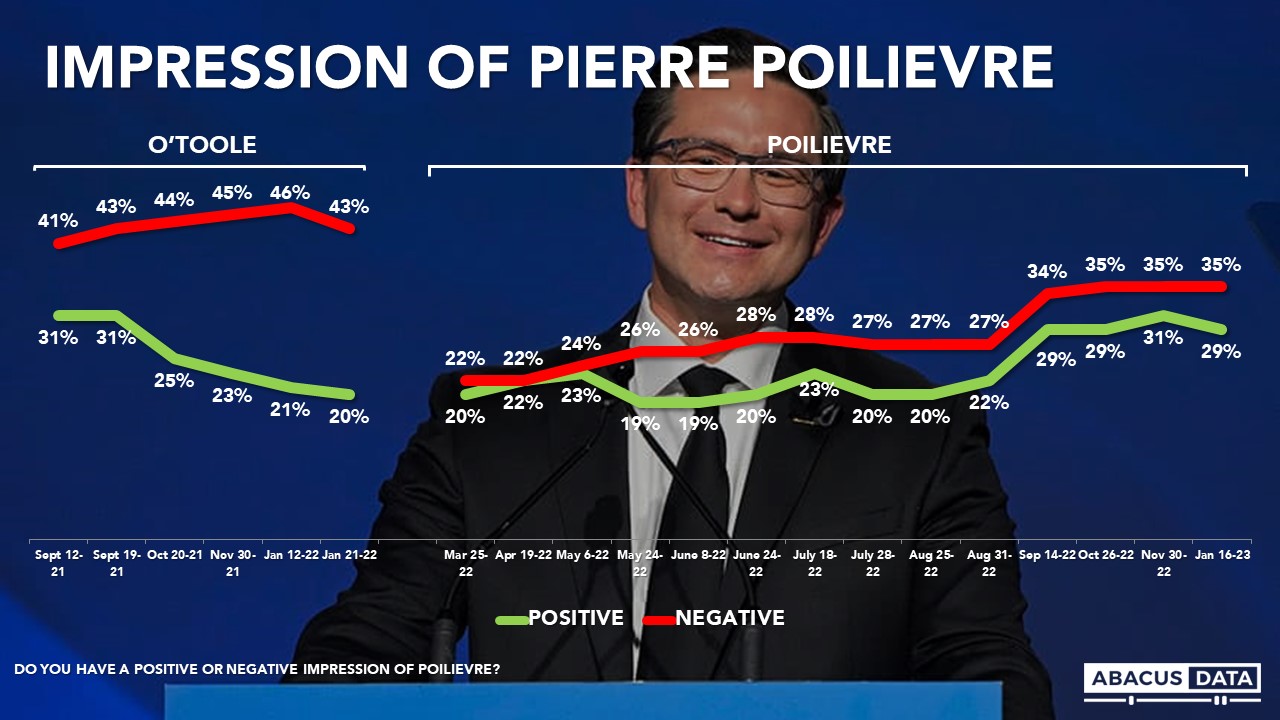
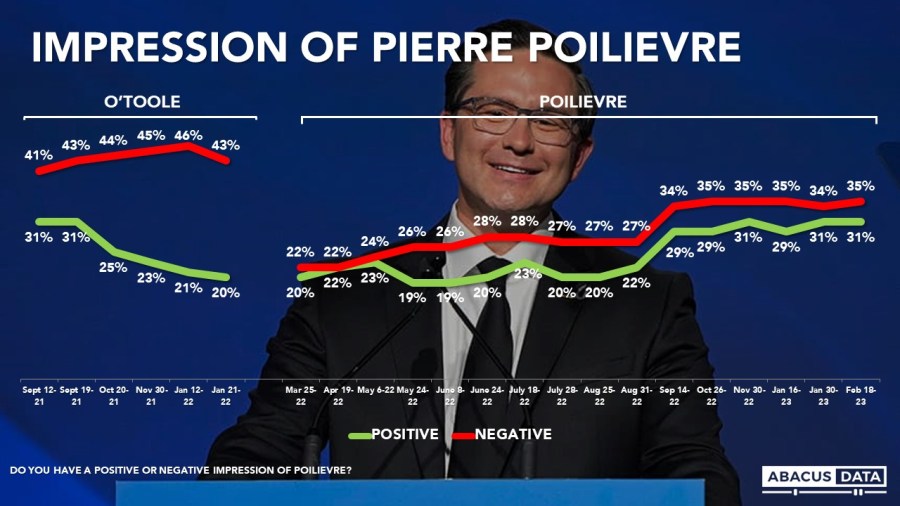
Over the past month, impressions of Pierre Poilievre have not changed much. His negatives are up a single point while his positives are steady. His net favourable rating is -4. Among Conservative supporters, his net rating is +71.
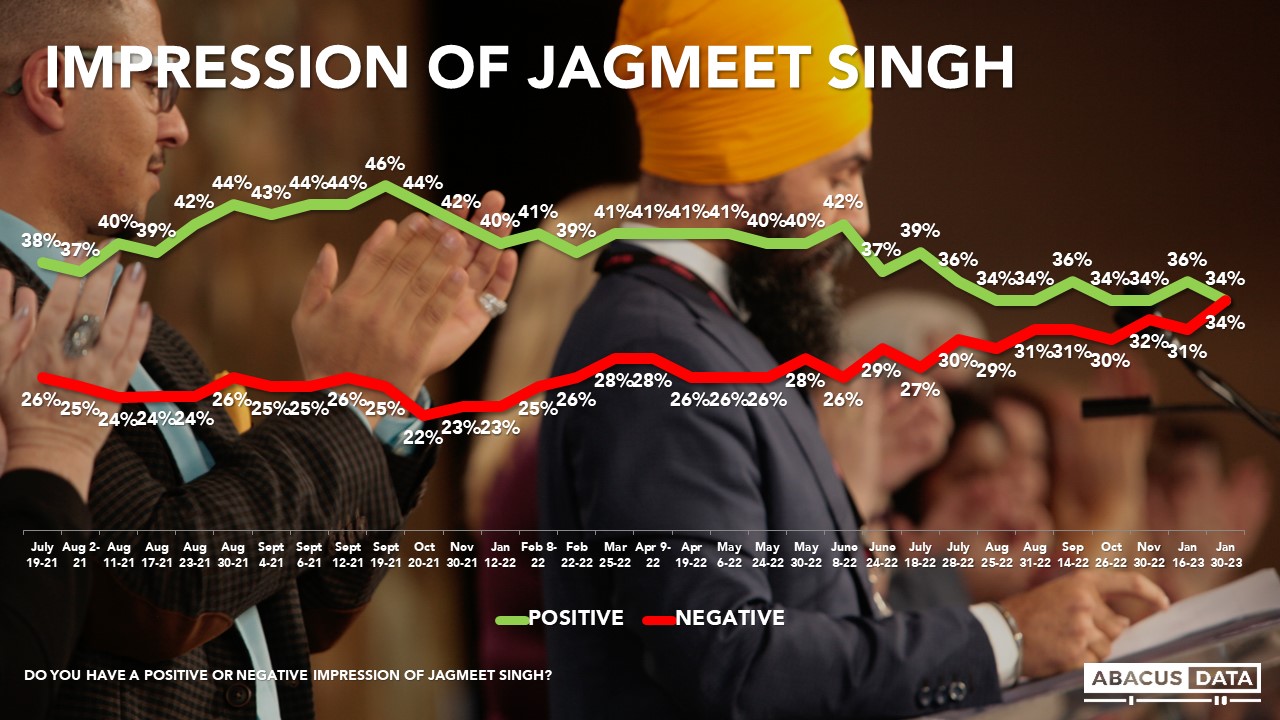
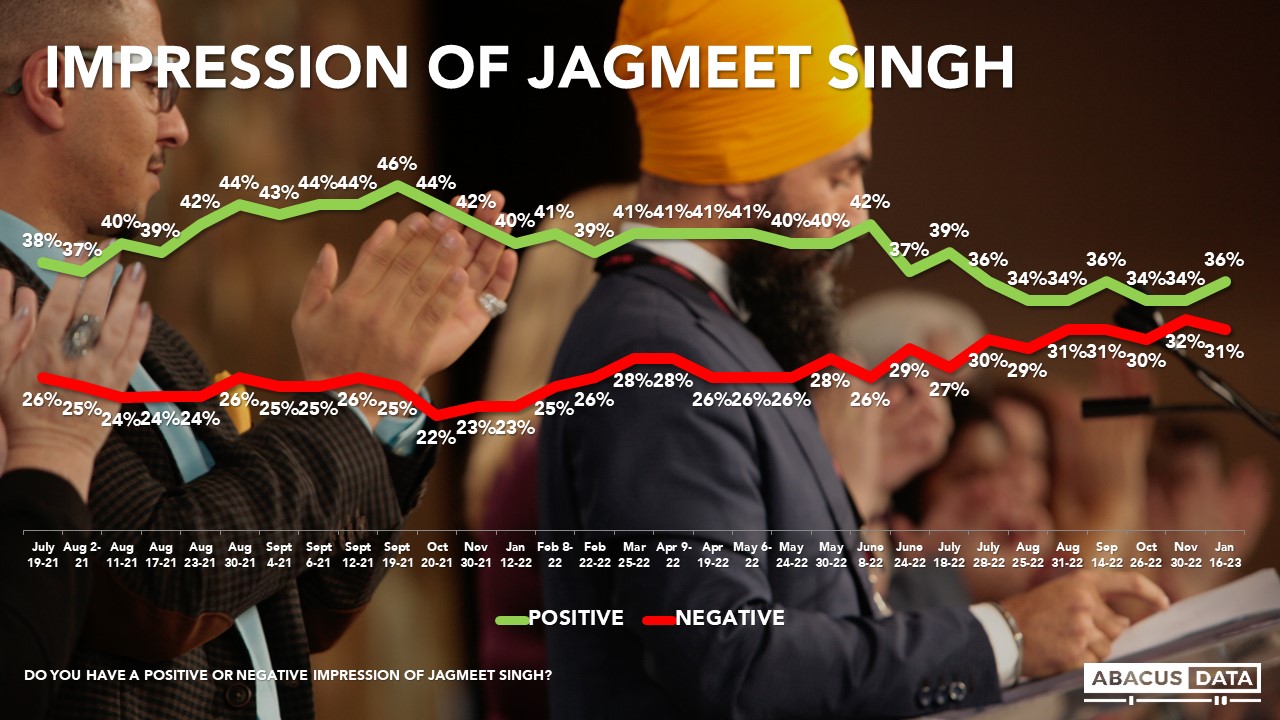
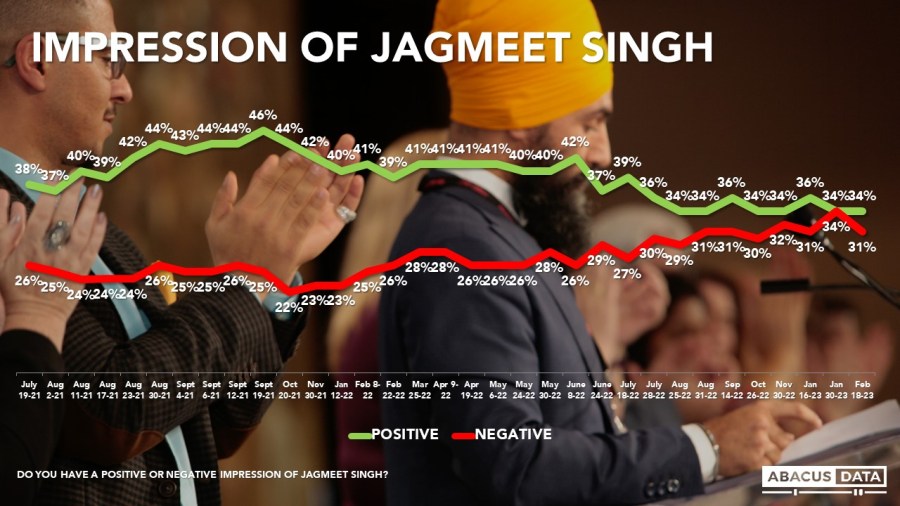
Jagmeet Singh’s negatives are down three since last month with 34% having a positive impression of him and 31% having a negative view. His net favourable is +3 nationally and +80 among NDP supporters.
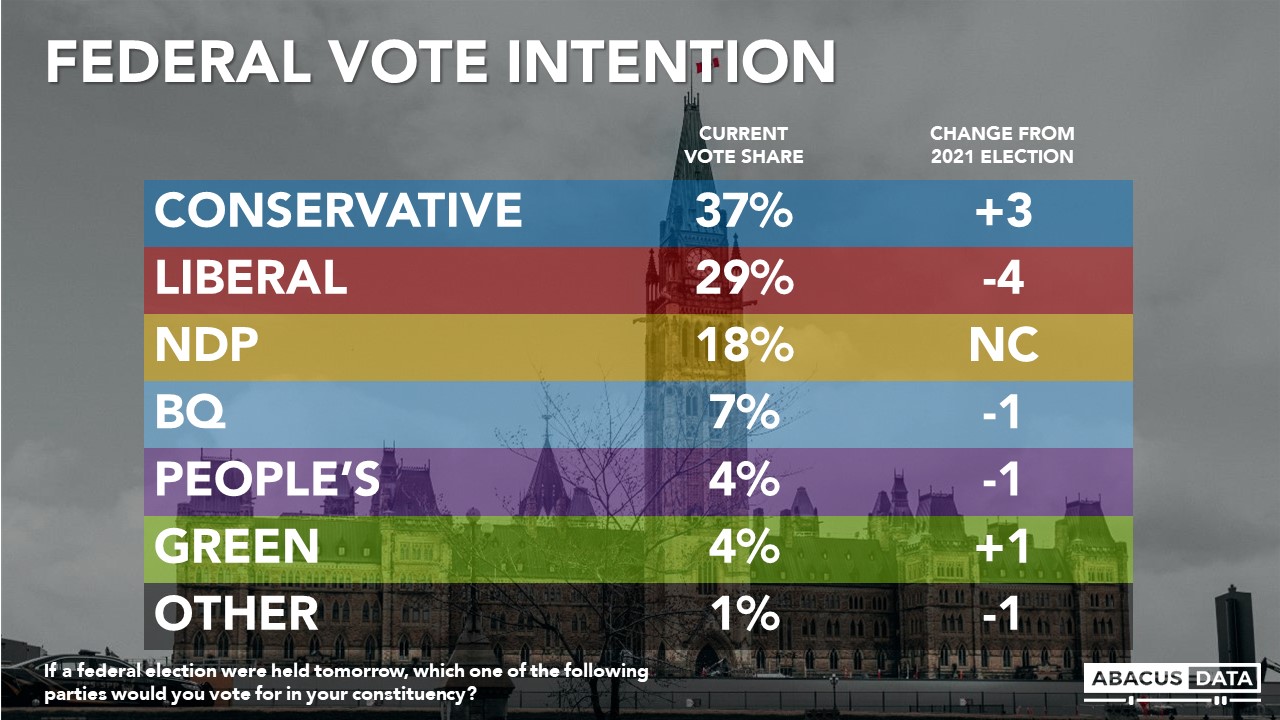
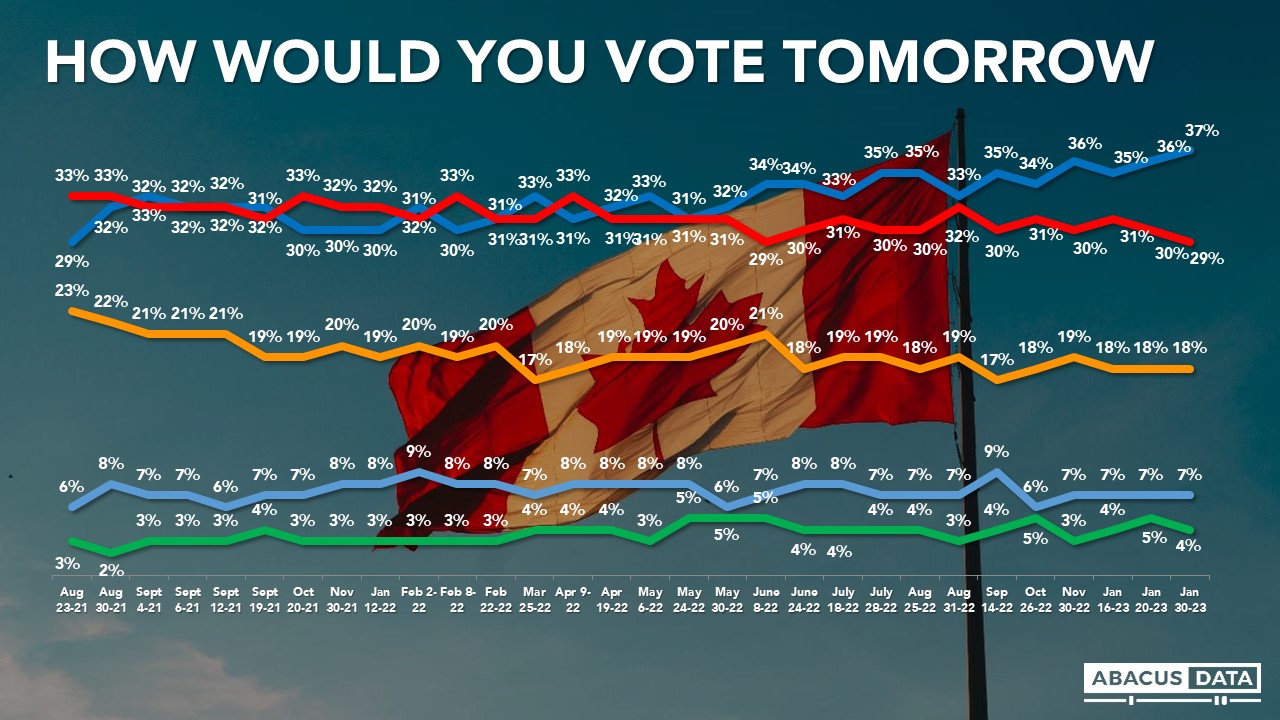
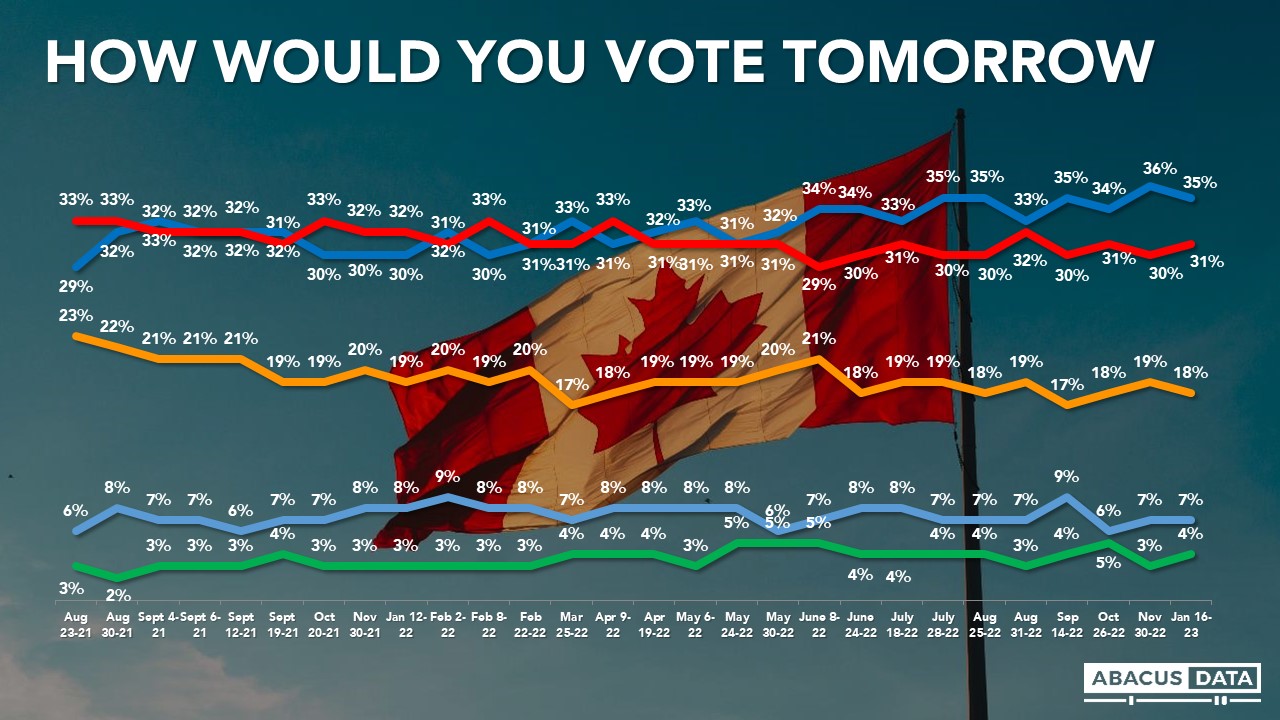
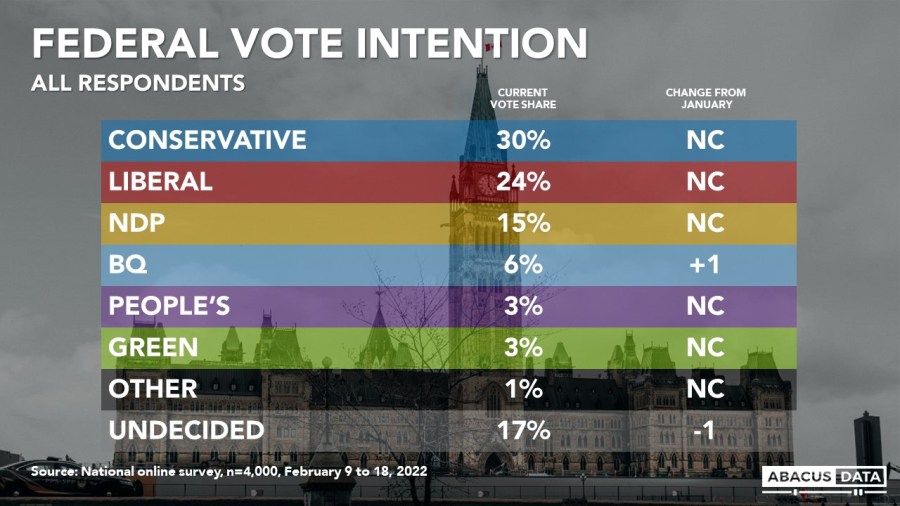
FEDERAL VOTE INTENTION
As a way of capturing any shifts towards the undecided category, we are now reporting vote intention with and without undecided voters.
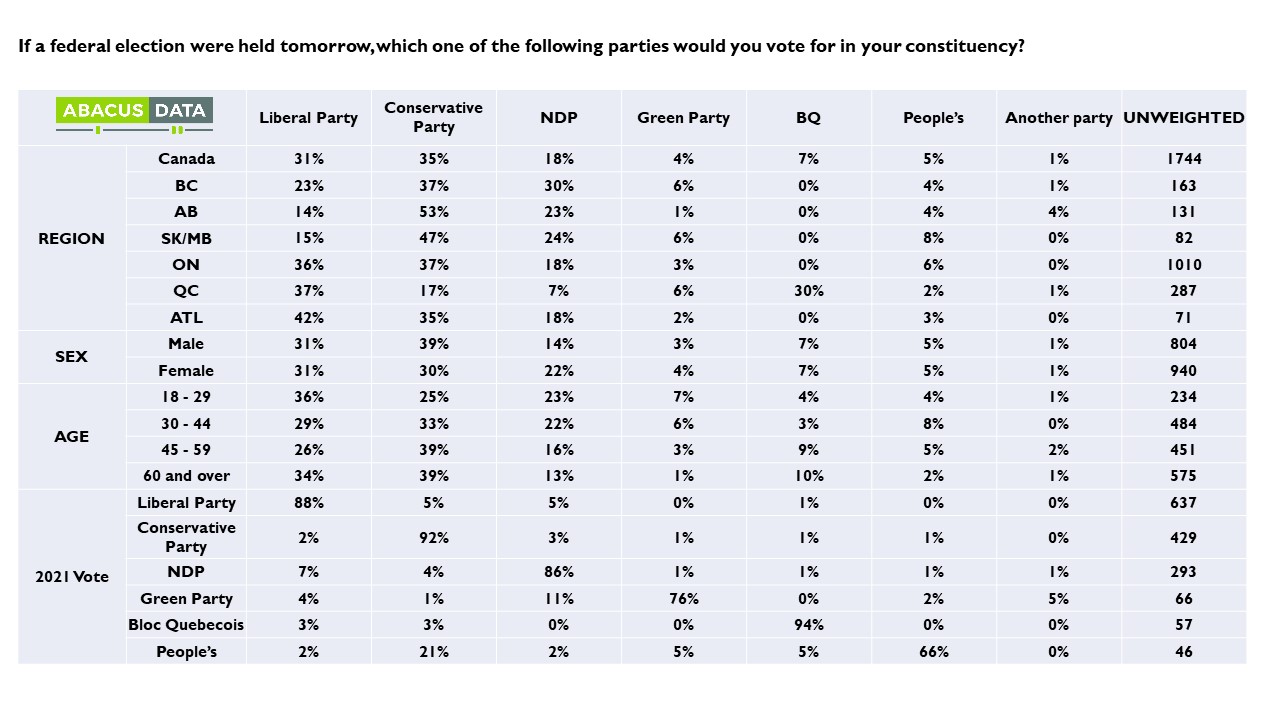
Among all Canadians, 30% would vote Conservative, 24% Liberal, 15% NDP, and 6% from the BQ. 17% say they are undecided.
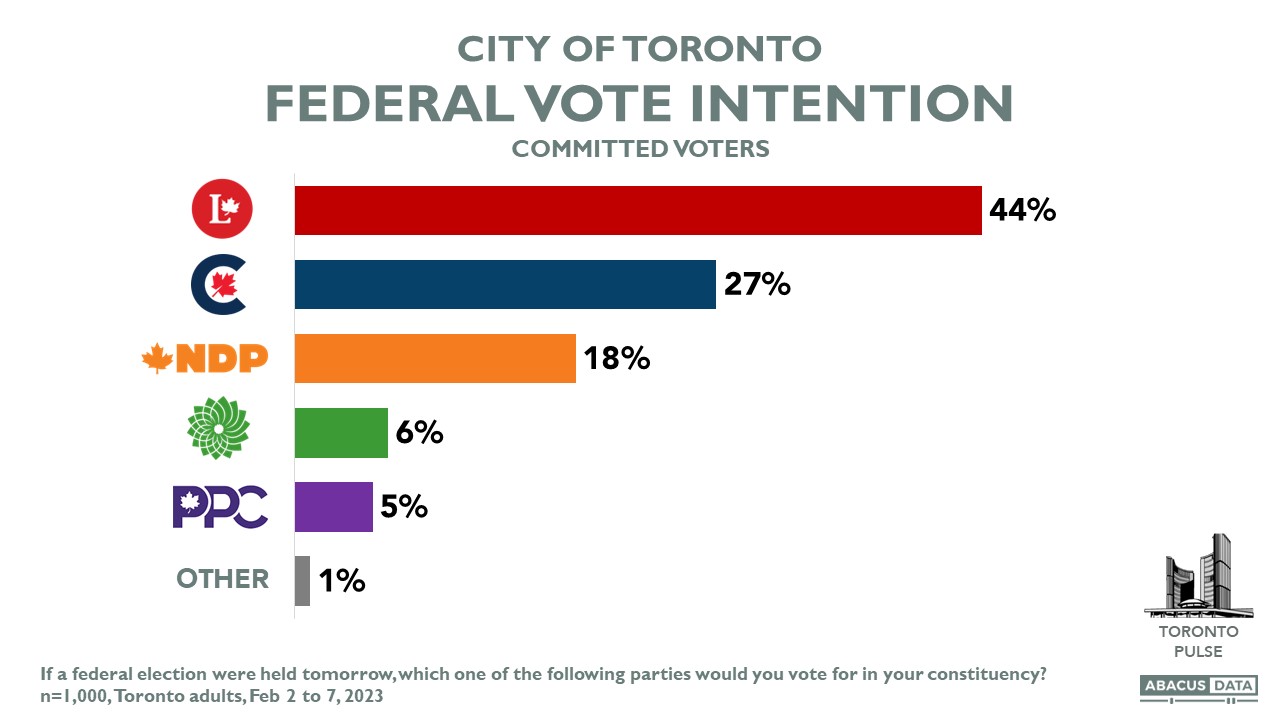
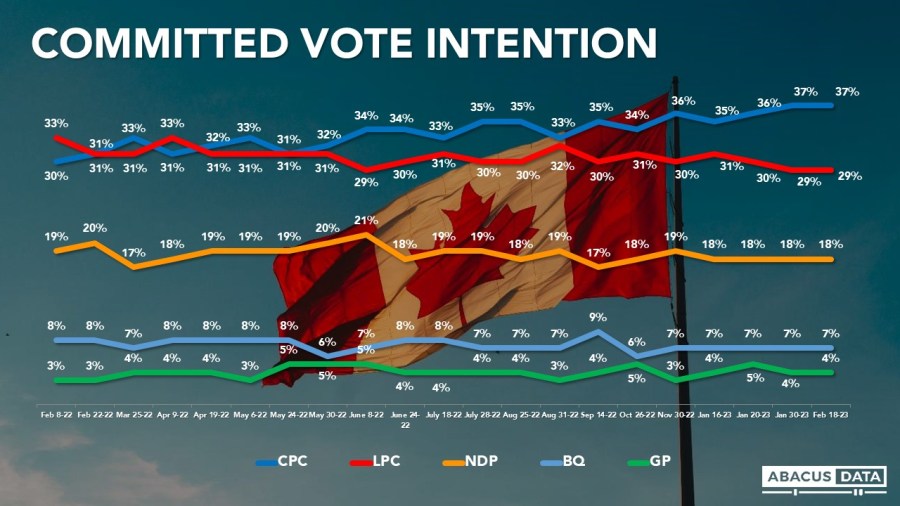
If an election were held today, among committed voters, 37% would vote for the Conservative Party (unchanged from last month), 29% for the Liberal Party (down 2), 18% for the NDP and 7% for the BQ. These numbers are the exact same as our last poll at the end of January.
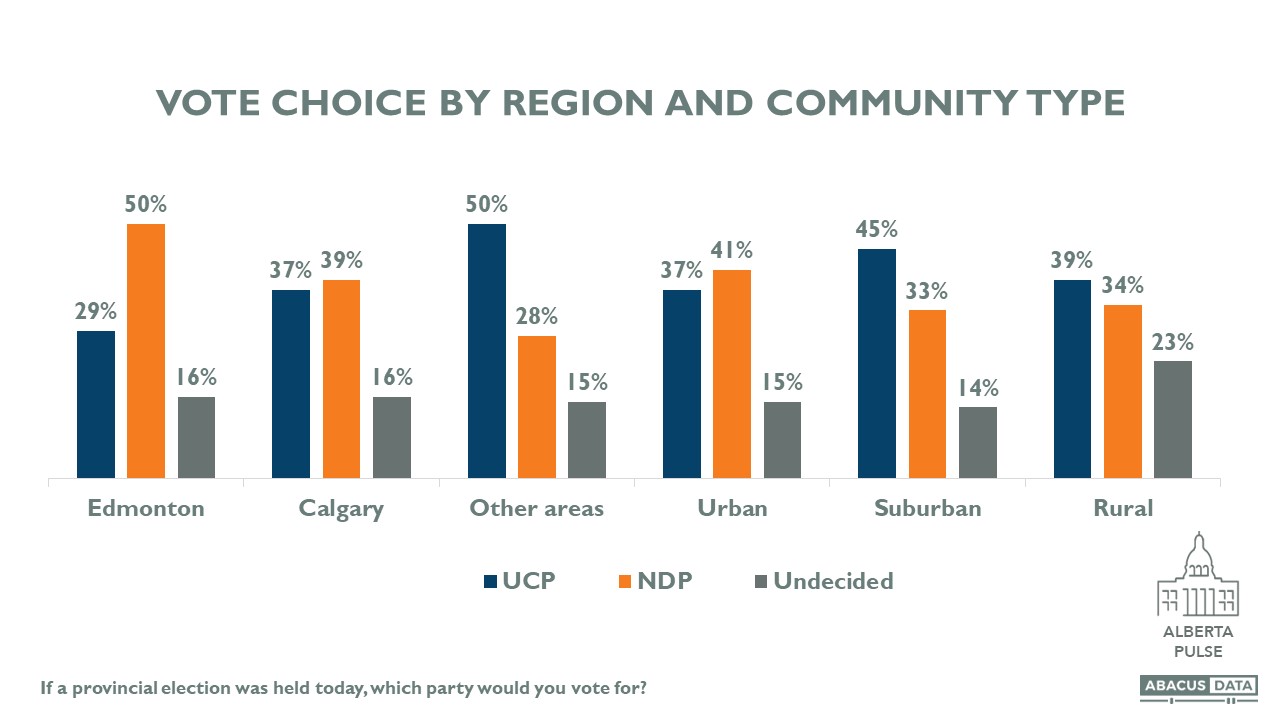
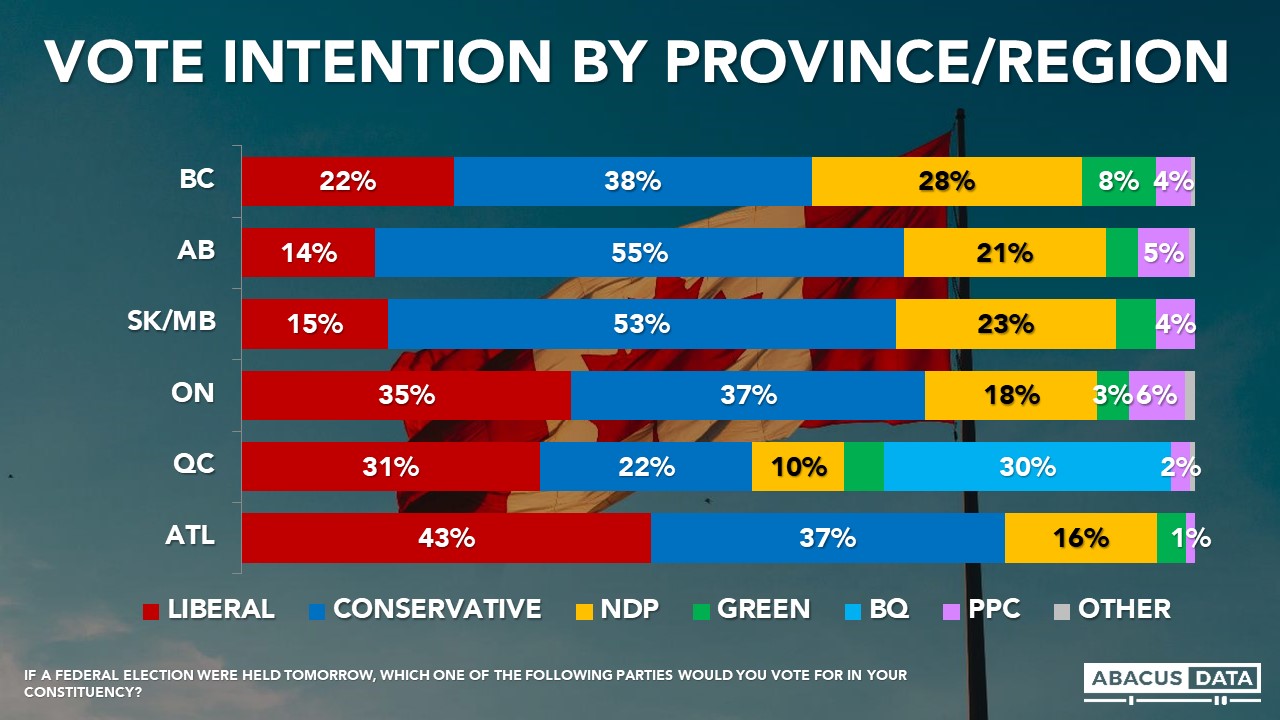
The Conservatives are ahead in British Columbia, Alberta, Saskatchewan, and Manitoba. The Conservatives also have a small 3-point advantage in Ontario. In Quebec, the BQ is slightly ahead of the Liberals, although the Liberal vote has dropped over the past few weeks. Compared with the end of November 2022, Liberal support in Quebec is down 6 points and it is down 5 points since the end of January.

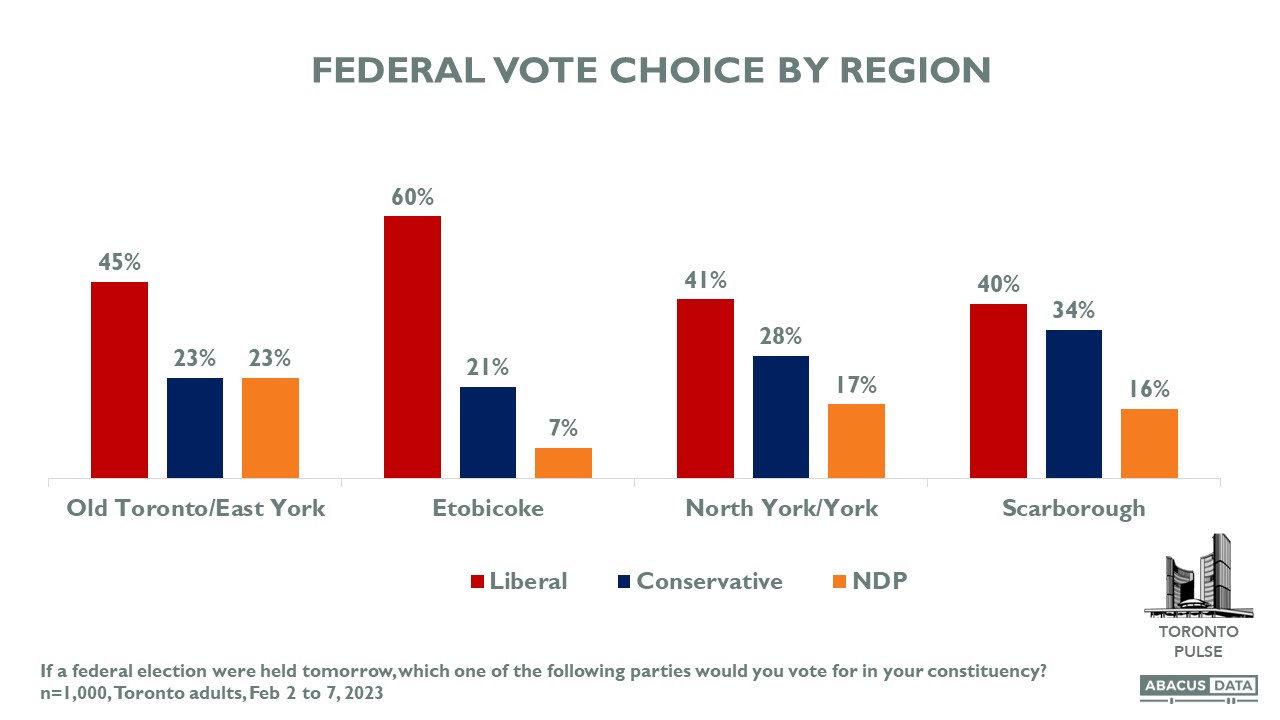
Looking at the largest urban regions in the country, the Liberals have a clear lead in Metro Toronto and are statistically tied with the Conservatives in the Greater Toronto and Hamilton region (not including the City of Toronto). The Conservatives have an 11-point lead in Metro Vancouver.
In Quebec, the Liberals are well ahead on the Island of Montreal and in Laval, but trail the BQ by 20-points in the communities surrounding Montreal (north and south shores).

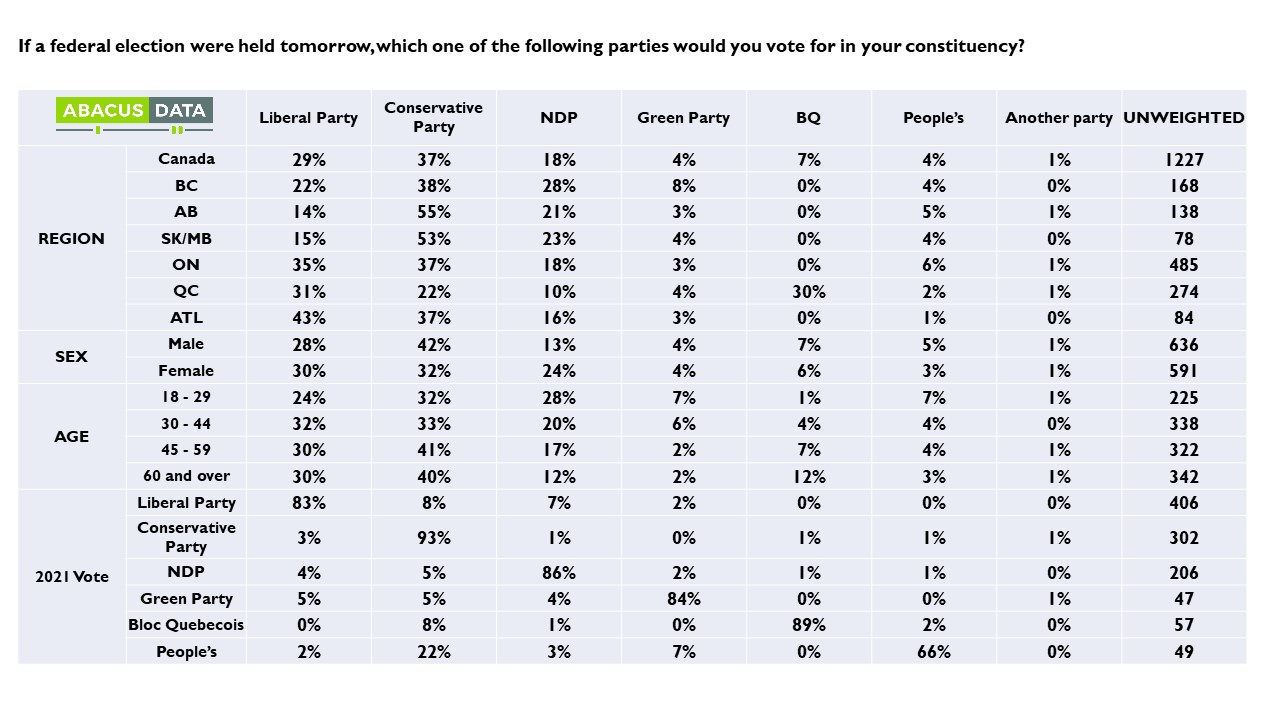
When we compare current vote intention with reported vote in the last election, we can categorize Canadians into three categories – loyalists, switchers, and reluctants. Loyalists voted for the party in 2021 and say they will vote for the party now. Switchers voted for the party in 2021 but now say they would vote for another party. Reluctants voted for the party in 2021 but now say they are undecided.
When we compare the six main parties, we find that the Conservative Party is holding together its previous support the most (86% of past CPC supporters are staying with the CPC) while the People’s Party has lost almost half of its 2021 support to either another party (mainly the Conservatives) or to the undecided category.
The Liberals are holding about 3 in 4 of its past voters but have lost 14% to another party and 10% to the undecided group.
The Conservatives lead nationally because they are holding their 2021 coalition together the best and have gained support from other parties across the spectrum. Looking at the Conservative Party’s current support group – 78% are past Conservative supporters, 5% voted PPC last election, 4% are Liberal switchers, 2% come from the NDP and 1% are from the BQ. The remaining 10% say they didn’t vote in the 2021 election.

UPSHOT
 According to David Coletto: “The overall political opinion environment hasn’t changed much over the past three weeks. The Conservatives continue to hold a lead nationally in our tracking – the largest the party has held since the 2015 election. In Quebec, Liberal support is down 5 points over the same period. If this persists, the path to re-election for the Liberals is far more daunting.
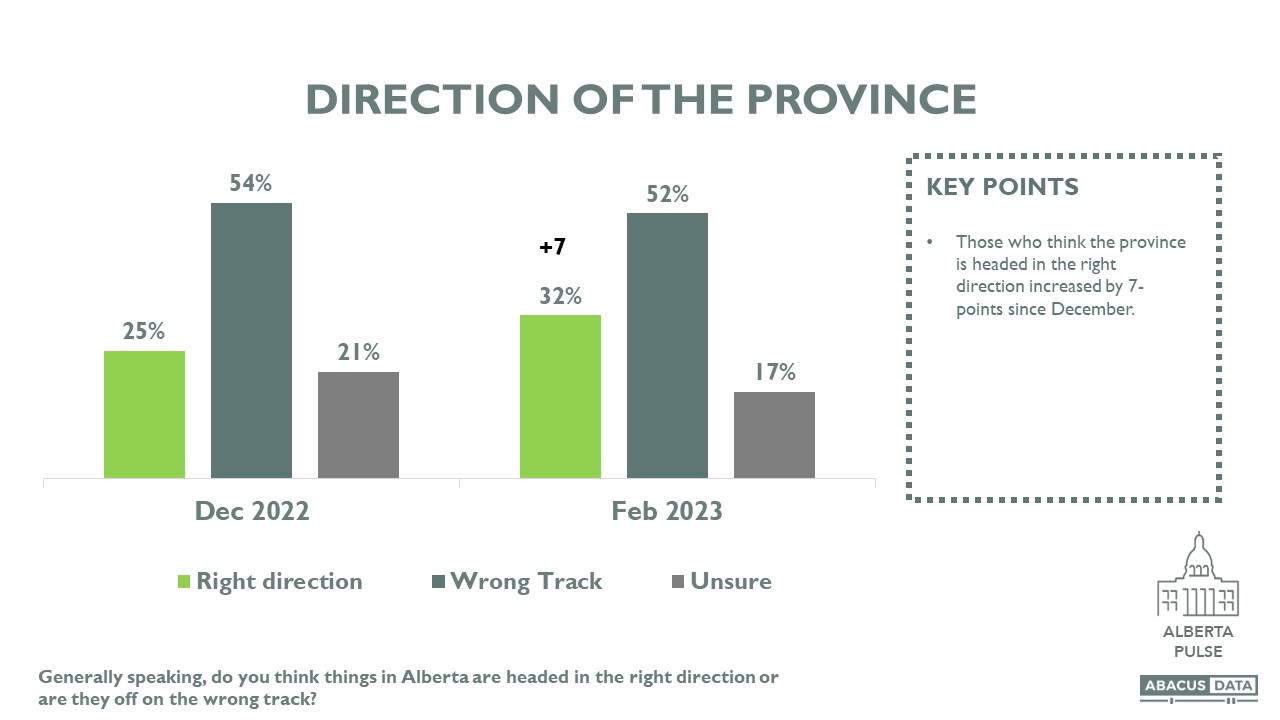
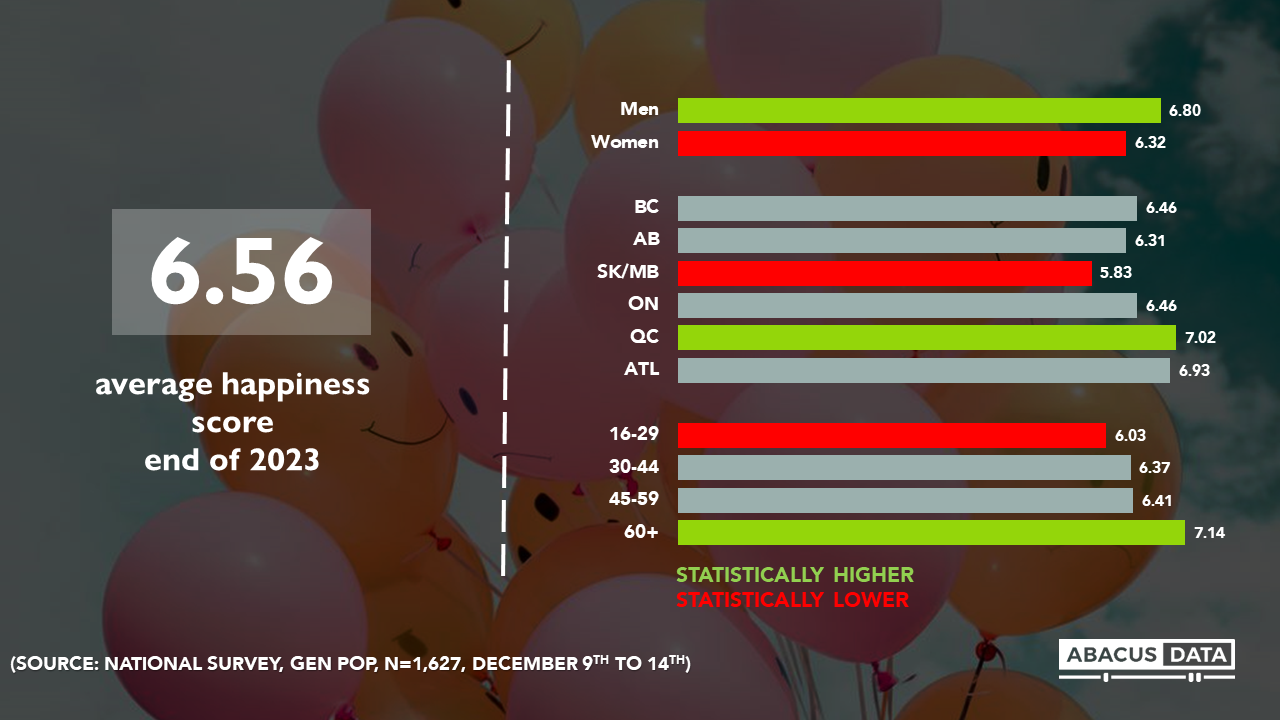
Despite some changes in regional vote intentions, the core indicators are all constant and unchanged including impressions of the leaders, approval of the government, and the overall mood of the country.
Stay tuned for some additional analysis on the broader mood of Canadians to be released with my colleague Richard Jenkins tomorrow.”
METHODOLOGY
The survey was conducted with 4,000 Canadian adults from February 9 to 18, 2023. A random sample of panelists were invited to complete the survey from a set of partner panels based on the Lucid exchange platform. These partners are typically double opt-in survey panels, blended to manage out potential skews in the data from a single source.
The margin of error for a comparable probability-based random sample of the same size is +/- 1.6%, 19 times out of 20.
The data were weighted according to census data to ensure that the sample matched Canada’s population according to age, gender, educational attainment, and region. Totals may not add up to 100 due to rounding.
This survey was paid for by Abacus Data Inc.
Abacus Data follows the CRIC Public Opinion Research Standards and Disclosure Requirements that can be found here: https://canadianresearchinsightscouncil.ca/standards/
ABOUT ABACUS DATA
We are the only research and strategy firm that helps organizations respond to the disruptive risks and opportunities in a world where demographics and technology are changing more quickly than ever.
We are an innovative, fast-growing public opinion and marketing research consultancy. We use the latest technology, sound science, and deep experience to generate top-flight research-based advice to our clients. We offer global research capacity with a strong focus on customer service, attention to detail, and exceptional value.
We were one of the most accurate pollsters conducting research during the 2021 Canadian election following up on our outstanding record in 2019.
Contact us with any questions.
Find out more about how we can help your organization by downloading our corporate profile and service offering.