A Tepid Economic Temperature: Is Class Conflict Coming to Canada?
May 1, 2017
Over the years, we’ve explored how people feel about the economy in a number of different ways. In our latest survey, we were interested to see what we would find if we used the same questions Gallup has used to measure the sentiments of Americans and to see how similar the reactions of Canadians would be. We also assess the potential for a populist reaction as we’ve seen in the United State, Britain, and France.
Here’s what we found:
CURRENT FINANCIAL SITUATION?
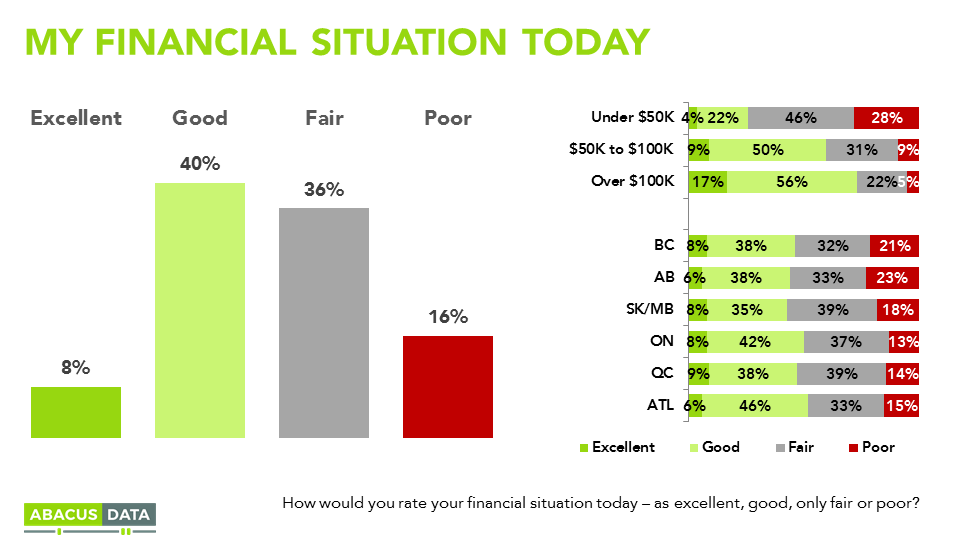
Half (48%) describe their personal financial situation as excellent or good in Canada, another 36% would say it is fair, and 16% say “poor’.
While partisan choices can sometimes have a lot to do with financial well-being, it doesn’t right now: 54% of Liberals say their situation is excellent or good, while 47% of Conservatives and New Democrats do as well.
There also isn’t much difference between younger people and older people: 46% of those under 30 and 47% of those 60 or older say their situation is excellent or good.
The biggest difference, not surprisingly, has to do with income: those with household incomes below $50,000 are twice as likely to describe their financial situation as fair or poor (74% vs. 36%) compared to those with higher incomes.
THINGS IMPROVING OR GETTING WORSE?
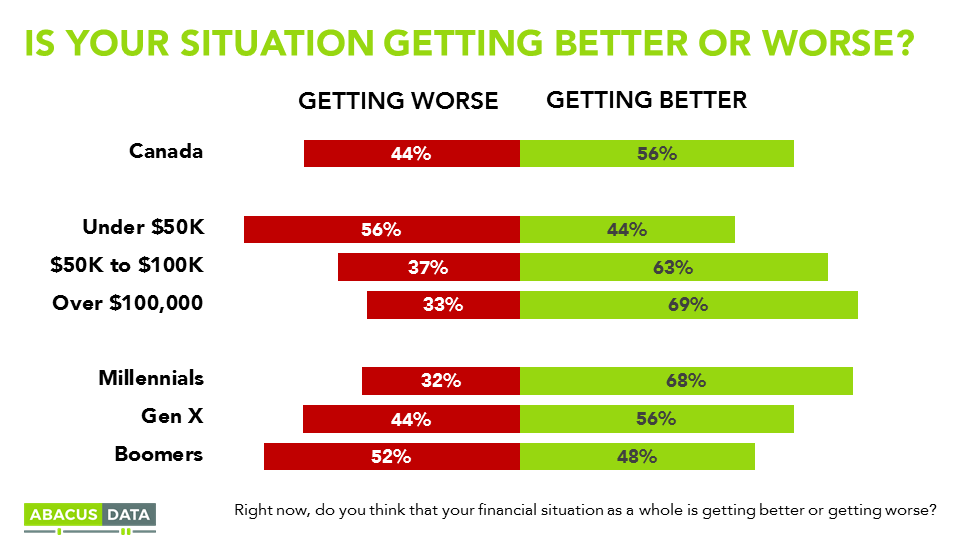
Just over half (56%) say their situation is getting better, compared to 44% who say it is getting worse. Again, there are partisan differences, but perhaps less dramatic than might be expected, if one believed in the thesis that political choice is all “about the economy”.
A majority of Liberals (65%) say their situation is getting better, as do about half (48%) of Conservative and NDP voters.
Millenials are among the most likely (68%) to say their situation is getting better.
Among those with incomes below $50,000, 44% say their situation is getting better compared with 63% and 69% in higher income brackets.
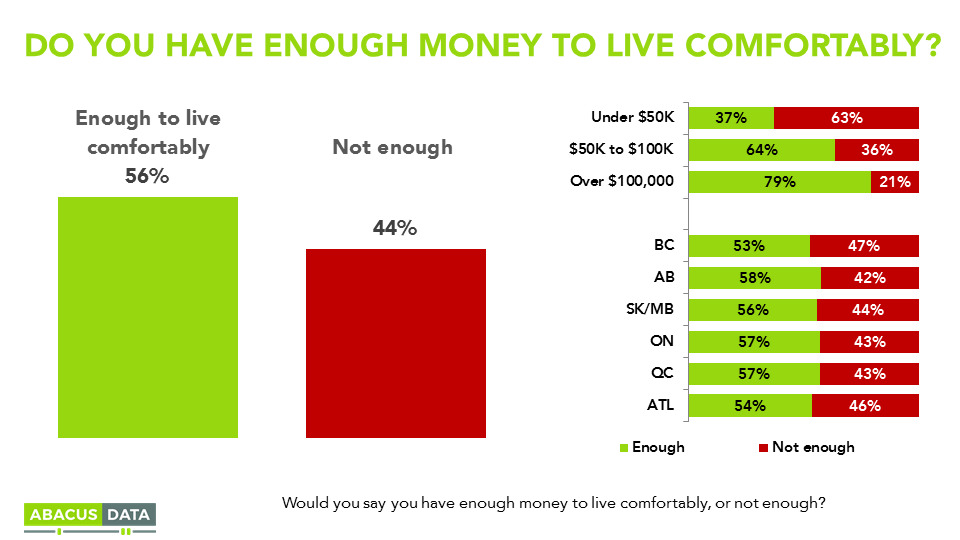
ENOUGH MONEY TO LIVE COMFORTABLY?
A small majority (56%) say they have enough money to live comfortably; 44% say they do not. Remarkably, these numbers vary by only 4 points from a low of 53% in BC to 57% in Quebec.
By partisanship, Conservatives (61%) and Liberals (62%) are within a point of each other, and 55% of NDP supporters say they have enough to live comfortably.
Again, challenging the thesis of a distressed Millennial cohort: 61% of those under 30 say they have enough, as do 60% of those 60 and older.
By income, $50,000 is something a dividing line: below it, less than half have enough, above it, most say they do.
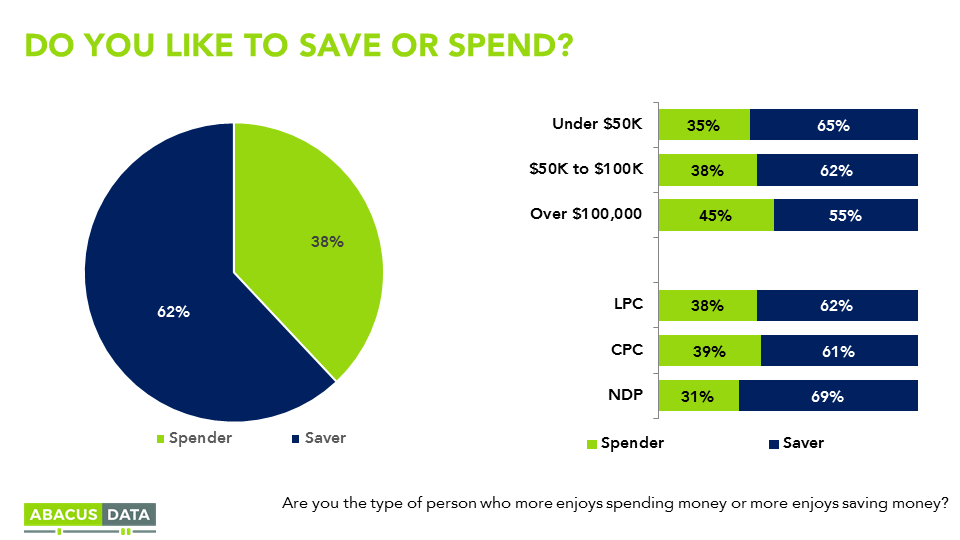
ARE YOU A SAVER OR A SPENDER?
We asked people if they “more enjoy spending money, or more enjoy saving money.” A clear majority (62%) of self-identify as savers, with only modest variations across region, and age, and no difference by gender. NDP voters were the most likely to say they were savers (69%) while Conservatives (61%) and Liberals (62%) were not far behind, and identical.
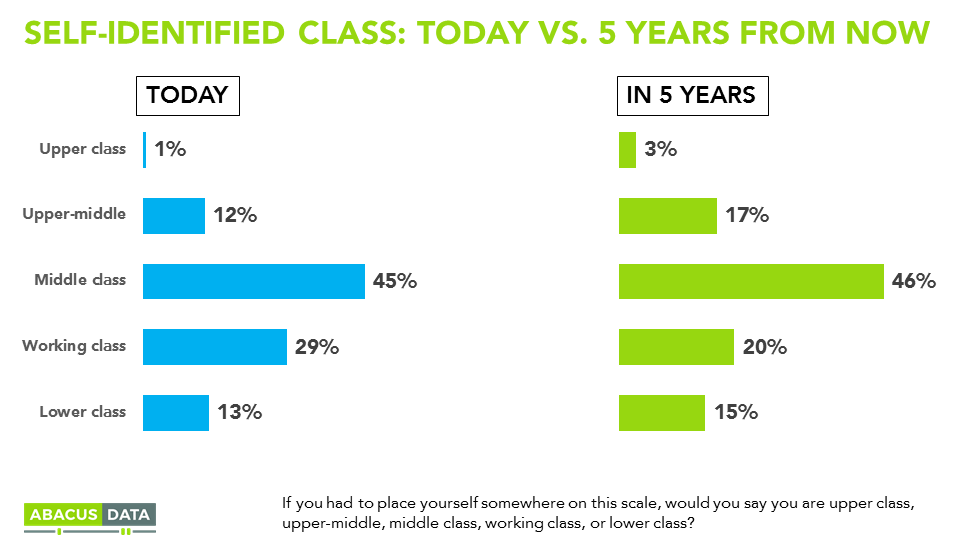
WHAT IS YOUR SOCIAL CLASS?
When asked to choose which class they were in from a list of options provided, 1% said they were “upper class”. None of those people lived west of Ontario, and no New Democrats self-defined that way. Just over one in ten (12%) said they were “upper middle class.”
The plurality across the country (45%), and in every region, age, income group, and gender, self-defined as “middle class”. Another 29% said they were working class, and 13% chose “lower class”.
Asked what they thought their answer to this question would be five years from now, the number of people who said they would be upper class rose by 2 points, “upper middle” rose by 5 points, the number who said they would be working class dropped by 9 points.
Only 10% of “middle class” identifiers thought they would move down the scale (6% to working class, 4% to lower class), while 31% of those who self-identified as “working class” said in five years they would be in the “middle class”.
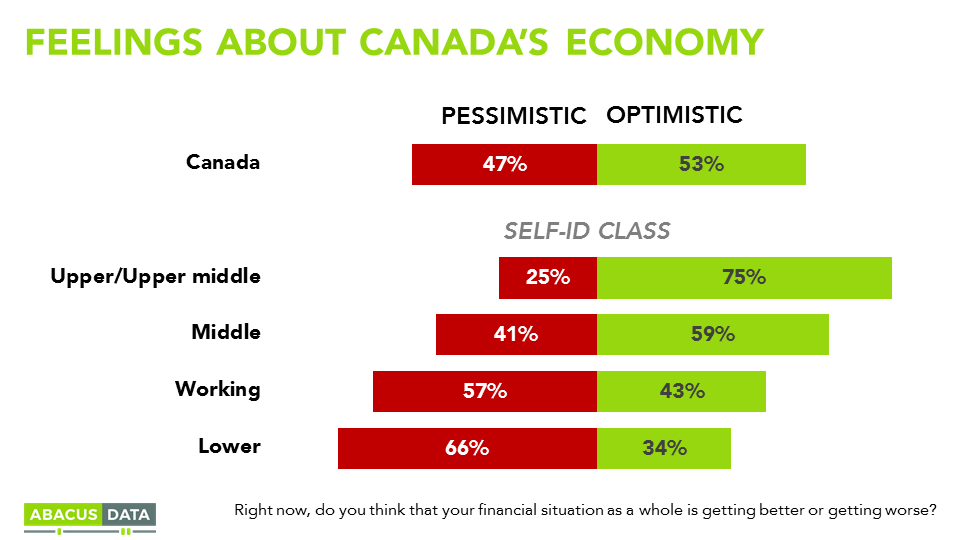
OPTIMISTIC ABOUT CANADA’S ECONOMY?
When asked about the future of the Canadian economy, 53% say they are optimistic, compared to 47% who are pessimistic. Younger people are more optimistic than older people. Albertans are as optimistic as Ontario residents.
The biggest differences revolve around partisanship: Conservative voters are far more pessimistic about the economy than average (65%). We also see a difference depending on one’s self-identified class.

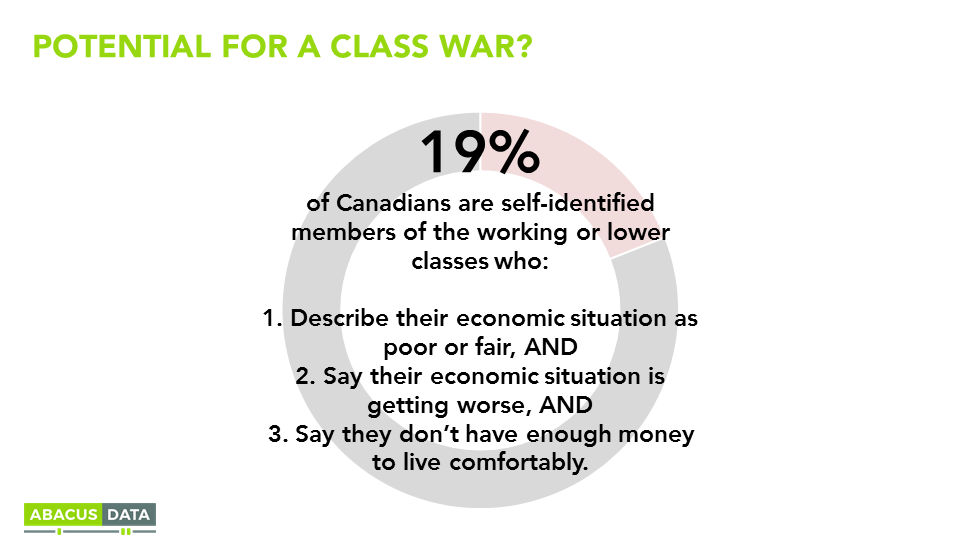
IS A CLASS WAR ON THE HORIZON?
Some have argued that Canada is on the brink of intense class-based conflict. Our data would draw attention to one in five (19%) who self-identify as working or lower class, say their economic situation as fair or poor, say it is getting worse, and don’t have enough money to live comfortably.These Canadians show some of the signs associated with populist voting
These Canadians show some of the signs associated with populist voting behaviour elsewhere. Compared to other Canadians they are 18 points more likely to believe immigration is more harmful than helpful to Canada’s economy, and 17 points more convinced that technology has been bad for their economic well-being.
However, only 20% think Canada should be more like the United States, which is right on the national average. And, in the last federal election, most of them voted for a progressive option (39% Liberal, 23% NDP, 29% Conservative.
COMPARING CANADIANS WITH AMERICANS
Comparing our survey with those of recent Gallup survey findings reveals remarkably small differences in how people on either side of the 49th parallel feel:
• 52% of Americans say their financial situation is excellent or good, 48% in Canada
• 54% in America say their situation is getting better; 56% in Canada.
• 61% of Americans say they are savers; in Canada, 62%.
• 43% of Americans define themselves as middle class, compared to 45% in Canada Canadians. 30% of Americans say they are working class, compared to 29% in Canada.
In Canada, slightly fewer identify as upper or upper-middle (18% in the US 13% in Canada), and slightly more say they are lower class (8% in the US, 13% in Canada)

UPSHOT
According to Bruce Anderson: “These data paint a picture of a Canada that is neither broadly enthusiastic nor deeply dissatisfied with current financial conditions.
Those who imagine a deep generational divide will find little in these numbers to buttress that thesis. Younger people are not all that different from older people in terms of their sense of economic well-being, and indeed are more optimistic.
Economic conditions are often discussed as the axis point around which almost all political choice falls (recall “it’s the economy, stupid” from the Clinton-Bush election), however, our numbers suggest that these are playing muted role in political preference in Canada today.
There are important differences based on household income, but these don’t appear to be, at this point anyway, coalescing into something that looks like an incipient class war. It’s notable that of the 19% who show the greatest economic stress, almost equal numbers voted NDP and Conservative in 2015, while more voted for the centre-progressive Liberals.
The US economy is similar in some ways to Canada’s, but also has major differences too. Despite that, the number of people who feel good or bad about their circumstance, and who identify as middle or working class is remarkably similar – suggesting that while these views have something to do with actual financial conditions, they may, in fact, have more to do with expectations, optimism, pessimism, and psychology more generally.”
METHODOLOGY
Our survey was conducted online with 1,500 Canadians aged 18 and over from April 21 to 24, 2017. A random sample of panelists was invited to complete the survey from a large representative panel of over 500,000 Canadians.
The Marketing Research and Intelligence Association policy limits statements about margins of sampling error for most online surveys. The margin of error for a comparable probability-based random sample of 1,500 is +/- 2.6%, 19 times out of 20.
The data were weighted according to census data to ensure that the sample matched Canada’s population according to age, gender, educational attainment, and region. Totals may not add up to 100 due to rounding.
ABACUS DATA INC.
We offer global research capacity with a strong focus on customer service, attention to detail and value-added insight. Our team combines the experience of our Chairman Bruce Anderson, one of Canada’s leading research executives for two decades, with the energy, creativity and research expertise of CEO David Coletto, Ph.D.